304 Williamette Ave · Alma, MI
Flood risk 1/10 · Minimal
- FEMA flood zone
- X (unshaded)
- Chance of flooding over 30 yrs
- 0.0%
- Est. flood insurance / yr
- $473 – $860
Fire risk 1/10 · Minimal
- Est. fire insurance / yr
- $784 – $1,456
Heat risk 2/10 · Minimal
- Hot days now (above 98°F)
- 7 days/yr
- Hot days in 30 yrs
- 14 days/yr
Wind risk 1/10 · Minimal
- Chance of severe wind over 30 yrs
- —
Air-quality risk 2/10 · Minimal
- Unhealthy air days now
- 1 days/yr
- Unhealthy air days in 30 yrs
- 2 days/yr
Risk factors via First Street. Map © Google.
Why this score? — see what drove the C grade
The composite is a weighted blend of 9 inputs, each scored 0–100. Each bar is that input's sub-score; the figure is the points it added to the 100-point composite (weight × sub-score).
- Cash flow +18.6/30.0
- ARV discount +15.0/15.0
- DSCR +5.8/10.0
- 1% rule +5.0/10.0
- Livability +3.5/5.0
- Schools +3.0/10.0
- Rent growth +2.5/5.0
- Condition / age +2.5/5.0
- Appreciation +0.0/10.0
$89,900
🖨 Deal sheet 📄 Offer letter ✓ Due diligence
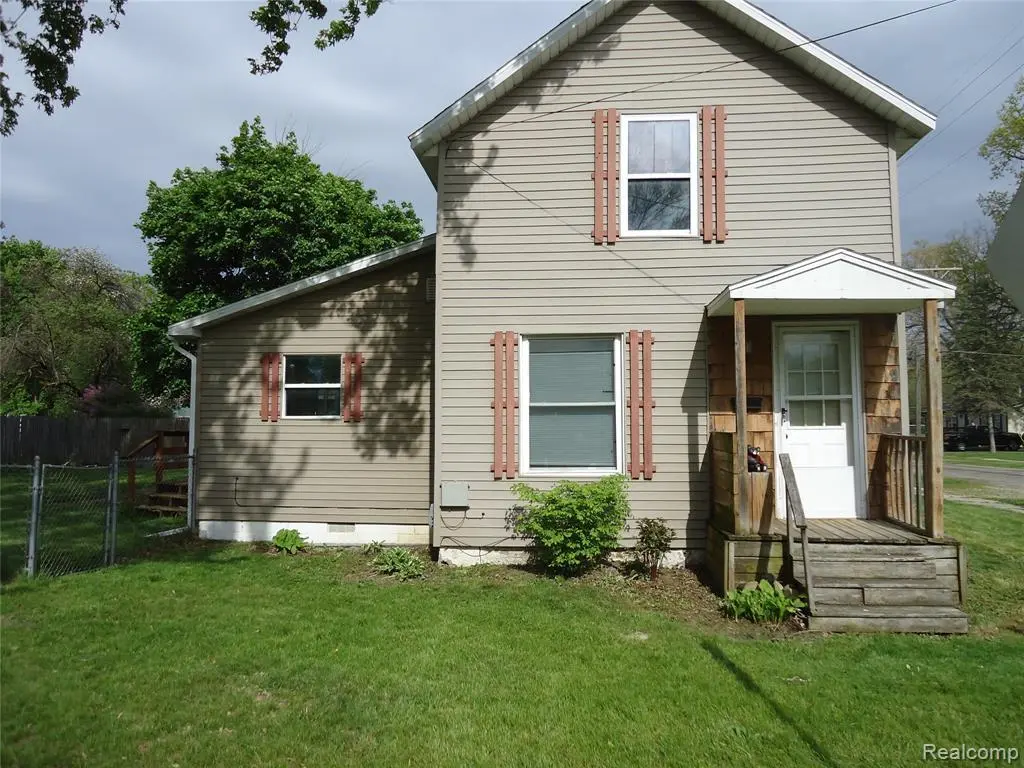
Listing remarks MLS
Excellent investment property or starter home, quiet corner lot on dead end street, lots of exterior updates, new roof in last few years, vinyl siding on house and garage, vinyl windows, one car garage with addition, new door wall to rear deck, electrical panel, gas forced air furnace, nice yard that is mostly fenced in, one bedroom main floor, two upper bedrooms, a little TLC can go a long way on this home, great opportunity to own a home, owner is licensed real estate broker in the state of MI
Key facts
- Quiet corner lot
- Vinyl windows
- Dead end street
Tags
Property features AI
Finance
- Other: Lot approximately 0.12 acres (84 x 62)
- Financial info: Annual property tax listed
Exterior
- Parking: Detached 1-car garage
- Utilities: Public water; Public sewer; Sewer and water available
- Home design: Single-family residence; One and one-half stories; Ground-level entry with steps
- Construction: Vinyl siding; Block foundation
- Exterior features: Covered porch; Deck; Paved road access
Interior
- Bathrooms: One full bathroom
- Heating & cooling: Forced air heating (natural gas); No cooling
- Interior features: Crawl space basement; Five total rooms
Neighborhood map
What this means for you Summary
Snapshot
- This is a 3-bed/1.0-bath single-family listed at $90k.
Deal economics
- At list price, monthly cash flow is $87 ($1k/yr) — positive.
- The deal already cash-flows at list — no discount required.
- To meet the 1% rule (rent ≥ 1% of price), the offer needs to be $90k (0.3% below list).
- Recommended offer: $89k (1.5% below list) — sets the bar for market timing.
- Cap rate 7.5% vs local median 4.2% in Alma — top-decile yield for the area; either an underpriced asset or a hidden risk that comps aren't pricing in. Stress-test before assuming the spread holds.
Location & tenants
- Location reads 69/100 on livability (#345 in MI) — a middle-class / working-renter tenant base. Strengths: cost of living A+, housing A+, health & safety A+; Watch: crime D+, amenities F, commute F.
- Alma Public Schools (town): math 28% / reading 44% proficiency, ranked #288 of 540 in MI (top 53%) — families likely to look elsewhere, expect single-tenant / working-renter base with shorter leases.
- Market conditions: 89 active listings in the ZIP; 2 comparable units currently listed for rent nearby; 47 units permitted in Gratiot County in 2024 (0 in 5+ unit buildings).
Forward outlook
- Local home prices are declining (-3.0%/yr); year-one equity from $622 of loan paydown is wiped out by about $3k of value loss. Plan a longer hold.
- Gratiot County population projected at -14% by 2050 — secular population decline; favor cash flow + early exit over multi-decade hold.
Negotiation context
- It's been on market 25 days — a 2% lower offer ($89k) is reasonable based on typical stale-listing flexibility.
- 3 sale attempts since 16y ago with the ask held roughly flat each time — persistent listings suggest the price (not the market) is what's stuck; bring a comps-based counter.
- Current owner paid $64k; 42% above their basis — modest negotiation headroom, anchor on the comps not their cost.
Questions for the listing agent
- Built in 1960 — when were the roof, HVAC, electrical panel, plumbing, and water heater last replaced?
- Is there a deadline driving the sale (1031 exchange, divorce, estate, relocation)? That informs how much negotiation room exists.
- Crime grade is D in this area — have there been break-ins, vandalism, or insurance claims at this property in the last 3 years? What carrier currently insures it and at what premium?
- What's the average days-on-market for RENTAL listings here right now (not sales)? A rising rental-DOM trend means longer vacancies and softer asking-rent achievability than the comps imply.
- What's the recent tenant-quality profile in this submarket — average credit score on applications, eviction rate, late-payment / NSF rate, and stable-employment percentage? A property-management company in the area should have these aggregated.
- How much new for-sale + rental construction is in the pipeline within 1–3 miles? Heavy new supply typically softens prices + rents 12–24 months out; constrained supply supports both.
Investment metrics
- 1% rule
- 1.00% ✗
- Cap rate
- 7.45%
- Cash-on-cash
- 4.14%
- DSCR
- 1.18
- GRM
- 8.4
CMA / ARV
- ARV (median comp)
- $133,948
- List price
- $89,900
- Delta
- -32.88%
- Verdict
- UNDERPRICED
- Comps
- 20 within 1.0 mi
Show comp detail 12 sales within ~0.75 mi
| Address | Dist | Beds/Ba | Sqft | Sold | Price | $/sf | Match |
|---|---|---|---|---|---|---|---|
| 304 Williamette Ave | 0.00mi | 3/1.0 | 1,159 (0%) | 0mo | $82,000 | $71 | 100 |
| 920 Ely St | 0.32mi | 3/1.0 | 1,178 (+2%) | 3mo | $145,500 | $124 | 80 |
| 1030 Eastward St | 0.12mi | 3/2.0 | 1,240 (+7%) | 3mo | $135,000 | $109 | 76 |
| 616 Bridge Ave | 0.42mi | 3/1.0 | 1,248 (+8%) | 3mo | $105,900 | $85 | 65 |
| 800 Ely St | 0.47mi | 3/1.5 | 1,070 (-8%) | 0mo | $133,800 | $125 | 63 |
| 320 Euclid Ave | 0.49mi | 4/1.0 (+1) | 1,224 (+6%) | 4mo | $68,775 | $56 | 59 |
| 804 Hannah Ave | 0.56mi | 3/1.0 | 1,060 (-8%) | 4mo | $124,000 | $117 | 56 |
| 704 Republic Ave | 0.41mi | 3/1.5 | 1,044 (-10%) | 8mo | $155,000 | $148 | 56 |
| 127 Grafton Ave | 0.72mi | 3/1.5 | 1,192 (+3%) | 6mo | $144,900 | $122 | 55 |
| 726 Pennsylvania Ave | 0.50mi | 2/1.0 (-1) | 1,050 (-9%) | 4mo | $132,000 | $126 | 53 |
| 726 Pennsylvania Ave Lot : 58 | 0.50mi | 2/1.0 (-1) | 1,050 (-9%) | 4mo | $132,000 | $126 | 53 |
| 618 N River Ave | 0.73mi | 2/1.0 (-1) | 1,184 (+2%) | 10mo | $130,000 | $110 | 49 |
Match score weights: distance 35% · size 25% · config 20% · recency 20%. Top-matched comps best support the ARV.
Projected returns pro-forma
-3.0% appreciation · 3.0% rent growth · sell at horizon
- IRR
- -9.8%
- Equity multiple
- 0.64×
- Total profit
- $-9,022
- Equity at exit
- $13,404
- IRR
- -0.4%
- Equity multiple
- 0.97×
- Total profit
- $-677
- Equity at exit
- $7,773
Cash invested: $25,172 (down + closing). Projections, not guarantees.
Landlord ↔ Tenant lean methodology
- Overall (STATE)
- 62 Landlord-Friendly
- State Michigan
- 62 Landlord-Friendly · EVEN
- County
- — inherits STATE
- City
- — inherits STATE
ZIP-level market 48801
- Home prices YoY
- -32.0%
- Active inventory
- 89
- Price-to-rent
- 8.4×
Monthly cashflow live
- Estimated rent
- $896 medium interval (Pro) →
- Mortgage (P&I)
- −$471
- Tax est. 1.5%
- −$112 /mo · $1,348/yr
- Insurance
- −$37
- HOA
- −$0
- Vacancy / Maint / Mgmt
- −$188
- Net cashflow
- $87
Break-even live
UW: 25.0% down · 7.5% · 30yr · 1.5% tax · 5.0% vac · 8.0% maint · 8.0% mgmt
Financing live
Cash to close
- Down payment
- $22,475
- Closing costs
- $2,697
- Reserves months
- —
- Total cash needed
- —
Loan-product check · same deal, 3 products live
Conventional
25% down · 7.5% · 30yr
- Down + closing
- —
- Monthly P&I
- —
- Monthly cashflow
- —
- DSCR
- —
- Eligible?
- —
Personal DTI + credit; lowest rate.
DSCR
20% down · 8.5% · 30yr
- Down + closing
- —
- Monthly P&I
- —
- Monthly cashflow
- —
- DSCR
- —
- Eligible?
- —
No personal income docs; deal must DSCR.
Hard money
10% down · 12.0% · 12mo
- Down + closing
- —
- Monthly P&I
- —
- Monthly cashflow
- —
- DSCR
- —
- Eligible?
- —
Short-term bridge; refi at stabilization.
Rent comps 2 comps
| Address | Beds | Baths | Sqft | Rent | $/sqft | DOM | Units | Dist |
|---|---|---|---|---|---|---|---|---|
| 240 Windsor St Alma, MI | 1.0–2.0 | 1.0 | 675 | $875 | $1.30 | 43d | 1 | 0.47mi |
| 307 W Elizabeth St Unit 307 Alma, MI | 2.0 | 1.0 | 750 | $950 | $1.27 | 43d | 1 | 1.30mi |
Listing history 10 events
-
2026-06-07statusdays on market $89,900 Pending 25 DOM
-
2026-06-04days on market $89,900 Active 22 DOM
-
2026-06-02days on market $89,900 Active 21 DOM
-
2026-06-01days on market $89,900 Active 20 DOM
-
2026-05-31days on market $89,900 Active 19 DOM
-
2026-05-31days on market $89,900 Active 18 DOM
-
2026-05-12$89,900 Active 500-char remark
Show marketing remark (500 chars)
Excellent investment property or starter home, quiet corner lot on dead end street, lots of exterior updates, new roof in last few years, vinyl siding on house and garage, vinyl windows, one car garage with addition, new door wall to rear deck, electrical panel, gas forced air furnace, nice yard that is mostly fenced in, one bedroom main floor, two upper bedrooms, a little TLC can go a long way on this home, great opportunity to own a home, owner is licensed real estate broker in the state of MI
-
2021-10-29soldstatus $63,500
-
2010-04-29$47,900
ⓘ Source: listings_history table (triggers on properties + properties_extension) + one-shot
backfill from property_details.listing_events for pre-trigger history.
Climate risk First Street
- Flood 1/10 Low FEMA zone X (unshaded) · 0% chance over 30 yrs
- Wildfire 1/10 Low
- Heat 2/10 Low 7 d/yr ≥98°F today · 14 d/yr by 30 yrs out
- Wind 1/10 Low
- Air quality 2/10 Low 1 unhealthy d/yr today · 2 by 30 yrs out
Nearby sold comps map
Loading sold comps map…
Walkable amenities ~0.75 mi
Loading nearby amenities…
Taxation est. · year 1
- Rental income
- $10,757
- − Mortgage interest
- −$5,036
- − Property taxes
- −$1,348
- − Insurance
- −$450
- − Repairs & maintenance
- −$861
- − Management
- −$861
- − Depreciation
- −$2,615
- Taxable loss
- −$414
- Est. tax savings @ 24.0%
- +$99
- After-tax cash flow
- $1,142/yr
For passive investors: Depreciation is non-cash, so a rental often shows a tax loss while cash-flowing — sheltering income. Rental losses are passive: they offset passive income freely, and up to $25,000/yr can offset ordinary (W-2) income if you actively participate and your MAGI is under $100k (phasing out to $0 by $150k); unused losses carry forward. On sale, claimed depreciation is recaptured at up to 25%, and gains may owe capital-gains tax (a 1031 exchange can defer both). Figures are a year-1 estimate at your 24.0% rate — not tax advice; consult a CPA.
Schools (NCES district)
- District
- Alma Public Schools
- NCES district ID
- 2602640
- Math proficiency
- 28% ▼ -9.00%
- Reading proficiency
- 44% ▼ -3.00%
- Median HH income
- $36,651
- Composite
- 29.84/100
- National rank
- #6415
- State rank
- #288 of 540 in MI
Livability — Alma
- Score
- 69/100
- State rank
- #345
- US rank
- #8809
Category grades
Schools grade is shown separately in the Schools card above.
Census & demographics
- Census place
- Alma, MI
- City population
- 13,433
- Population (ZIP)
- 13,433
Population outlook (Gratiot County) Hauer SSP2
- Today (2025)
- 39,991 people
- By 2030
- 38,944 · -2.6%
- By 2040
- 36,694 · -8.2%
- By 2050
- 34,314 · -14.2%
- By 2075
- 27,693 · -30.8%
- By 2100
- 20,809 · -48.0%
Race, ethnicity, and origin ACS 2023
- Neighborhood character
- Predominantly White (85%)
- Race & ethnicity
- White 85% Hispanic / Latino 10% Two or more races 4% Black 2% Asian 1%
- Hispanic origin (detail)
- Mexican 8%
- Common ancestry
- Romanian 5% Slovak 3% Iranian 2%
- Foreign-born
- 2% · Canada, South Korea
- Languages at home
- 94% English-only · Spanish 4% French/Haitian/Cajun 1%
Political lean MEDSL · Gratiot
- 2024 margin
- Solid R (+31.3) · D 33.7% · R 65.0% · Other 1.4%
- 2008→2024 swing
- -35.7pp toward R · 2008: 4.4pp · 2024: -31.3pp
- All cycles
- 2024: R+31.3 2020: R+28.3 2016: R+25.6 2012: R+3.9 2008: D+4.4
Not yet ingested
- Civics
- —
Market trends
- HPI YoY
- ▼ -99.16%
- Current HPI
- 210.3208
- Rent YoY
- —
- Metro
- —
- State GDP YoY
- ▲ 1.37%
- F500 in state
- 28
Industry mix (Fortune 500 HQ in MI)
| Industry | F500 HQs | Revenue |
|---|---|---|
| Automotive Parts | 3 | $48B |
|
||
| Automotive | 2 | $372B |
|
||
| Chemicals | 1 | $45B |
|
||
| Automotive Retail | 1 | $29B |
|
||
| Healthcare / Medical Devices | 1 | $23B |
|
||
| Automotive Technology | 1 | $20B |
|
||
Price history
+87.7% since first listed6 events — show timeline
- 2026-06-06 Pending — MiRealSource-MiMLS
- 2026-06-06 Pending — REALCOMP
- 2026-05-12 Listed $89,900 REALCOMP
- 2026-05-12 Listed $89,900 MiRealSource-MiMLS
- 2021-10-29 Sold (Public Records) $63,500 Public Records
- 2010-04-29 Listed $47,900 MiRealSource-MiMLS
Cash-flow waterfall
monthlySold comps — $/sqft
last 12 mo · ≤1 miLoading sold comps…