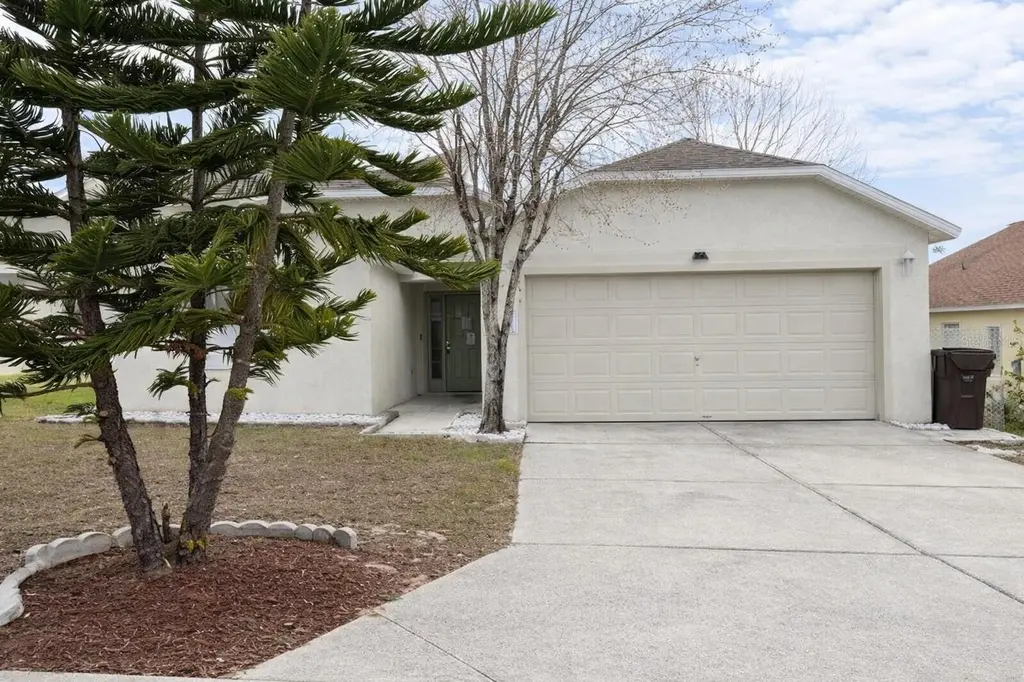
551 Lake Charles Dr · Haines City, FL
Flood risk 1/10 · Minimal
- FEMA flood zone
- X (unshaded)
- Chance of flooding over 30 yrs
- 0.0%
- Est. flood insurance / yr
- $507 – $1,088
Fire risk 5/10 · Moderate
- Est. fire insurance / yr
- $947 – $1,759
Heat risk 9/10 · Severe
- Hot days now (above 108°F)
- 7 days/yr
- Hot days in 30 yrs
- 25 days/yr
Wind risk 9/10 · Severe
- Chance of severe wind over 30 yrs
- 99.0%
Air-quality risk 1/10 · Minimal
- Unhealthy air days now
- 0 days/yr
- Unhealthy air days in 30 yrs
- 0 days/yr
Risk factors via First Street. Map © Google.
Why this score? — see what drove the D grade
The composite is a weighted blend of 9 inputs, each scored 0–100. Each bar is that input's sub-score; the figure is the points it added to the 100-point composite (weight × sub-score).
- Cash flow +13.1/30.0
- ARV discount +7.5/15.0
- 1% rule +5.0/10.0
- DSCR +3.9/10.0
- Livability +3.7/5.0
- Schools +3.5/10.0
- Condition / age +2.5/5.0
- Rent growth +1.8/5.0
- Appreciation +0.0/10.0
$230,000
🖨 Deal sheet (PDF) 📄 Offer letter ✓ Due diligence
Listing remarks MLS
One or more photo(s) has been virtually staged. This Davenport one-story home offers a patio, and a two-car garage.
Key facts
- Open layout
- Enclosed porch
- 6,064 sq ft lot
Tags
Neighborhood map
What this means for you Summary
Snapshot
- This is a 3-bed/2.0-bath single-family listed at $230k.
Deal economics
- At list price, monthly cash flow is $-7 ($-80/yr) — negative.
- To cash-flow at today's rent, offer at most $229k (0.5% below list).
- Meets the 1% rule at list price ($2k rent vs $230k).
- Recommended offer: $223k (3.0% below list) — sets the bar for market timing.
Location & tenants
- Location reads 74/100 on livability (#285 in FL, #4,575 nationally) — a middle-class / working-renter tenant base. Strengths: crime A+, cost of living A+, housing A+; Watch: amenities F, commute F, employment F.
- Polk (suburban): math 39% / reading 43% proficiency, ranked #62 of 73 in FL (top 85%) — families likely to look elsewhere, expect single-tenant / working-renter base with shorter leases.
- Zoned schools: Horizons Elementary School (math 37% / reading 39%, grade F, #1,587 of 2,144 statewide, top 74%, 1,468 students, 42% FRL); Shelley S. Boone Middle School (math 25% / reading 25%, grade F, #517 of 571 statewide, top 91%, 1,403 students, 52% FRL); Ridge Community High School (math 12% / reading 33%, grade F, #539 of 667 statewide, top 81%, 2,711 students, 48% FRL).
- Zoned-school proficiency averages 28% at this address vs 41% district-wide (-12 pts) — the specific schools serving this property underperform the Polk average; the district grade overstates school quality for this exact location.
- Market conditions: Rents soft (-2.7%/yr); 1396 active listings in the ZIP; 40 comparable units currently listed for rent nearby; rentals at typical pace (median 16d on market — plan ~3-4 weeks tenant-placement turnaround); solid renter incomes; 10,384 units permitted in Polk County in 2024 (1,716 in 5+ unit buildings).
- This rent runs 34% of the median local income ($81k/yr) — at the standard rent-burdened threshold; future hikes will face affordability resistance.
Forward outlook
- Local home prices are declining (-3.0%/yr); year-one equity from $2k of loan paydown is wiped out by about $7k of value loss. Plan a longer hold.
- Polk County population projected at +33% by 2050 — long-run rental-demand tailwind backs the buy-and-hold thesis.
Negotiation context
- It's been on market 48 days — a 3% lower offer ($223k) is reasonable based on typical stale-listing flexibility.
- 6 sale attempts since 10y ago with the ask held roughly flat each time — persistent listings suggest the price (not the market) is what's stuck; bring a comps-based counter.
Risks & watch-outs
- Watch-outs: property tax is 2.5% of price.
- Climate carrying-cost: severe wind risk, 99% chance of damaging wind over 30y; moderate wildfire risk; extreme-heat days projected 7→25/yr by 2055 (HVAC capex compounding) — expect insurance premiums to compound above CPI over the hold.
Questions for the listing agent
- What do current leases actually rent for vs. the listed asking? Can we see a recent rent roll and the last 12 months of T-12 income?
- It's been on market 48 days. Have you received any prior offers? Is the seller open to a 3% concession, seller financing, or rate buy-down credit?
- Property tax is high relative to price — has the assessment been appealed recently, and will the sale trigger a re-assessment?
- What does the HOA fee cover, when was the last increase, and are there any pending special assessments or reserve-fund shortfalls?
- Is there a deadline driving the sale (1031 exchange, divorce, estate, relocation)? That informs how much negotiation room exists.
- Schools are D-rated, which usually means shorter tenancies and higher turnover. Who's the typical renter profile here, and what's been the actual vacancy rate?
- The area grade is low — what's the realistic commute time and amenity access for the typical tenant pool here? Any planned neighborhood developments (good or bad) we should know about?
- What's the average days-on-market for RENTAL listings here right now (not sales)? A rising rental-DOM trend means longer vacancies and softer asking-rent achievability than the comps imply.
- What's the recent tenant-quality profile in this submarket — average credit score on applications, eviction rate, late-payment / NSF rate, and stable-employment percentage? A property-management company in the area should have these aggregated.
- How much new for-sale + rental construction is in the pipeline within 1–3 miles? Heavy new supply typically softens prices + rents 12–24 months out; constrained supply supports both.
Investment metrics
- 1% rule
- 1.00% ✓
- Cap rate
- 6.26%
- Cash-on-cash
- -0.12%
- DSCR
- 0.99
- GRM
- 8.3
CMA / ARV
No comps found within radius.
Projected returns pro-forma
-3.0% appreciation · 0.0% rent growth · sell at horizon
- IRR
- -20.4%
- Equity multiple
- 0.31×
- Total profit
- $-44,260
- Equity at exit
- $34,294
- IRR
- -23.8%
- Equity multiple
- -0.00×
- Total profit
- $-64,421
- Equity at exit
- $19,886
Cash invested: $64,400 (down + closing). Projections, not guarantees.
Landlord ↔ Tenant lean methodology
- Overall (STATE)
- 87 Strongly Landlord-Friendly
- State Florida
- 87 Strongly Landlord-Friendly · R+3
- County
- — inherits STATE
- City
- — inherits STATE
ZIP-level market 33837
- Home prices YoY
- -33.9%
- Rents YoY
- -2.7%
- Active inventory
- 1396
- Price-to-rent
- 8.3×
Monthly cashflow live
- Estimated rent
- $2,301 high interval (Pro) →
- Mortgage (P&I)
- −$1,206
- Tax from tax record
- −$481 /mo · $5,777/yr
- Insurance
- −$96
- HOA
- −$41
- Vacancy / Maint / Mgmt
- −$483
- Net cashflow
- $-7
Break-even live
Sensitivity live
| Price | -10% $124 | -5% $58 | +0% $-7 | +5% $-72 | +10% $-137 |
|---|---|---|---|---|---|
| Rent | -10% $-188 | -5% $-98 | +0% $-7 | +5% $84 | +10% $175 |
| Rate | -1.0pp $109 | -0.5pp $52 | base $-7 | +0.5pp $-66 | +1.0pp $-127 |
UW: 25.0% down · 7.5% · 30yr · 1.5% tax · 5.0% vac · 8.0% maint · 8.0% mgmt
Financing live
Cash to close
- Down payment
- $57,500
- Closing costs
- $6,900
- Reserves months
- —
- Total cash needed
- —
Loan-product check · same deal, 3 products live
Conventional
25% down · 7.5% · 30yr
- Down + closing
- —
- Monthly P&I
- —
- Monthly cashflow
- —
- DSCR
- —
- Eligible?
- —
Personal DTI + credit; lowest rate.
DSCR
20% down · 8.5% · 30yr
- Down + closing
- —
- Monthly P&I
- —
- Monthly cashflow
- —
- DSCR
- —
- Eligible?
- —
No personal income docs; deal must DSCR.
Hard money
10% down · 12.0% · 12mo
- Down + closing
- —
- Monthly P&I
- —
- Monthly cashflow
- —
- DSCR
- —
- Eligible?
- —
Short-term bridge; refi at stabilization.
Rent comps 40 comps
| Address | Beds | Baths | Sqft | Rent | $/sqft | DOM | Units | Dist |
|---|---|---|---|---|---|---|---|---|
| 106 Delancey Dr Davenport, FL | 3.0 | 2.0 | 1788 | $2,000 | $1.12 | 25d | 1 | 0.11mi |
| 2429 Maidens Bluff Ave Unit Cali Davenport, FL | 4.0 | 2.0 | 1828 | $2,469 | $1.35 | 5d | 1 | 0.13mi |
| 2510 Declaration St Davenport, FL | 3.0–5.0 | 2.0–3.0 | 2136 | $2,050 | $0.96 | 5d | 2 | 0.15mi |
| 1001 Lake Charles Dr Davenport, FL | 3.0 | 2.0 | 1788 | $1,895 | $1.06 | 25d | 1 | 0.17mi |
| 4264 Chester Springs Blvd Davenport, FL | 3.0 | 2.5 | 1699 | $1,850 | $1.09 | 23d | 1 | 0.38mi |
| 1257 Hendon Loop Davenport, FL | 4.0 | 3.0 | 1775 | $2,460 | $1.39 | 16d | 1 | 0.42mi |
| 210 Garberia Dr Davenport, FL | 3.0 | 2.0 | 1433 | $1,995 | $1.39 | 4d | 1 | 0.50mi |
| 905 Citrus Reserve Blvd Davenport, FL | 4.0 | 3.0 | 2109 | $2,800 | $1.33 | 16d | 1 | 0.55mi |
| 868 Brooklet Dr Davenport, FL | 3.0 | 2.0 | 1725 | $2,250 | $1.30 | 25d | 1 | 0.56mi |
| 3633 Cambridge Brook Dr Davenport, FL | 4.0 | 2.0 | 1580 | $2,450 | $1.55 | 25d | 1 | 0.59mi |
| 3418 Haven Side Rd Davenport, FL | 4.0 | 3.0 | 2203 | $2,495 | $1.13 | 25d | 1 | 0.66mi |
| 316 Bandon Dunes Loop Davenport, FL | 4.0 | 2.5 | 1950 | $2,550 | $1.31 | 25d | 1 | 0.69mi |
| 729 Brooklet Dr Davenport, FL | 3.0 | 2.0 | 1516 | $2,300 | $1.52 | 13d | 1 | 0.73mi |
| 518 Noble Ave Davenport, FL | 3.0 | 2.0 | 1670 | $1,950 | $1.17 | 25d | 1 | 0.73mi |
| 420 Noble Ave Davenport, FL | 3.0 | 2.0 | 1725 | $2,175 | $1.26 | 16d | 1 | 0.77mi |
| 737 Citrus Reserve Blvd Davenport, FL | 4.0 | 2.0 | 2080 | $3,000 | $1.44 | 25d | 1 | 0.77mi |
| 497 Noble Ave Davenport, FL | 4.0 | 2.0 | 1989 | $2,300 | $1.16 | 25d | 1 | 0.79mi |
| 1909 Chickasaw Blvd Davenport, FL | 3.0 | 2.0 | 1725 | $2,050 | $1.19 | 5d | 1 | 0.79mi |
| 363 Nova Dr Davenport, FL | 3.0 | 2.0 | 1770 | $1,900 | $1.07 | 16d | 1 | 0.80mi |
| 405 Noble Ave Davenport, FL | 4.0 | 2.0 | 1867 | $2,330 | $1.25 | 25d | 1 | 0.82mi |
| 1004 Brooklet Dr Davenport, FL | 4.0 | 2.0 | 1875 | $2,230 | $1.19 | 4d | 1 | 0.84mi |
| 2617 Magnolia Ave Davenport, FL | 4.0 | 3.0 | 2523 | $2,700 | $1.07 | 25d | 1 | 0.86mi |
| 1246 Red Hill Rd Davenport, FL | 4.0 | 2.0 | 1867 | $2,280 | $1.22 | 5d | 1 | 0.86mi |
| 2441 Oakwood Ln Davenport, FL | 3.0 | 2.0 | 1420 | $2,199 | $1.55 | 25d | 1 | 0.90mi |
| 1548 Catbriar Way Davenport, FL | 3.0 | 2.0 | 1400 | $1,990 | $1.42 | 16d | 1 | 0.91mi |
| 384 Citrus Pointe Dr Davenport, FL | 4.0 | 2.0 | 1820 | $2,250 | $1.24 | 25d | 1 | 0.94mi |
| 353 Citrus Pointe Dr Davenport, FL | 4.0 | 2.5 | 1923 | $2,285 | $1.19 | 5d | 1 | 0.95mi |
| 1779 Buckeye Rd Davenport, FL | 3.0 | 2.0 | 1725 | $2,100 | $1.22 | 16d | 1 | 0.97mi |
| 1188 Sugarwood St Davenport, FL | 3.0 | 2.0 | 1443 | $2,400 | $1.66 | 25d | 1 | 0.98mi |
| 365 Citrus Pointe Dr Davenport, FL | 3.0 | 2.0 | 1975 | $2,500 | $1.27 | 23d | 1 | 0.99mi |
| 1724 Buckeye Rd Davenport, FL | 4.0 | 2.0 | 1867 | $2,450 | $1.31 | 25d | 1 | 1.00mi |
| 2343 Canyon Oak Dr Davenport, FL | 4.0 | 2.0 | 1867 | $2,150 | $1.15 | 16d | 1 | 1.05mi |
| 233 Hamlet Rd Unit n/a Davenport, FL | 3.0 | 2.0 | 1718 | $1,950 | $1.14 | 15d | 1 | 1.07mi |
| 569 Disa Dr Davenport, FL | 4.0 | 2.0 | 1767 | $2,200 | $1.25 | 5d | 1 | 1.11mi |
| 584 Disa Dr Davenport, FL | 4.0 | 2.0 | 1767 | $2,200 | $1.25 | 5d | 1 | 1.12mi |
| 2205 Aquifer Ln Davenport, FL | 3.0 | 2.0 | 1444 | $2,000 | $1.39 | 25d | 1 | 1.15mi |
| 220 Champions Way Davenport, FL | 1.0–3.0 | 1.0–2.5 | 1107 | $1,997 | $1.80 | 4d | 7 | 1.17mi |
| 203 Bella Dr Davenport, FL | 4.0 | 2.0 | 1867 | $2,205 | $1.18 | 5d | 1 | 1.18mi |
| 2043 Punch Bowl Ave Davenport, FL | 4.0 | 2.0 | 1930 | $2,250 | $1.17 | 16d | 1 | 1.18mi |
| 2178 Aquifer Ln Davenport, FL | 3.0 | 2.0 | 1470 | $2,000 | $1.36 | 25d | 1 | 1.20mi |
HOA detail
- Monthly dues
- $41 · $492/yr
Listing history 31 events
-
2026-06-22days on market $230,000 Active 48 DOM
-
2026-06-18days on market $230,000 Active 45 DOM
-
2026-06-17days on market $230,000 Active 44 DOM
-
2026-06-16days on market $230,000 Active 43 DOM
-
2026-06-15days on market $230,000 Active 42 DOM
-
2026-06-13days on market $230,000 Active 40 DOM
-
2026-06-10days on market $230,000 Active 37 DOM
-
2026-06-09days on market $230,000 Active 36 DOM
-
2026-06-08days on market $230,000 Active 35 DOM
-
2026-06-07days on market $230,000 Active 34 DOM
-
2026-06-05days on market $230,000 Active 31 DOM
-
2026-06-03days on market $230,000 Active 30 DOM
-
2026-06-03days on market $230,000 Active 29 DOM
-
2026-06-01days on market $230,000 Active 28 DOM
-
2026-05-31days on market $230,000 Active 27 DOM
-
2026-04-15status Pending
-
2026-03-23$230,000 Active
-
2025-06-07historical
-
2024-12-30$280,000 Active
-
2021-10-25soldstatus $279,000
-
2021-10-12soldstatus $279,000 Closed 115-char remark
Show marketing remark (115 chars)
One or more photo(s) has been virtually staged. This Davenport one-story home offers a patio, and a two-car garage.
-
2021-08-30status Pending 115-char remark
Show marketing remark (115 chars)
One or more photo(s) has been virtually staged. This Davenport one-story home offers a patio, and a two-car garage.
-
2021-08-24$280,000 Active 115-char remark
Show marketing remark (115 chars)
One or more photo(s) has been virtually staged. This Davenport one-story home offers a patio, and a two-car garage.
-
2021-07-22soldstatus $269,100
-
2017-02-09historical
-
2017-01-20$174,950 Active
-
2016-10-26historical
-
2016-10-17status Active
-
2016-10-17historical
-
2016-10-05$175,000 Active
-
2004-05-13soldstatus $350,000
ⓘ Source: listings_history table (triggers on properties + properties_extension) + one-shot
backfill from property_details.listing_events for pre-trigger history.
Tax reassessment forecast FL · Resets to sale price
- Current annual tax
- $5,777 · $481/mo
- Projected year-2 tax
- $5,777 · $481/mo
- Expected delta
- $0/yr ($0/mo · 0.0%)
ⓘ Screening estimate from a state-policy table — verify with the county assessor before closing.
Climate risk First Street
- Flood 1/10 Low FEMA zone X (unshaded) · 0% chance over 30 yrs
- Wildfire 5/10 Major
- Heat 9/10 Extreme 7 d/yr ≥108°F today · 25 d/yr by 30 yrs out
- Wind 9/10 Extreme 99% chance of damaging wind over 30 yrs
- Air quality 1/10 Low 0 unhealthy d/yr today · 0 by 30 yrs out
Nearby sold comps map
Loading sold comps map…
Walkable amenities ~0.75 mi
Loading nearby amenities…
Taxation est. · year 1
- Rental income
- $27,611
- − Mortgage interest
- −$12,884
- − Property taxes
- −$5,777
- − Insurance
- −$1,150
- − Repairs & maintenance
- −$2,209
- − Management
- −$2,209
- − HOA
- −$492
- − Depreciation
- −$6,691
- Taxable loss
- −$3,800
- Est. tax savings @ 24.0%
- +$912
- After-tax cash flow
- $832/yr
For passive investors: Depreciation is non-cash, so a rental often shows a tax loss while cash-flowing — sheltering income. Rental losses are passive: they offset passive income freely, and up to $25,000/yr can offset ordinary (W-2) income if you actively participate and your MAGI is under $100k (phasing out to $0 by $150k); unused losses carry forward. On sale, claimed depreciation is recaptured at up to 25%, and gains may owe capital-gains tax (a 1031 exchange can defer both). Figures are a year-1 estimate at your 24.0% rate — not tax advice; consult a CPA.
Schools (NCES district)
- District
- Polk
- NCES district ID
- 1201590
- Math proficiency
- 39% ▼ -11.00%
- Reading proficiency
- 43% ▼ -4.00%
- Median HH income
- $43,979
- Composite
- 34.74/100
- National rank
- #5132
- State rank
- #62 of 73 in FL
Livability — Haines City
- Score
- 74/100
- State rank
- #285
- US rank
- #4575
Category grades
Schools grade is shown separately in the Schools card above.
Census & demographics
- Census place
- Haines City, FL
- County
- Polk County · 740,051 people
- City population
- 51,255
- Metro
- Lakeland-Winter Haven, FL
- Population (ZIP)
- 47,389
- Household income
- $81,276
- Rent vs Own
- Severe rent burden
- 424.0
Population outlook (Polk County) Hauer SSP2
- Today (2025)
- 752,975 people
- By 2030
- 804,621 · +6.9%
- By 2040
- 906,117 · +20.3%
- By 2050
- 1,000,476 · +32.9%
- By 2075
- 1,197,520 · +59.0%
- By 2100
- 1,271,518 · +68.9%
Race, ethnicity, and origin ACS 2023
- Neighborhood character
- Diverse neighborhood (Simpson 0.68)
- Race & ethnicity
- Hispanic / Latino 42% White 36% Two or more races 16% Black 15% Asian 2%
- Hispanic origin (detail)
- Mexican 7% Puerto Rican 22% Cuban 2% Dominican 1%
- Common ancestry
- Hispanic 5% Romanian 3% Lithuanian 1%
- Foreign-born
- 18% · Canada, Jamaica
- Languages at home
- 55% English-only · Spanish 35% French/Haitian/Cajun 6% Other Indo-European 2%
Political lean MEDSL · Polk
- 2024 margin
- Strong R (+20.7) · D 39.2% · R 59.9%
- 2008→2024 swing
- -14.6pp toward R · 2008: -6.1pp · 2024: -20.7pp
- All cycles
- 2024: R+20.7 2020: R+14.4 2016: R+14.1 2012: R+6.8 2008: R+6.1
Not yet ingested
- Civics
- —
Market trends
- HPI YoY
- ▼ -131.62%
- Current HPI
- 256.8165
- Rent YoY
- ▼ -2.73%
- Metro
- Lakeland-Winter Haven, FL
- State GDP YoY
- ▲ 3.28%
- F500 in state
- 36
Industry mix (Fortune 500 HQ in FL)
| Industry | F500 HQs | Revenue |
|---|---|---|
| Industrial Technology | 2 | $29B |
|
||
| Insurance | 2 | $17B |
|
||
| Retail | 1 | $60B |
|
||
| Technology Distribution | 1 | $58B |
|
||
| Homebuilding | 1 | $35B |
|
||
| Technology Manufacturing | 1 | $35B |
|
||
Price history
-34.3% since first listed16 events — show timeline
- 2026-04-15 Pending — Stellar MLS as Distributed by MLS Grid
- 2026-03-23 Listed $230,000 Stellar MLS as Distributed by MLS Grid
- 2025-06-07 Listing Removed — Stellar MLS as Distributed by MLS Grid
- 2024-12-30 Listed $280,000 Stellar MLS as Distributed by MLS Grid
- 2021-10-25 Sold (Public Records) $279,000 Public Records
- 2021-10-12 Sold (MLS) $279,000 Stellar MLS as Distributed by MLS Grid
- 2021-08-30 Pending — Stellar MLS as Distributed by MLS Grid
- 2021-08-24 Listed $280,000 Stellar MLS as Distributed by MLS Grid
- 2021-07-22 Sold (Public Records) $269,100 Public Records
- 2017-02-09 Listing Removed — Stellar MLS as Distributed by MLS Grid
- 2017-01-20 Listed $174,950 Stellar MLS as Distributed by MLS Grid
- 2016-10-26 Listing Removed — Stellar MLS as Distributed by MLS Grid
- 2016-10-17 Relisted — Stellar MLS as Distributed by MLS Grid
- 2016-10-17 Listing Removed — Stellar MLS as Distributed by MLS Grid
- 2016-10-05 Listed $175,000 Stellar MLS as Distributed by MLS Grid
- 2004-05-13 Sold (Public Records) $350,000 Public Records
Property tax history
+16.0%/yrLatest (2025): $5,777 · -3.2% YoY. Source: county tax records.
Cash-flow waterfall
monthlySold comps — $/sqft
last 12 mo · ≤1 miLoading sold comps…