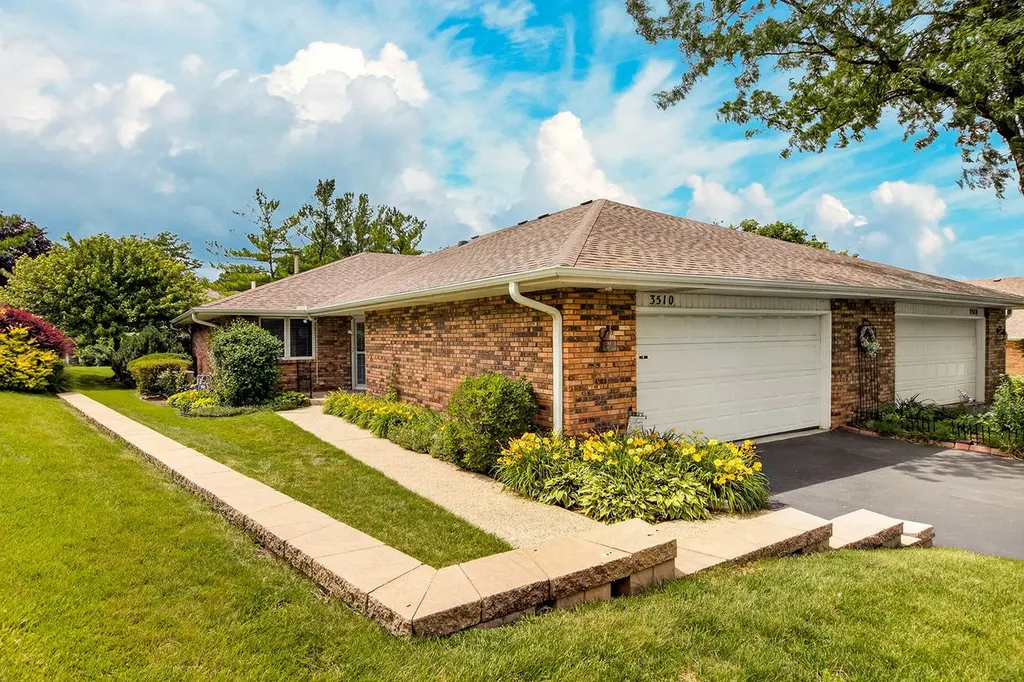
3510 Grandview Dr · Rockford, IL
Flood risk No data
- FEMA flood zone
- —
- Chance of flooding over 30 yrs
- —
- Est. flood insurance / yr
- —
Fire risk No data
- Est. fire insurance / yr
- —
Heat risk No data
- Hot days now (above threshold)
- —
- Hot days in 30 yrs
- —
Wind risk No data
- Chance of severe wind over 30 yrs
- —
Air-quality risk No data
- Unhealthy air days now
- —
- Unhealthy air days in 30 yrs
- —
Risk factors via First Street. Map © Google.
Why this score? — see what drove the C- grade
The composite is a weighted blend of 9 inputs, each scored 0–100. Each bar is that input's sub-score; the figure is the points it added to the 100-point composite (weight × sub-score).
- Cash flow +23.2/30.0
- ARV discount +7.5/15.0
- DSCR +7.4/10.0
- 1% rule +6.9/10.0
- Livability +3.1/5.0
- Rent growth +2.5/5.0
- Condition / age +2.5/5.0
- Schools +1.2/10.0
- Appreciation +0.0/10.0
$249,900
🖨 Deal sheet 📄 Offer letter ✓ Due diligence
Listing remarks MLS
Settle into single-level living with this charming brick ranch condo, where comfort and character go hand in hand. The living room makes a memorable first impression, featuring a soaring vaulted ceiling and a fireplace that begs for cozy evenings in. Two main-level bedrooms streamline your daily routine, while the partially finished basement contributes a third bedroom and a spacious family room ideal for hobbies, movie marathons, or overnight guests. With three full bathrooms, nobody has to wait their turn in the morning rush. Step outside, where a three-season porch and adjoining deck transform warm-weather afternoons into something special. Versatile, inviting, and brimming with personality, this condo offers the kind of relaxed lifestyle that's surprisingly hard to find.
Key facts
- Three season porch
- Brick ranch condo
- Fireplace
Tags
Property features AI
Finance
- HOA & community: Homeowners association with $265 monthly fee
Exterior
- Parking: Attached 2-car garage
- Utilities: Public water; Public sewer
- Home design: Condominium (residential)
- Construction: Brick construction; 700 sq ft finished below grade
- Exterior features: Shingle roof
Interior
- Kitchen: Dishwasher; Microwave; Refrigerator
- Bathrooms: Three full bathrooms; Two bathrooms on the main level
- Heating & cooling: Central air conditioning
- Interior features: Gas fireplace (1) with gas starter; Full basement
- Laundry & utility: Gas water heater
Neighborhood map
What this means for you Summary
Snapshot
- This is a 3-bed/3.0-bath condo listed at $250k.
Deal economics
- At list price, monthly cash flow is $451 ($5k/yr) — positive.
- The deal already cash-flows at list — no discount required.
- Meets the 1% rule at list price ($3k rent vs $250k).
- Cap rate 8.5% vs local median 6.1% in Rockford — top-decile yield for the area; either an underpriced asset or a hidden risk that comps aren't pricing in. Stress-test before assuming the spread holds.
Location & tenants
- Location reads 62/100 on livability (#876 in IL) — a middle-class / working-renter tenant base. Strengths: cost of living A+, housing A+, health & safety A+; Watch: schools F, crime F, amenities F.
- Rockford SD 205 (urban): math 12% / reading 16% proficiency, ranked #533 of 620 in IL (top 86%) — low school quality limits family demand, transient renter base, plan for 1-2y turnover; 73% free/reduced lunch — lower-income household profile, screen leases tightly.
- Market conditions: 74 active listings in the ZIP; 3 comparable units currently listed for rent nearby; rentals leasing fast (median 13d on market — plan ~1-2 weeks tenant-placement turnaround); 285 units permitted in Winnebago County in 2024 (0 in 5+ unit buildings).
Forward outlook
- Local home prices are declining (-3.0%/yr); year-one equity from $2k of loan paydown is wiped out by about $7k of value loss. Plan a longer hold.
- Winnebago County population projected at -20% by 2050 — secular population decline; favor cash flow + early exit over multi-decade hold.
Negotiation context
- Only 1 days on market — expect competitive offers; lowballing is unlikely to land.
- 2 sale attempts with the ask held roughly flat each time — persistent listings suggest the price (not the market) is what's stuck; bring a comps-based counter.
- Current owner paid $120k; list at $250k implies a 108% gain — meaningful room to come down on a strong offer.
Questions for the listing agent
- What does the HOA fee cover, when was the last increase, and are there any pending special assessments or reserve-fund shortfalls?
- Any open or pending special assessments — roof, HVAC, plumbing, elevator, façade? What's the per-unit balance and payoff schedule, and is the seller paying it off at close or rolling it to the buyer?
- Is there a deadline driving the sale (1031 exchange, divorce, estate, relocation)? That informs how much negotiation room exists.
- Schools are F-rated, which usually means shorter tenancies and higher turnover. Who's the typical renter profile here, and what's been the actual vacancy rate?
- Crime grade is F in this area — have there been break-ins, vandalism, or insurance claims at this property in the last 3 years? What carrier currently insures it and at what premium?
- What's the average days-on-market for RENTAL listings here right now (not sales)? A rising rental-DOM trend means longer vacancies and softer asking-rent achievability than the comps imply.
- What's the recent tenant-quality profile in this submarket — average credit score on applications, eviction rate, late-payment / NSF rate, and stable-employment percentage? A property-management company in the area should have these aggregated.
- How much new apartment / multifamily construction is in the pipeline within 1–3 miles? Heavy new supply (>2% of stock underway) typically softens rents 12–24 months out; light construction supports rent growth.
Investment metrics
- 1% rule
- 1.19% ✓
- Cap rate
- 8.46%
- Cash-on-cash
- 7.73%
- DSCR
- 1.34
- GRM
- 7.0
CMA / ARV
No comps found within radius.
Projected returns pro-forma
-3.0% appreciation · 3.0% rent growth · sell at horizon
- IRR
- -4.4%
- Equity multiple
- 0.83×
- Total profit
- $-11,616
- Equity at exit
- $37,261
- IRR
- 5.3%
- Equity multiple
- 1.39×
- Total profit
- $27,500
- Equity at exit
- $21,607
Cash invested: $69,972 (down + closing). Projections, not guarantees.
Landlord ↔ Tenant lean methodology
- Overall (STATE)
- 43 Moderately Tenant-Leaning
- State Illinois
- 43 Moderately Tenant-Leaning · D+7
- County
- — inherits STATE
- City
- — inherits STATE
ZIP-level market 61114
- Home prices YoY
- -27.1%
- Active inventory
- 74
- Price-to-rent
- 7.0×
Monthly cashflow live
- Estimated rent
- $2,983 medium interval (Pro) →
- Mortgage (P&I)
- −$1,311
- Tax from tax record
- −$226 /mo · $2,710/yr
- Insurance
- −$104
- HOA
- −$265
- Vacancy / Maint / Mgmt
- −$626
- Net cashflow
- $451
Break-even live
UW: 25.0% down · 7.5% · 30yr · 1.5% tax · 5.0% vac · 8.0% maint · 8.0% mgmt
Financing live
Cash to close
- Down payment
- $62,475
- Closing costs
- $7,497
- Reserves months
- —
- Total cash needed
- —
Loan-product check · same deal, 3 products live
Conventional
25% down · 7.5% · 30yr
- Down + closing
- —
- Monthly P&I
- —
- Monthly cashflow
- —
- DSCR
- —
- Eligible?
- —
Personal DTI + credit; lowest rate.
DSCR
20% down · 8.5% · 30yr
- Down + closing
- —
- Monthly P&I
- —
- Monthly cashflow
- —
- DSCR
- —
- Eligible?
- —
No personal income docs; deal must DSCR.
Hard money
10% down · 12.0% · 12mo
- Down + closing
- —
- Monthly P&I
- —
- Monthly cashflow
- —
- DSCR
- —
- Eligible?
- —
Short-term bridge; refi at stabilization.
Rent comps 3 comps
| Address | Beds | Baths | Sqft | Rent | $/sqft | DOM | Units | Dist |
|---|---|---|---|---|---|---|---|---|
| 4016 Eaton Dr Unit 1232695P Rockford, IL | 3.0 | 3.0 | 1722 | $4,169 | $2.42 | 13d | 1 | 0.81mi |
| 3121 Carefree Dr Rockford, IL | 4.0 | 2.5 | 3000 | $2,800 | $0.93 | 43d | 1 | 0.85mi |
| 5548 Spring Brook Rd Unit 5548 Rockford, IL | 2.0 | 2.0 | 1730 | $1,650 | $0.95 | 13d | 1 | 1.04mi |
HOA detail condo
- Monthly dues
- $265 · $3,180/yr
- Assessments
- None detected in remarks — confirm with the listing agent.
Listing history 2 events
-
2026-06-18remarks 699-char remark
Show marketing remark (785 chars)
Settle into single-level living with this charming brick ranch condo, where comfort and character go hand in hand. The living room makes a memorable first impression, featuring a soaring vaulted ceiling and a fireplace that begs for cozy evenings in. Two main-level bedrooms streamline your daily routine, while the partially finished basement contributes a third bedroom and a spacious family room ideal for hobbies, movie marathons, or overnight guests. With three full bathrooms, nobody has to wait their turn in the morning rush. Step outside, where a three-season porch and adjoining deck transform warm-weather afternoons into something special. Versatile, inviting, and brimming with personality, this condo offers the kind of relaxed lifestyle that's surprisingly hard to find.
-
2026-06-18$249,900 Active 1 DOM
Show marketing remark (785 chars)
Settle into single-level living with this charming brick ranch condo, where comfort and character go hand in hand. The living room makes a memorable first impression, featuring a soaring vaulted ceiling and a fireplace that begs for cozy evenings in. Two main-level bedrooms streamline your daily routine, while the partially finished basement contributes a third bedroom and a spacious family room ideal for hobbies, movie marathons, or overnight guests. With three full bathrooms, nobody has to wait their turn in the morning rush. Step outside, where a three-season porch and adjoining deck transform warm-weather afternoons into something special. Versatile, inviting, and brimming with personality, this condo offers the kind of relaxed lifestyle that's surprisingly hard to find.
ⓘ Source: listings_history table (triggers on properties + properties_extension) + one-shot
backfill from property_details.listing_events for pre-trigger history.
Tax reassessment forecast IL · Partial reset (capped growth)
- Current annual tax
- $2,710 · $226/mo
- Projected year-2 tax
- $4,191 · $349/mo
- Expected delta
- +$1,481/yr (+$123/mo · 54.7%)
ⓘ Screening estimate from a state-policy table — verify with the county assessor before closing.
Nearby sold comps map
Loading sold comps map…
Walkable amenities ~0.75 mi
Loading nearby amenities…
Taxation est. · year 1
- Rental income
- $35,794
- − Mortgage interest
- −$13,998
- − Property taxes
- −$2,710
- − Insurance
- −$1,250
- − Repairs & maintenance
- −$2,864
- − Management
- −$2,864
- − HOA
- −$3,180
- − Depreciation
- −$7,270
- Taxable income
- $1,660
- Est. tax owed @ 24.0%
- −$398
- After-tax cash flow
- $5,014/yr
For passive investors: Depreciation is non-cash, so a rental often shows a tax loss while cash-flowing — sheltering income. Rental losses are passive: they offset passive income freely, and up to $25,000/yr can offset ordinary (W-2) income if you actively participate and your MAGI is under $100k (phasing out to $0 by $150k); unused losses carry forward. On sale, claimed depreciation is recaptured at up to 25%, and gains may owe capital-gains tax (a 1031 exchange can defer both). Figures are a year-1 estimate at your 24.0% rate — not tax advice; consult a CPA.
Schools (NCES district)
- District
- Rockford SD 205
- NCES district ID
- 1734510
- Math proficiency
- 12% ▼ -2.00%
- Reading proficiency
- 16% ▼ -3.00%
- Median HH income
- $42,533
- Composite
- 12.21/100
- National rank
- #9649
- State rank
- #533 of 620 in IL
Livability — Rockford
- Score
- 62/100
- State rank
- #876
- US rank
- #17035
Category grades
Schools grade is shown separately in the Schools card above.
Census & demographics
- Census place
- Rockford, IL
- City population
- 147,297
- Population (ZIP)
- 15,026
Population outlook (Winnebago County) Hauer SSP2
- Today (2025)
- 271,080 people
- By 2030
- 260,684 · -3.8%
- By 2040
- 238,405 · -12.1%
- By 2050
- 216,129 · -20.3%
- By 2075
- 172,882 · -36.2%
- By 2100
- 135,336 · -50.1%
Race, ethnicity, and origin ACS 2023
- Neighborhood character
- Predominantly White (72%)
- Race & ethnicity
- White 72% Hispanic / Latino 11% Black 10% Two or more races 6% Asian 4%
- Hispanic origin (detail)
- Mexican 10%
- Common ancestry
- Romanian 5% Portuguese 3% Lithuanian 2%
- Foreign-born
- 10% · Canada, Vietnam
- Languages at home
- 85% English-only · Spanish 7% Russian/Polish/Slavic 2% Other Indo-European 2%
Political lean MEDSL · Winnebago
- 2024 margin
- Toss-up / Even · D 49.5% · R 49.0% · Other 1.5%
- 2008→2024 swing
- -12.2pp toward R · 2008: 12.8pp · 2024: 0.6pp
- All cycles
- 2024: D+0.6 2020: D+2.5 2016: R+1.2 2012: D+5.7 2008: D+12.8
Not yet ingested
- Civics
- —
Market trends
- HPI YoY
- ▼ -84.00%
- Current HPI
- 225.8485
- Rent YoY
- —
- Metro
- —
- State GDP YoY
- ▲ 1.59%
- F500 in state
- 60
Industry mix (Fortune 500 HQ in IL)
| Industry | F500 HQs | Revenue |
|---|---|---|
| Insurance | 4 | $201B |
|
||
| Consumer Goods | 4 | $87B |
|
||
| Industrial Machinery | 3 | $64B |
|
||
| Healthcare | 2 | $55B |
|
||
| Retail / Pharmacy | 1 | $148B |
|
||
| Agriculture / Food | 1 | $86B |
|
||
Price history
+165.9% since first listed8 events — show timeline
- 2026-06-18 Listed $249,900 MRED as Distributed by MLS Grid
- 2026-06-18 Listed $249,900 NWIAR
- 2017-06-06 Sold (Public Records) $120,000 Public Records
- 2012-07-25 Sold (Public Records) $114,900 Public Records
- 1997-06-05 Sold (Public Records) $123,000 Public Records
- 1996-09-06 Sold (Public Records) $121,000 Public Records
- 1990-01-25 Sold (Public Records) $94,000 Public Records
- 1990-01-25 Sold (Public Records) $94,000 Public Records
Property tax history
-2.4%/yrLatest (2025): $2,710 · -6.8% YoY. Source: county tax records.
Cash-flow waterfall
monthlySold comps — $/sqft
last 12 mo · ≤1 miLoading sold comps…