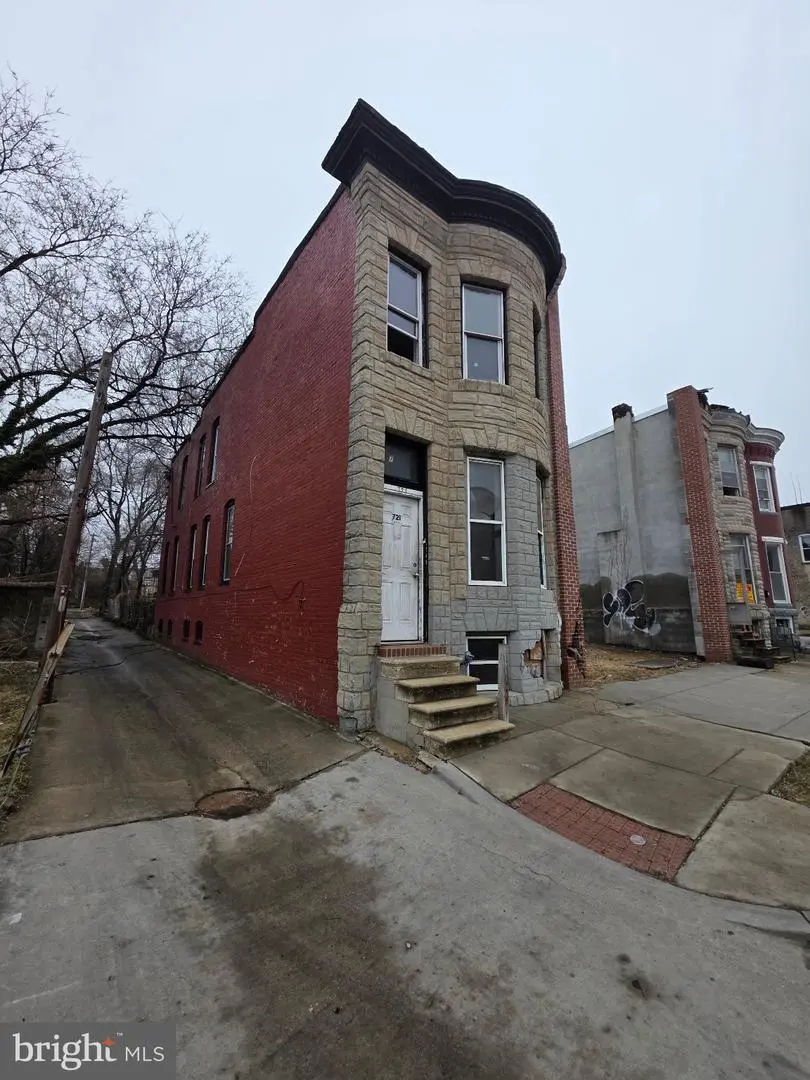
721 N Monroe St · Baltimore, MD
Flood risk 1/10 · Minimal
- FEMA flood zone
- X (unshaded)
- Chance of flooding over 30 yrs
- 0.0%
- Est. flood insurance / yr
- $473 – $860
Fire risk 1/10 · Minimal
- Est. fire insurance / yr
- $755 – $1,403
Heat risk 7/10 · Major
- Hot days now (above 103°F)
- 7 days/yr
- Hot days in 30 yrs
- 15 days/yr
Wind risk 6/10 · Moderate
- Chance of severe wind over 30 yrs
- 27.0%
Air-quality risk 4/10 · Minor
- Unhealthy air days now
- 6 days/yr
- Unhealthy air days in 30 yrs
- 7 days/yr
Risk factors via First Street. Map © Google.
Why this score? — see what drove the D grade
The composite is a weighted blend of 9 inputs, each scored 0–100. Each bar is that input's sub-score; the figure is the points it added to the 100-point composite (weight × sub-score).
- Cash flow +15.0/30.0
- ARV discount +7.5/15.0
- 1% rule +5.0/10.0
- DSCR +5.0/10.0
- Rent growth +4.2/5.0
- Livability +3.8/5.0
- Condition / age +2.5/5.0
- Schools +1.0/10.0
- Appreciation +0.0/10.0
$30,000
🖨 Deal sheet 📄 Offer letter ✓ Due diligence
Listing remarks
For all savvy investors, do the work, reap the reward. Discover this hidden gem in the heart of Harlem Park! This 3-bedroom, 1-bathroom Colonial townhouse, built in 1920, offers a unique investment opportunity with significant potential for appreciation. The stand alone design provides added privacy and a cozy atmosphere, perfect for creating a welcoming retreat. With an unfinished basement, you have the chance to customize and expand your living space, increasing the property's value. The low-maintenance brick exterior ensures durability, while the compact lot size of just 0.02 acres makes upkeep a breeze. Located less than 10 miles from the airport and within a mile of public transportati
Key facts
- Unfinished basement
- Compact lot size
- Stand alone design
Tags
Neighborhood map
What this means for you Summary
Snapshot
- This is a 3-bed/1.0-bath townhouse listed at $30k.
Deal economics
- At list price, monthly cash flow is $1k ($14k/yr) — positive.
- The deal already cash-flows at list — no discount required.
- Meets the 1% rule at list price ($2k rent vs $30k).
- Cap rate 52.3% vs local median 6.0% in Baltimore — top-decile yield for the area; either an underpriced asset or a hidden risk that comps aren't pricing in. Stress-test before assuming the spread holds.
Location & tenants
- Location reads 76/100 on livability (#90 in MD, #3,396 nationally) — a middle-class / working-renter tenant base. Strengths: amenities A+, commute A+, housing A+; Watch: schools D, crime F.
- Baltimore City Public Schools (urban): math 7% / reading 16% proficiency, ranked #24 of 24 in MD (top 100%) — low school quality limits family demand, transient renter base, plan for 1-2y turnover; 79% free/reduced lunch — lower-income household profile, screen leases tightly.
- Market conditions: Rents rising fast (+6.6%/yr); 331 active listings in the ZIP; 40 comparable units currently listed for rent nearby; rentals at typical pace (median 24d on market — plan ~3-4 weeks tenant-placement turnaround); lower-income renter base — watch delinquency; 1,273 units permitted in Baltimore city in 2024 (1,104 in 5+ unit buildings).
- At $1,722/mo this rent would consume 54% of the median local household income ($38k/yr) (locally 2921% of renters already pay >50% of income on rent) — very limited rent-growth headroom before tenants either downsize or default.
Forward outlook
- Local home prices are declining (-3.0%/yr); year-one equity from $207 of loan paydown is wiped out by about $900 of value loss. Plan a longer hold.
- Baltimore County population projected to shrink 4% by 2050 — rents likely to lag national; underwrite the cash flow, not the appreciation.
- At projected returns (-3.0% appreciation + 6.6% rent growth), your $8k cash investment doubles in ~1 year — after that, you're playing with house money.
Negotiation context
- Only 14 days on market — expect competitive offers; lowballing is unlikely to land.
Risks & watch-outs
- Watch-outs: built in 1920 — expect roof / HVAC / electrical / plumbing capex.
- Climate carrying-cost: major wind risk, 27% chance of damaging wind over 30y; extreme-heat days projected 7→15/yr by 2055 (HVAC capex compounding) — expect insurance premiums to compound above CPI over the hold.
Questions for the listing agent
- Built in 1920 — when were the roof, HVAC, electrical panel, plumbing, and water heater last replaced?
- Is there a deadline driving the sale (1031 exchange, divorce, estate, relocation)? That informs how much negotiation room exists.
- Schools are D-rated, which usually means shorter tenancies and higher turnover. Who's the typical renter profile here, and what's been the actual vacancy rate?
- Crime grade is F in this area — have there been break-ins, vandalism, or insurance claims at this property in the last 3 years? What carrier currently insures it and at what premium?
- The area grade is low — what's the realistic commute time and amenity access for the typical tenant pool here? Any planned neighborhood developments (good or bad) we should know about?
- What's the average days-on-market for RENTAL listings here right now (not sales)? A rising rental-DOM trend means longer vacancies and softer asking-rent achievability than the comps imply.
- What's the recent tenant-quality profile in this submarket — average credit score on applications, eviction rate, late-payment / NSF rate, and stable-employment percentage? A property-management company in the area should have these aggregated.
- How much new for-sale + rental construction is in the pipeline within 1–3 miles? Heavy new supply typically softens prices + rents 12–24 months out; constrained supply supports both.
Investment metrics
- 1% rule
- 5.74% ✓
- Cap rate
- 52.32%
- Cash-on-cash
- 164.39%
- DSCR
- 8.31
- GRM
- 1.5
CMA / ARV
- ARV (on-the-fly)
- $69,440
- Comps found
- 12
Show comp detail 12 sales within ~0.75 mi
| Address | Dist | Beds/Ba | Sqft | Sold | Price | $/sf | Match |
|---|---|---|---|---|---|---|---|
| 1927 Penrose Ave | 0.43mi | 3/1.0 | 1,170 (+4%) | 4mo | $40,000 | $34 | 69 |
| 1552 N Fulton Ave | 0.63mi | 3/1.0 | 1,113 (-1%) | 4mo | $125,000 | $112 | 66 |
| 1541 N Pulaski St | 0.66mi | 3/1.0 | 1,100 (-2%) | 3mo | $115,000 | $105 | 64 |
| 43 Wheeler Ave N | 0.68mi | 3/1.0 | 1,144 (+2%) | 3mo | $34,000 | $30 | 62 |
| 633 N Brice St | 0.16mi | 4/2.5 (+1) | 1,250 (+12%) | 2mo | $78,000 | $62 | 61 |
| 1910 W Fayette St | 0.52mi | 3/1.0 | 1,020 (-9%) | 4mo | $39,000 | $38 | 58 |
| 1906 W Saratoga St | 0.35mi | 3/1.5 | 1,273 (+14%) | 2mo | $155,000 | $122 | 57 |
| 2141 Vine St | 0.56mi | 2/1.0 (-1) | 1,200 (+7%) | 3mo | $20,000 | $17 | 55 |
| 2435 Lauretta Ave | 0.51mi | 3/1.0 | 1,260 (+12%) | 1mo | $45,000 | $36 | 55 |
| 1537 N Smallwood St | 0.67mi | 3/1.5 | 1,200 (+7%) | 3mo | $56,000 | $47 | 52 |
| 1906 W Fairmount Ave | 0.57mi | 2/3.5 (-1) | 1,200 (+7%) | 3mo | $134,900 | $112 | 44 |
| 2649 W Lafayette Ave | 0.75mi | 3/2.0 | 1,260 (+12%) | 3mo | $210,000 | $167 | 38 |
Match score weights: distance 35% · size 25% · config 20% · recency 20%. Top-matched comps best support the ARV.
Projected returns pro-forma
-3.0% appreciation · 6.63% rent growth · sell at horizon
- IRR
- —
- Equity multiple
- 9.93×
- Total profit
- $74,973
- Equity at exit
- $4,473
- IRR
- —
- Equity multiple
- 23.45×
- Total profit
- $188,592
- Equity at exit
- $2,594
Cash invested: $8,400 (down + closing). Projections, not guarantees.
Landlord ↔ Tenant lean methodology
- Overall (CITY)
- 12 Strongly Tenant-Friendly
- State Maryland
- 27 Tenant-Leaning · D+14
- County
- — inherits STATE
- City Baltimore
- 12 Strongly Tenant-Friendly · D+58
ZIP-level market 21217
- Rents YoY
- 6.6%
- Active inventory
- 331
- Price-to-rent
- 1.5×
Monthly cashflow live
- Estimated rent
- $1,722 high interval (Pro) →
- Mortgage (P&I)
- −$157
- Tax from tax record
- −$40 /mo · $478/yr
- Insurance
- −$12
- HOA
- −$0
- Vacancy / Maint / Mgmt
- −$362
- Net cashflow
- $1,151
Break-even live
UW: 25.0% down · 7.5% · 30yr · 1.5% tax · 5.0% vac · 8.0% maint · 8.0% mgmt
Financing live
Cash to close
- Down payment
- $7,500
- Closing costs
- $900
- Reserves months
- —
- Total cash needed
- —
Loan-product check · same deal, 3 products live
Conventional
25% down · 7.5% · 30yr
- Down + closing
- —
- Monthly P&I
- —
- Monthly cashflow
- —
- DSCR
- —
- Eligible?
- —
Personal DTI + credit; lowest rate.
DSCR
20% down · 8.5% · 30yr
- Down + closing
- —
- Monthly P&I
- —
- Monthly cashflow
- —
- DSCR
- —
- Eligible?
- —
No personal income docs; deal must DSCR.
Hard money
10% down · 12.0% · 12mo
- Down + closing
- —
- Monthly P&I
- —
- Monthly cashflow
- —
- DSCR
- —
- Eligible?
- —
Short-term bridge; refi at stabilization.
Rent comps 40 comps
| Address | Beds | Baths | Sqft | Rent | $/sqft | DOM | Units | Dist |
|---|---|---|---|---|---|---|---|---|
| 813 N Fulton Ave Unit 1 Baltimore, MD | 2.0 | 1.0 | 1200 | $1,350 | $1.12 | 43d | 1 | 0.11mi |
| 1914 Mosher St Unit 1914 Baltimore, MD | 4.0 | 2.5 | 1200 | $1,700 | $1.42 | 43d | 1 | 0.21mi |
| 1625 Edmondson Ave Unit 1 Baltimore, MD | 4.0 | 3.0 | 1500 | $2,175 | $1.45 | 4d | 1 | 0.22mi |
| 1625 Edmondson Ave Unit 2 Baltimore, MD | 4.0 | 3.0 | 1500 | $1,895 | $1.26 | 12d | 1 | 0.22mi |
| 834 N Stricker St Baltimore, MD | 4.0 | 1.0 | 1200 | $1,500 | $1.25 | 20d | 1 | 0.31mi |
| 1846 W Saratoga St Unit 1 Baltimore, MD | 2.0 | 1.0 | 1250 | $1,300 | $1.04 | 43d | 1 | 0.34mi |
| 2012 W Saratoga St Baltimore, MD | 3.0 | 1.0 | 1300 | $1,700 | $1.31 | 23d | 1 | 0.36mi |
| 2303 Calverton Heights Ave Baltimore, MD | 4.0 | 2.0 | 1314 | $2,250 | $1.71 | 23d | 1 | 0.38mi |
| 918 N Bentalou St Baltimore, MD | 3.0 | 1.5 | 1485 | $1,750 | $1.18 | 43d | 1 | 0.39mi |
| 1315 Harlem Ave Unit C Baltimore, MD | 2.0 | 1.0 | 900 | $1,425 | $1.58 | 43d | 1 | 0.40mi |
| 1315 Harlem Ave Unit B Baltimore, MD | 2.0 | 1.0 | 900 | $1,425 | $1.58 | 23d | 1 | 0.40mi |
| 1339 W Lafayette Ave #1 Baltimore, MD | 2.0 | 2.0 | 700 | $1,600 | $2.29 | 12d | 1 | 0.40mi |
| 2301 Riggs Ave Baltimore, MD | 3.0 | 2.0 | 1072 | $1,600 | $1.49 | 23d | 1 | 0.45mi |
| 1519 Penrose Ave Baltimore, MD | 3.0 | 2.0 | 1200 | $1,875 | $1.56 | 43d | 1 | 0.49mi |
| 1839 W Fayette St Baltimore, MD | 3.0 | 1.5 | 1426 | $1,675 | $1.17 | 23d | 1 | 0.53mi |
| 1433 N Fulton Ave Baltimore, MD | 2.0 | 1.0 | 1200 | $1,500 | $1.25 | 43d | 1 | 0.55mi |
| 1501 N Payson St Baltimore, MD | 3.0 | 1.0 | 1400 | $1,550 | $1.11 | 43d | 1 | 0.59mi |
| 1912 W Baltimore St Unit 2 Baltimore, MD | 2.0 | 1.5 | 1200 | $2,100 | $1.75 | 23d | 1 | 0.60mi |
| 1918 W Baltimore St Baltimore, MD | 2.0–3.0 | 1.0–2.0 | 857 | $1,434 | $1.67 | 43d | 1 | 0.60mi |
| 910 N Arlington Ave Unit 2 Baltimore, MD | 4.0 | 2.0 | 1220 | $1,850 | $1.52 | 23d | 1 | 0.62mi |
| 1049 Brantley Ave Unit 2 Baltimore, MD | 3.0 | 1.0 | 1200 | $1,350 | $1.12 | 23d | 1 | 0.62mi |
| 1601 Frederick Ave Unit 3 Baltimore, MD | 2.0 | 1.0 | 1050 | $1,050 | $1.00 | 4d | 1 | 0.66mi |
| 62 N Gorman Ave Baltimore, MD | 3.0 | 2.0 | 1100 | $2,500 | $2.27 | 17d | 1 | 0.66mi |
| 1635 Frederick Ave Baltimore, MD | 3.0 | 2.0 | 1224 | $1,850 | $1.51 | 43d | 1 | 0.66mi |
| 1346 N Carey St Baltimore, MD | 2.0 | 1.5 | 1100 | $1,500 | $1.36 | 43d | 1 | 0.67mi |
| 2232 W Baltimore St Baltimore, MD | 3.0 | 1.0 | 1250 | $1,875 | $1.50 | 23d | 1 | 0.68mi |
| 2225 W Baltimore St Baltimore, MD | 3.0 | 2.5 | 1200 | $1,600 | $1.33 | 23d | 1 | 0.69mi |
| 1534 N Stricker St Baltimore, MD | 2.0 | 1.5 | 900 | $1,475 | $1.64 | 14d | 1 | 0.70mi |
| 2609 Lauretta Ave Baltimore, MD | 3.0 | 1.0 | 1286 | $1,675 | $1.30 | 23d | 1 | 0.72mi |
| 1614 N Calhoun St Baltimore, MD | 2.0 | 1.0 | 950 | $1,300 | $1.37 | 43d | 1 | 0.74mi |
| 2636 Lauretta Ave Baltimore, MD | 3.0 | 2.5 | 1232 | $1,900 | $1.54 | 43d | 1 | 0.75mi |
| 1562 N Woodyear St Baltimore, MD | 2.0 | 1.5 | 788 | $1,325 | $1.68 | 23d | 1 | 0.75mi |
| 10 S Carey St Baltimore, MD | 2.0 | 1.0 | 1140 | $1,550 | $1.36 | 23d | 1 | 0.76mi |
| 1722 N Monroe St Baltimore, MD | 3.0 | 1.5 | 1000 | $1,350 | $1.35 | 23d | 1 | 0.79mi |
| 1729 N Fulton Ave Baltimore, MD | 3.0 | 2.0 | 1081 | $1,795 | $1.66 | 43d | 1 | 0.80mi |
| 1315 Hollins St Unit 2 Baltimore, MD | 3.0 | 2.0 | 1096 | $1,950 | $1.78 | 12d | 1 | 0.80mi |
| 1315 Hollins St Unit 2 Baltimore, MD | 3.0 | 2.0 | 1096 | $1,860 | $1.70 | 4d | 1 | 0.80mi |
| 1617 Moreland Ave Baltimore, MD | 2.0 | 1.0 | 900 | $1,450 | $1.61 | 23d | 1 | 0.82mi |
| 1324 W Lombard St Unit 2 Baltimore, MD | 2.0 | 1.5 | 1100 | $1,450 | $1.32 | 43d | 1 | 0.83mi |
| 1324 W Lombard St Unit 1 Baltimore, MD | 2.0 | 2.0 | 1100 | $1,500 | $1.36 | 23d | 1 | 0.83mi |
Listing history 3 events
-
2026-04-06status Pending
-
2026-03-23$30,000 Active
-
2014-10-15soldstatus $60,000
ⓘ Source: listings_history table (triggers on properties + properties_extension) + one-shot
backfill from property_details.listing_events for pre-trigger history.
Tax reassessment forecast MD · Partial reset (capped growth)
- Current annual tax
- $478 · $40/mo
- Projected year-2 tax
- $478 · $40/mo
- Expected delta
- $0/yr ($0/mo · 0.0%)
ⓘ Screening estimate from a state-policy table — verify with the county assessor before closing.
Climate risk First Street
- Flood 1/10 Low FEMA zone X (unshaded) · 0% chance over 30 yrs
- Wildfire 1/10 Low
- Heat 7/10 Severe 7 d/yr ≥103°F today · 15 d/yr by 30 yrs out
- Wind 6/10 Major 27% chance of damaging wind over 30 yrs
- Air quality 4/10 Moderate 6 unhealthy d/yr today · 7 by 30 yrs out
Nearby sold comps map
Loading sold comps map…
Walkable amenities ~0.75 mi
Loading nearby amenities…
Taxation est. · year 1
- Rental income
- $20,663
- − Mortgage interest
- −$1,680
- − Property taxes
- −$478
- − Insurance
- −$150
- − Repairs & maintenance
- −$1,653
- − Management
- −$1,653
- − Depreciation
- −$873
- Taxable income
- $14,176
- Est. tax owed @ 24.0%
- −$3,402
- After-tax cash flow
- $10,406/yr
For passive investors: Depreciation is non-cash, so a rental often shows a tax loss while cash-flowing — sheltering income. Rental losses are passive: they offset passive income freely, and up to $25,000/yr can offset ordinary (W-2) income if you actively participate and your MAGI is under $100k (phasing out to $0 by $150k); unused losses carry forward. On sale, claimed depreciation is recaptured at up to 25%, and gains may owe capital-gains tax (a 1031 exchange can defer both). Figures are a year-1 estimate at your 24.0% rate — not tax advice; consult a CPA.
Schools (NCES district)
- District
- Baltimore City Public Schools
- NCES district ID
- 2400090
- Math proficiency
- 7% ▼ -9.00%
- Reading proficiency
- 16% ▼ -5.00%
- Median HH income
- $42,108
- Composite
- 10.08/100
- National rank
- #9805
- State rank
- #24 of 24 in MD
Livability — Baltimore
- Score
- 76/100
- State rank
- #90
- US rank
- #3396
Category grades
Schools grade is shown separately in the Schools card above.
Census & demographics
- Census place
- Baltimore, MD
- County
- Baltimore City · 558,601 people
- City population
- 588,727
- Metro
- Baltimore-Columbia-Towson, MD
- Population (ZIP)
- 30,792
- Household income
- $38,409
- Rent vs Own
- Severe rent burden
- 2921.0
Population outlook (Baltimore County) Hauer SSP2
- Today (2025)
- 624,249 people
- By 2030
- 621,541 · -0.4%
- By 2040
- 609,756 · -2.3%
- By 2050
- 597,249 · -4.3%
- By 2075
- 552,236 · -11.5%
- By 2100
- 513,934 · -17.7%
Race, ethnicity, and origin ACS 2023
- Neighborhood character
- Predominantly Black (81%)
- Race & ethnicity
- Black 81% White 12% Two or more races 4% Hispanic / Latino 2% Asian 2%
- Common ancestry
- Romanian 1% Hispanic 1% Italian 1%
- Foreign-born
- 5% · Canada, China, South Korea
- Languages at home
- 94% English-only · Spanish 2% French/Haitian/Cajun 1% Chinese 1%
Political lean MEDSL · Baltimore
- 2024 margin
- Solid D (+73.0) · D 85.2% · R 12.2% · Other 2.6%
- 2008→2024 swing
- -2.5pp toward R · 2008: 75.5pp · 2024: 73.0pp
- All cycles
- 2024: D+73.0 2020: D+76.6 2016: D+74.6 2012: D+76.4 2008: D+75.5
Not yet ingested
- Civics
- —
Market trends
- HPI YoY
- ▼ -187.20%
- Current HPI
- 104.2102
- Rent YoY
- ▲ 6.63%
- Metro
- Baltimore-Columbia-Towson, MD
- State GDP YoY
- ▲ 2.97%
- F500 in state
- 12
Industry mix (Fortune 500 HQ in MD)
| Industry | F500 HQs | Revenue |
|---|---|---|
| Aerospace / Defense | 1 | $71B |
|
||
| Utilities | 1 | $25B |
|
||
| Hotels | 1 | $24B |
|
||
| Consumer Goods | 1 | $7B |
|
||
| Real Estate | 1 | $6B |
|
||
| Chemicals | 1 | $2B |
|
||
Price history
-50.0% since first listed3 events — show timeline
- 2026-04-06 Pending — BRIGHT MLS
- 2026-03-23 Listed $30,000 BRIGHT MLS
- 2014-10-15 Sold (Public Records) $60,000 Public Records
Property tax history
+3.1%/yrLatest (2025): $478 · +3.4% YoY. Source: county tax records.
Cash-flow waterfall
monthlySold comps — $/sqft
last 12 mo · ≤1 miLoading sold comps…