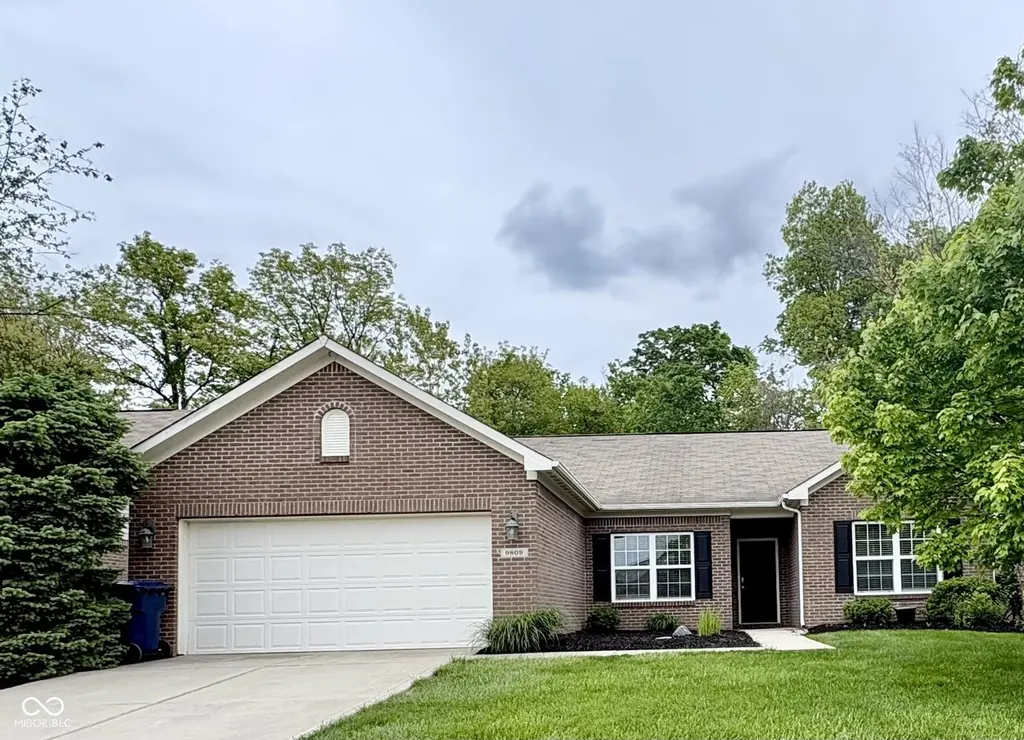
9809 Brook Wood Dr · Fishers, IN
Flood risk 1/10 · Minimal
- FEMA flood zone
- X (unshaded)
- Chance of flooding over 30 yrs
- 0.0%
- Est. flood insurance / yr
- $507 – $1,088
Fire risk 1/10 · Minimal
- Est. fire insurance / yr
- $717 – $1,331
Heat risk 3/10 · Minor
- Hot days now (above 100°F)
- 7 days/yr
- Hot days in 30 yrs
- 18 days/yr
Wind risk 2/10 · Minimal
- Chance of severe wind over 30 yrs
- 0.0%
Air-quality risk 2/10 · Minimal
- Unhealthy air days now
- 1 days/yr
- Unhealthy air days in 30 yrs
- 2 days/yr
Risk factors via First Street. Map © Google.
Why this score? — see what drove the D+ grade
The composite is a weighted blend of 9 inputs, each scored 0–100. Each bar is that input's sub-score; the figure is the points it added to the 100-point composite (weight × sub-score).
- ARV discount +15.0/15.0
- Cash flow +9.1/30.0
- Schools +5.3/10.0
- Livability +4.2/5.0
- Rent growth +3.8/5.0
- 1% rule +2.8/10.0
- DSCR +2.5/10.0
- Condition / age +2.5/5.0
- Appreciation +0.0/10.0
$329,000
🖨 Deal sheet (PDF) 📄 Offer letter ✓ Due diligence
Listing remarks MLS
Don't miss this opportunity in pristine Timberstone Villas! This split floorplan ranch home features an open concept great room, kitchen with 42" cabinets, and office space. The primary suite features a large walk in closet, soaker tub, full shower stall, and double vanity. The backyard hosts a deck, fire pit, and has direct access to the walking trail. Additional photos to come, but don't miss your opportunity to tour today!
Key facts
- All brick ranch
- Double doors
- Angled gas fireplace
Tags
Property features AI
Finance
- Other: Lot size about 0.17 acre (under 1/4 acre)
- HOA & community: Has HOA; Quarterly association fee (listed); HOA covers entrance common, lawn care, grounds maintenance, nature area, snow removal, and walking trails; Association amenities include maintained grounds, snow removal, and trails; HOA disclosures: covenants & restrictions, rental restrictions, rules & regulations, transfer fee
Exterior
- Parking: Attached 2-car garage (approx. 420 sq ft)
- Security: Smoke detectors; Smart lock(s)
- Utilities: Public water; Municipal sewer connected; Natural gas available
- Home design: Single-family residence; One story; Low-maintenance lifestyle; Property listed in fixer condition
- Construction: Brick construction; Slab foundation
- Exterior features: Deck; Fire pit; Smart locks
Interior
- Kitchen: Electric oven; Microhood; Dishwasher; Refrigerator; Garbage disposal; Breakfast room adjacent to kitchen
- Bedrooms: Three main-level bedrooms; Primary bedroom with split layout and walk-in closet
- Bathrooms: Two full bathrooms; Primary bathroom with garden tub, separate shower stall, double sinks, and suite layout
- Heating & cooling: Forced-air heating (natural gas); Central air conditioning; Gas-log fireplace in the great room
- Interior features: Breakfast bar; High ceilings; Walk-in closets; Main-level laundry
- Laundry & utility: Washer and dryer included; Laundry located on main level
Neighborhood map
What this means for you Summary
Snapshot
- This is a 4-bed/2.0-bath single-family listed at $329k.
Deal economics
- At list price, monthly cash flow is $-250 ($-3k/yr) — negative.
- To cash-flow at today's rent, offer at most $285k (13.4% below list).
- To meet the 1% rule (rent ≥ 1% of price), the offer needs to be $256k (22.3% below list).
- Recommended offer: $256k (22.3% below list) — sets the bar for 1% rule.
- Cap rate 5.4% vs local median 3.6% in Fishers — top-decile yield for the area; either an underpriced asset or a hidden risk that comps aren't pricing in. Stress-test before assuming the spread holds.
Location & tenants
- Location reads 83/100 on livability (#11 in IN, #898 nationally) — a professional / high-income tenant draw. Strengths: crime A+, amenities A+, employment A+; Watch: commute F.
- Hamilton Southeastern Schools (suburban): math 57% / reading 59% proficiency, ranked #14 of 301 in IN (top 5%) — acceptable for families but not a draw, mixed tenant base, ~2y average lease; only 10% free/reduced lunch — higher-income household profile.
- Zoned schools: Geist Elementary School (math 78% / reading 69%, grade A, #23 of 994 statewide, top 3%, 707 students, 13% FRL); Hamilton Se Int And Jr High Sch (math 50% / reading 60%, grade B-, #26 of 330 statewide, top 8%, 1,269 students, 13% FRL); Hamilton Southeastern Hs (math 66% / reading 85%, grade A-, #7 of 369 statewide, top 2%, 3,450 students, 15% FRL) — zoned schools at 14% FRL track the district average.
- Market conditions: Rents rising fast (+5.2%/yr); 425 active listings in the ZIP; high-income renter base; 4,661 units permitted in Hamilton County in 2024 (1,528 in 5+ unit buildings).
Forward outlook
- Local home prices are declining (-3.0%/yr); year-one equity from $2k of loan paydown is wiped out by about $10k of value loss. Plan a longer hold.
- Hamilton County population projected at +44% by 2050 — long-run rental-demand tailwind backs the buy-and-hold thesis.
Negotiation context
- It's been on market 40 days — a 3% lower offer ($319k) is reasonable based on typical stale-listing flexibility.
- 2 sale attempts since 3y ago; this cycle's ask has dropped $21k (6%) from the opening price — seller is motivated, your offer sets the floor, not the list.
Questions for the listing agent
- What do current leases actually rent for vs. the listed asking? Can we see a recent rent roll and the last 12 months of T-12 income?
- It's been on market 40 days. Have you received any prior offers? Is the seller open to a 22% concession, seller financing, or rate buy-down credit?
- What does the HOA fee cover, when was the last increase, and are there any pending special assessments or reserve-fund shortfalls?
- Is there a deadline driving the sale (1031 exchange, divorce, estate, relocation)? That informs how much negotiation room exists.
- Schools are A-rated — typically a magnet for longer-tenancy family renters. What's the average tenant stay here, and is there a school-zone premium baked into asking?
- The area grade is low — what's the realistic commute time and amenity access for the typical tenant pool here? Any planned neighborhood developments (good or bad) we should know about?
- What's the average days-on-market for RENTAL listings here right now (not sales)? A rising rental-DOM trend means longer vacancies and softer asking-rent achievability than the comps imply.
- What's the recent tenant-quality profile in this submarket — average credit score on applications, eviction rate, late-payment / NSF rate, and stable-employment percentage? A property-management company in the area should have these aggregated.
- How much new for-sale + rental construction is in the pipeline within 1–3 miles? Heavy new supply typically softens prices + rents 12–24 months out; constrained supply supports both.
Investment metrics
- 1% rule
- 0.78% ✗
- Cap rate
- 5.38%
- Cash-on-cash
- -3.26%
- DSCR
- 0.85
- GRM
- 10.7
CMA / ARV
- ARV (median comp)
- $395,456
- List price
- $329,000
- Delta
- -16.80%
- Verdict
- UNDERPRICED
- Comps
- 20 within 1.0 mi
Show comp detail 11 sales within ~0.75 mi
| Address | Dist | Beds/Ba | Sqft | Sold | Price | $/sf | Match |
|---|---|---|---|---|---|---|---|
| 9704 Brook Wood Dr | 0.10mi | 3/2.0 (-1) | 1,673 (-4%) | 1mo | $340,000 | $203 | 82 |
| 9752 Brook Wood Dr | 0.06mi | 3/2.0 (-1) | 1,940 (+11%) | 11mo | $375,500 | $194 | 66 |
| 9695 Timberbrooke Blvd | 0.14mi | 3/2.0 (-1) | 1,630 (-7%) | 15mo | $330,000 | $202 | 65 |
| 14072 Timber Knoll Dr | 0.21mi | 3/2.0 (-1) | 1,820 (+4%) | 20mo | $385,000 | $212 | 62 |
| 14092 Short Stone Pl | 0.13mi | 3/2.0 (-1) | 1,850 (+6%) | 24mo | $373,000 | $202 | 60 |
| 5316 Chambers Ct | 0.50mi | 3/2.0 (-1) | 1,528 (-13%) | 3mo | $335,000 | $219 | 48 |
| 5328 Covington Ave | 0.45mi | 3/2.0 (-1) | 1,582 (-10%) | 13mo | $405,000 | $256 | 47 |
| 9708 Holborn Ave | 0.74mi | 3/2.0 (-1) | 1,543 (-12%) | 1mo | $374,900 | $243 | 40 |
| 5103 Covington Ave | 0.57mi | 3/2.0 (-1) | 1,520 (-13%) | 10mo | $362,000 | $238 | 38 |
| 9696 Parkhurst Xing | 0.66mi | 3/2.0 (-1) | 1,528 (-13%) | 10mo | $351,000 | $230 | 35 |
| 10224 Anees Ln | 0.64mi | 3/2.0 (-1) | 1,996 (+14%) | 18mo | $445,000 | $223 | 27 |
Match score weights: distance 35% · size 25% · config 20% · recency 20%. Top-matched comps best support the ARV.
Projected returns pro-forma
-3.0% appreciation · 5.18% rent growth · sell at horizon
- IRR
- -19.3%
- Equity multiple
- 0.31×
- Total profit
- $-63,490
- Equity at exit
- $49,055
- IRR
- -8.1%
- Equity multiple
- 0.45×
- Total profit
- $-51,095
- Equity at exit
- $28,446
Cash invested: $92,120 (down + closing). Projections, not guarantees.
Landlord ↔ Tenant lean methodology
- Overall (STATE)
- 90 Strongly Landlord-Friendly
- State Indiana
- 90 Strongly Landlord-Friendly · R+11
- County
- — inherits STATE
- City
- — inherits STATE
ZIP-level market 46055
- Home prices YoY
- -20.1%
- Rents YoY
- 5.2%
- Active inventory
- 425
- Price-to-rent
- 10.7×
Monthly cashflow live
- Estimated rent
- $2,555 medium interval (Pro) →
- Mortgage (P&I)
- −$1,725
- Tax from tax record
- −$257 /mo · $3,079/yr
- Insurance
- −$137
- HOA
- −$150
- Vacancy / Maint / Mgmt
- −$537
- Net cashflow
- $-250
Break-even live
Sensitivity live
| Price | -10% $-64 | -5% $-157 | +0% $-250 | +5% $-343 | +10% $-437 |
|---|---|---|---|---|---|
| Rent | -10% $-452 | -5% $-351 | +0% $-250 | +5% $-149 | +10% $-48 |
| Rate | -1.0pp $-85 | -0.5pp $-167 | base $-250 | +0.5pp $-336 | +1.0pp $-422 |
UW: 25.0% down · 7.5% · 30yr · 1.5% tax · 5.0% vac · 8.0% maint · 8.0% mgmt
Financing live
Cash to close
- Down payment
- $82,250
- Closing costs
- $9,870
- Reserves months
- —
- Total cash needed
- —
Loan-product check · same deal, 3 products live
Conventional
25% down · 7.5% · 30yr
- Down + closing
- —
- Monthly P&I
- —
- Monthly cashflow
- —
- DSCR
- —
- Eligible?
- —
Personal DTI + credit; lowest rate.
DSCR
20% down · 8.5% · 30yr
- Down + closing
- —
- Monthly P&I
- —
- Monthly cashflow
- —
- DSCR
- —
- Eligible?
- —
No personal income docs; deal must DSCR.
Hard money
10% down · 12.0% · 12mo
- Down + closing
- —
- Monthly P&I
- —
- Monthly cashflow
- —
- DSCR
- —
- Eligible?
- —
Short-term bridge; refi at stabilization.
HOA detail
- Monthly dues
- $150 · $1,800/yr
Listing history 17 events
-
2026-06-21days on market $329,000 Active 40 DOM
-
2026-06-18days on market $329,000 Active 37 DOM
-
2026-06-17days on market $329,000 Active 36 DOM
-
2026-06-16days on market $329,000 Active 35 DOM
-
2026-06-15days on market $329,000 Active 34 DOM
-
2026-06-13pricedays on market $329,000 Active 32 DOM
-
2026-06-09days on market $332,000 Active 28 DOM
-
2026-06-08days on market $332,000 Active 27 DOM
-
2026-06-07days on market $332,000 Active 26 DOM
-
2026-06-03days on market $332,000 Active 22 DOM
-
2026-06-02pricedays on market $332,000 Active 21 DOM
-
2026-06-01days on market $335,000 Active 20 DOM
-
2026-05-31days on market $335,000 Active 19 DOM
-
2026-05-11$350,000 Active 931-char remark
-
2023-06-23soldstatus $329,000 Closed 434-char remark
Show marketing remark (434 chars)
Don't miss this opportunity in pristine Timberstone Villas! This split floorplan ranch home features an open concept great room, kitchen with 42" cabinets, and office space. The primary suite features a large walk in closet, soaker tub, full shower stall, and double vanity. The backyard hosts a deck, fire pit, and has direct access to the walking trail. Additional photos to come, but don't miss your opportunity to tour today!
-
2023-05-23status Pending 434-char remark
Show marketing remark (434 chars)
Don't miss this opportunity in pristine Timberstone Villas! This split floorplan ranch home features an open concept great room, kitchen with 42" cabinets, and office space. The primary suite features a large walk in closet, soaker tub, full shower stall, and double vanity. The backyard hosts a deck, fire pit, and has direct access to the walking trail. Additional photos to come, but don't miss your opportunity to tour today!
-
2023-05-18$330,000 Active 434-char remark
Show marketing remark (434 chars)
Don't miss this opportunity in pristine Timberstone Villas! This split floorplan ranch home features an open concept great room, kitchen with 42" cabinets, and office space. The primary suite features a large walk in closet, soaker tub, full shower stall, and double vanity. The backyard hosts a deck, fire pit, and has direct access to the walking trail. Additional photos to come, but don't miss your opportunity to tour today!
ⓘ Source: listings_history table (triggers on properties + properties_extension) + one-shot
backfill from property_details.listing_events for pre-trigger history.
Tax reassessment forecast IN · Partial reset (capped growth)
- Current annual tax
- $3,079 · $257/mo
- Projected year-2 tax
- $3,079 · $257/mo
- Expected delta
- $0/yr ($0/mo · 0.0%)
ⓘ Screening estimate from a state-policy table — verify with the county assessor before closing.
Climate risk First Street
- Flood 1/10 Low FEMA zone X (unshaded) · 0% chance over 30 yrs
- Wildfire 1/10 Low
- Heat 3/10 Moderate 7 d/yr ≥100°F today · 18 d/yr by 30 yrs out
- Wind 2/10 Low 0% chance of damaging wind over 30 yrs
- Air quality 2/10 Low 1 unhealthy d/yr today · 2 by 30 yrs out
Nearby sold comps map
Loading sold comps map…
Walkable amenities ~0.75 mi
Loading nearby amenities…
Taxation est. · year 1
- Rental income
- $30,664
- − Mortgage interest
- −$18,429
- − Property taxes
- −$3,079
- − Insurance
- −$1,645
- − Repairs & maintenance
- −$2,453
- − Management
- −$2,453
- − HOA
- −$1,800
- − Depreciation
- −$9,571
- Taxable loss
- −$8,766
- Est. tax savings @ 24.0%
- +$2,104
- After-tax cash flow
- $-899/yr
For passive investors: Depreciation is non-cash, so a rental often shows a tax loss while cash-flowing — sheltering income. Rental losses are passive: they offset passive income freely, and up to $25,000/yr can offset ordinary (W-2) income if you actively participate and your MAGI is under $100k (phasing out to $0 by $150k); unused losses carry forward. On sale, claimed depreciation is recaptured at up to 25%, and gains may owe capital-gains tax (a 1031 exchange can defer both). Figures are a year-1 estimate at your 24.0% rate — not tax advice; consult a CPA.
Schools (NCES district)
- District
- Hamilton Southeastern Schools
- NCES district ID
- 1810650
- Math proficiency
- 57% ▼ -11.00%
- Reading proficiency
- 59% ▼ -7.00%
- Median HH income
- $87,726
- Composite
- 53.02/100
- National rank
- #1520
- State rank
- #14 of 301 in IN
Livability — Fishers
- Score
- 83/100
- State rank
- #11
- US rank
- #898
Category grades
Schools grade is shown separately in the Schools card above.
Census & demographics
- Census place
- Fishers, IN
- County
- Hancock County · 59,521 people
- City population
- 92,467
- Metro
- Indianapolis-Carmel-Anderson, IN
- Population (ZIP)
- 16,010
- Household income
- $113,784
- Rent vs Own
- Severe rent burden
- 58.0
Population outlook (Hamilton County) Hauer SSP2
- Today (2025)
- 381,938 people
- By 2030
- 417,496 · +9.3%
- By 2040
- 486,684 · +27.4%
- By 2050
- 549,805 · +44.0%
- By 2075
- 687,078 · +79.9%
- By 2100
- 754,495 · +97.5%
Race, ethnicity, and origin ACS 2023
- Neighborhood character
- Predominantly White (77%)
- Race & ethnicity
- White 77% Black 13% Two or more races 6% Hispanic / Latino 4% Asian 1%
- Common ancestry
- Lithuanian 3% Italian 3% Romanian 3%
- Foreign-born
- 4% · Canada, Vietnam, Jamaica
- Languages at home
- 94% English-only · Spanish 4%
Political lean MEDSL · Hamilton
- 2024 margin
- Lean R (+6.1) · D 46.0% · R 52.1% · Other 1.9%
- 2008→2024 swing
- +16.2pp toward D · 2008: -22.2pp · 2024: -6.1pp
- All cycles
- 2024: R+6.1 2020: R+6.8 2016: R+19.6 2012: R+34.3 2008: R+22.2
Not yet ingested
- Civics
- —
Market trends
- HPI YoY
- ▼ -52.35%
- Current HPI
- 207.9764
- Rent YoY
- ▲ 5.18%
- Metro
- Indianapolis-Carmel-Anderson, IN
- State GDP YoY
- ▲ 2.90%
- F500 in state
- 18
Industry mix (Fortune 500 HQ in IN)
| Industry | F500 HQs | Revenue |
|---|---|---|
| Industrial Machinery | 2 | $37B |
|
||
| Healthcare | 1 | $177B |
|
||
| Pharmaceuticals | 1 | $45B |
|
||
| Metals / Steel | 1 | $18B |
|
||
| Agriculture | 1 | $17B |
|
||
| Packaging | 1 | $12B |
|
||
Price history
-0.3% since first listed7 events — show timeline
- 2026-06-10 Price Changed $329,000 MIBOR as Distributed by MLS Grid
- 2026-06-02 Price Changed $332,000 MIBOR as Distributed by MLS Grid
- 2026-05-26 Price Changed $335,000 MIBOR as Distributed by MLS Grid
- 2026-05-11 Listed $350,000 MIBOR as Distributed by MLS Grid
- 2023-06-23 Sold (MLS) $329,000 MIBOR as Distributed by MLS Grid
- 2023-05-23 Pending — MIBOR as Distributed by MLS Grid
- 2023-05-18 Listed $330,000 MIBOR as Distributed by MLS Grid
Property tax history
-1.7%/yrLatest (2025): $3,079 · -3.6% YoY. Source: county tax records.
Cash-flow waterfall
monthlySold comps — $/sqft
last 12 mo · ≤1 miLoading sold comps…