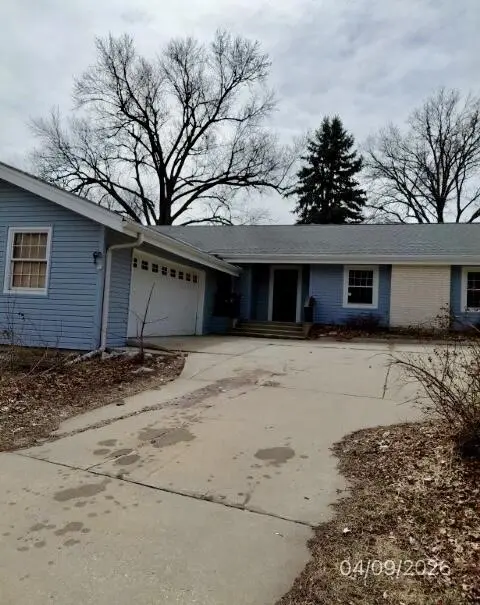
1321 Victoria St · Harlan, IA
Flood risk 1/10 · Minimal
- FEMA flood zone
- X (unshaded)
- Chance of flooding over 30 yrs
- 0.0%
- Est. flood insurance / yr
- $507 – $1,088
Fire risk 1/10 · Minimal
- Est. fire insurance / yr
- $902 – $1,676
Heat risk 3/10 · Minor
- Hot days now (above 103°F)
- 7 days/yr
- Hot days in 30 yrs
- 15 days/yr
Wind risk 2/10 · Minimal
- Chance of severe wind over 30 yrs
- —
Air-quality risk 1/10 · Minimal
- Unhealthy air days now
- 0 days/yr
- Unhealthy air days in 30 yrs
- 0 days/yr
Risk factors via First Street. Map © Google.
Why this score? — see what drove the B- grade
The composite is a weighted blend of 9 inputs, each scored 0–100. Each bar is that input's sub-score; the figure is the points it added to the 100-point composite (weight × sub-score).
- Cash flow +25.8/30.0
- DSCR +8.6/10.0
- 1% rule +8.5/10.0
- ARV discount +7.5/15.0
- Schools +6.3/10.0
- Livability +4.0/5.0
- Rent growth +2.5/5.0
- Condition / age +2.5/5.0
- Appreciation +0.0/10.0
$99,000
🖨 Deal sheet 📄 Offer letter ✓ Due diligence
Listing remarks MLS
1600 sq. ft. ranch home with unique interior. Entire home features all wood trim and light paneling. Exposed vaulted wood beams with lighting. New carpet and vinyl throughout home. Huge living room with non-functioning wood burning fireplace. Large master bedroom and full master bath, plus 2 large bedrooms. Main bath includes stack washer/dryer and lots of storage. Kitchen has ample oak cabinets and includes all appliances. Dining area is adjacent to kitchen with sliding door to patio, surrounded by new retaining wall. Most all new windows. Forced air gas furnace, central air and inline electric hot water heater. New roof. 2-car detached garage. Circle driveway, large lot.
Key facts
- Walk-out slider
- Patio
- Main-floor laundry
Tags
Neighborhood map
What this means for you Summary
Snapshot
- This is a 3-bed/2.0-bath single-family listed at $99k.
Deal economics
- At list price, monthly cash flow is $240 ($3k/yr) — positive.
- The deal already cash-flows at list — no discount required.
- Meets the 1% rule at list price ($1k rent vs $99k).
- Cap rate 9.2% vs local median 4.1% in Harlan — top-decile yield for the area; either an underpriced asset or a hidden risk that comps aren't pricing in. Stress-test before assuming the spread holds.
Location & tenants
- Location reads 80/100 on livability (#79 in IA, #1,656 nationally) — a professional / high-income tenant draw. Strengths: cost of living A+, housing A+, health & safety A+; Watch: employment D+, amenities F, commute F.
- Harlan Community School District (town): math 72% / reading 77% proficiency, ranked #81 of 289 in IA (top 28%) — strong family-tenant draw, lease renewals of 3-5y typical.
- Zoned schools: Harlan Primary (369 students, 44% FRL); Harlan Community Middle School (math 70% / reading 81%, grade A, #65 of 246 statewide, top 29%, 342 students, 36% FRL) — zoned schools average 40% FRL vs 25% district-wide (15 pts higher); higher-poverty schools than district average — tighter screening recommended.
- Market conditions: 34 active listings in the ZIP; 2 comparable units currently listed for rent nearby; 8 units permitted in Shelby County in 2024 (0 in 5+ unit buildings).
Forward outlook
- Local home prices are declining (-3.0%/yr); year-one equity from $684 of loan paydown is wiped out by about $3k of value loss. Plan a longer hold.
- Shelby County population projected to shrink 7% by 2050 — rents likely to lag national; underwrite the cash flow, not the appreciation.
Negotiation context
- Only 7 days on market — expect competitive offers; lowballing is unlikely to land.
- 2 sale attempts since 7y ago with the ask held roughly flat each time — persistent listings suggest the price (not the market) is what's stuck; bring a comps-based counter.
Risks & watch-outs
- Watch-outs: property tax is 3.1% of price.
Questions for the listing agent
- Built in 1973 — when were the roof, HVAC, electrical panel, plumbing, and water heater last replaced?
- Property tax is high relative to price — has the assessment been appealed recently, and will the sale trigger a re-assessment?
- Is there a deadline driving the sale (1031 exchange, divorce, estate, relocation)? That informs how much negotiation room exists.
- Schools are A-rated — typically a magnet for longer-tenancy family renters. What's the average tenant stay here, and is there a school-zone premium baked into asking?
- What's the average days-on-market for RENTAL listings here right now (not sales)? A rising rental-DOM trend means longer vacancies and softer asking-rent achievability than the comps imply.
- What's the recent tenant-quality profile in this submarket — average credit score on applications, eviction rate, late-payment / NSF rate, and stable-employment percentage? A property-management company in the area should have these aggregated.
- How much new for-sale + rental construction is in the pipeline within 1–3 miles? Heavy new supply typically softens prices + rents 12–24 months out; constrained supply supports both.
Investment metrics
- 1% rule
- 1.35% ✓
- Cap rate
- 9.20%
- Cash-on-cash
- 10.38%
- DSCR
- 1.46
- GRM
- 6.2
CMA / ARV
- ARV (on-the-fly)
- $199,392
- Comps found
- 12
Show comp detail 12 sales within ~0.75 mi
| Address | Dist | Beds/Ba | Sqft | Sold | Price | $/sf | Match |
|---|---|---|---|---|---|---|---|
| 1401 College Blvd | 0.38mi | 3/2.0 | 1,622 (+1%) | 7mo | $185,000 | $114 | 75 |
| 1203 Durant St | 0.20mi | 3/2.5 | 1,544 (-4%) | 11mo | $192,000 | $124 | 73 |
| 2008 18th St | 0.47mi | 4/2.0 (+1) | 1,581 (-2%) | 1mo | $215,000 | $136 | 69 |
| 706 Euclid St | 0.66mi | 3/1.5 | 1,585 (-1%) | 1mo | $162,500 | $103 | 64 |
| 1509 Linda Ln | 0.37mi | 3/1.5 | 1,713 (+6%) | 10mo | $184,500 | $108 | 61 |
| 2009 Franklin Ave | 0.42mi | 2/2.0 (-1) | 1,719 (+7%) | 4mo | $168,000 | $98 | 61 |
| 805 Baldwin St | 0.44mi | 4/2.5 (+1) | 1,694 (+5%) | 9mo | $234,900 | $139 | 56 |
| 1007 16th St | 0.27mi | 2/3.5 (-1) | 1,803 (+12%) | 0mo | $338,506,000 | $187,746 | 56 |
| 1811 8th St | 0.53mi | 4/2.0 (+1) | 1,507 (-6%) | 7mo | $220,000 | $146 | 54 |
| 1102 Hill St | 0.43mi | 2/2.0 (-1) | 1,750 (+9%) | 8mo | $103,000 | $59 | 54 |
| 503 12th St St | 0.58mi | 3/3.0 | 1,396 (-13%) | 0mo | $298,000 | $213 | 46 |
| 2209 7th St | 0.75mi | 4/1.0 (+1) | 1,570 (-2%) | 8mo | $135,000 | $86 | 45 |
Match score weights: distance 35% · size 25% · config 20% · recency 20%. Top-matched comps best support the ARV.
Projected returns pro-forma
-3.0% appreciation · 3.0% rent growth · sell at horizon
- IRR
- -0.6%
- Equity multiple
- 0.98×
- Total profit
- $-665
- Equity at exit
- $14,761
- IRR
- 9.1%
- Equity multiple
- 1.70×
- Total profit
- $19,508
- Equity at exit
- $8,560
Cash invested: $27,720 (down + closing). Projections, not guarantees.
Landlord ↔ Tenant lean methodology
- Overall (STATE)
- 83 Strongly Landlord-Friendly
- State Iowa
- 83 Strongly Landlord-Friendly · R+6
- County
- — inherits STATE
- City
- — inherits STATE
ZIP-level market 51537
- Home prices YoY
- -26.9%
- Active inventory
- 34
- Price-to-rent
- 6.2×
Monthly cashflow live
- Estimated rent
- $1,341 medium interval (Pro) →
- Mortgage (P&I)
- −$519
- Tax from tax record
- −$259 /mo · $3,110/yr
- Insurance
- −$41
- HOA
- −$0
- Vacancy / Maint / Mgmt
- −$282
- Net cashflow
- $240
Break-even live
UW: 25.0% down · 7.5% · 30yr · 1.5% tax · 5.0% vac · 8.0% maint · 8.0% mgmt
Financing live
Cash to close
- Down payment
- $24,750
- Closing costs
- $2,970
- Reserves months
- —
- Total cash needed
- —
Loan-product check · same deal, 3 products live
Conventional
25% down · 7.5% · 30yr
- Down + closing
- —
- Monthly P&I
- —
- Monthly cashflow
- —
- DSCR
- —
- Eligible?
- —
Personal DTI + credit; lowest rate.
DSCR
20% down · 8.5% · 30yr
- Down + closing
- —
- Monthly P&I
- —
- Monthly cashflow
- —
- DSCR
- —
- Eligible?
- —
No personal income docs; deal must DSCR.
Hard money
10% down · 12.0% · 12mo
- Down + closing
- —
- Monthly P&I
- —
- Monthly cashflow
- —
- DSCR
- —
- Eligible?
- —
Short-term bridge; refi at stabilization.
Rent comps 2 comps
| Address | Beds | Baths | Sqft | Rent | $/sqft | DOM | Units | Dist |
|---|---|---|---|---|---|---|---|---|
| 611 Gary Scull Dr Unit 12-405 Harlan, IA | 3.0 | 2.0 | 1738 | $1,400 | $0.81 | 44d | 1 | 0.89mi |
| 611 Gary Scull Dr Unit 10-305 Harlan, IA | 3.0 | 2.0 | 1738 | $1,282 | $0.74 | 44d | 1 | 0.89mi |
Listing history 5 events
-
2026-04-20status Pending
-
2026-04-13$99,000 Active
-
2019-12-11soldstatus $137,000
-
2019-12-06soldstatus $137,000 681-char remark
Show marketing remark (681 chars)
1600 sq. ft. ranch home with unique interior. Entire home features all wood trim and light paneling. Exposed vaulted wood beams with lighting. New carpet and vinyl throughout home. Huge living room with non-functioning wood burning fireplace. Large master bedroom and full master bath, plus 2 large bedrooms. Main bath includes stack washer/dryer and lots of storage. Kitchen has ample oak cabinets and includes all appliances. Dining area is adjacent to kitchen with sliding door to patio, surrounded by new retaining wall. Most all new windows. Forced air gas furnace, central air and inline electric hot water heater. New roof. 2-car detached garage. Circle driveway, large lot.
-
2019-08-30$134,900 681-char remark
Show marketing remark (681 chars)
1600 sq. ft. ranch home with unique interior. Entire home features all wood trim and light paneling. Exposed vaulted wood beams with lighting. New carpet and vinyl throughout home. Huge living room with non-functioning wood burning fireplace. Large master bedroom and full master bath, plus 2 large bedrooms. Main bath includes stack washer/dryer and lots of storage. Kitchen has ample oak cabinets and includes all appliances. Dining area is adjacent to kitchen with sliding door to patio, surrounded by new retaining wall. Most all new windows. Forced air gas furnace, central air and inline electric hot water heater. New roof. 2-car detached garage. Circle driveway, large lot.
ⓘ Source: listings_history table (triggers on properties + properties_extension) + one-shot
backfill from property_details.listing_events for pre-trigger history.
Tax reassessment forecast IA · Partial reset (capped growth)
- Current annual tax
- $3,110 · $259/mo
- Projected year-2 tax
- $3,110 · $259/mo
- Expected delta
- $0/yr ($0/mo · 0.0%)
ⓘ Screening estimate from a state-policy table — verify with the county assessor before closing.
Climate risk First Street
- Flood 1/10 Low FEMA zone X (unshaded) · 0% chance over 30 yrs
- Wildfire 1/10 Low
- Heat 3/10 Moderate 7 d/yr ≥103°F today · 15 d/yr by 30 yrs out
- Wind 2/10 Low
- Air quality 1/10 Low 0 unhealthy d/yr today · 0 by 30 yrs out
Nearby sold comps map
Loading sold comps map…
Walkable amenities ~0.75 mi
Loading nearby amenities…
Taxation est. · year 1
- Rental income
- $16,092
- − Mortgage interest
- −$5,546
- − Property taxes
- −$3,110
- − Insurance
- −$495
- − Repairs & maintenance
- −$1,287
- − Management
- −$1,287
- − Depreciation
- −$2,880
- Taxable income
- $1,487
- Est. tax owed @ 24.0%
- −$357
- After-tax cash flow
- $2,521/yr
For passive investors: Depreciation is non-cash, so a rental often shows a tax loss while cash-flowing — sheltering income. Rental losses are passive: they offset passive income freely, and up to $25,000/yr can offset ordinary (W-2) income if you actively participate and your MAGI is under $100k (phasing out to $0 by $150k); unused losses carry forward. On sale, claimed depreciation is recaptured at up to 25%, and gains may owe capital-gains tax (a 1031 exchange can defer both). Figures are a year-1 estimate at your 24.0% rate — not tax advice; consult a CPA.
Schools (NCES district)
- District
- Harlan Community School District
- NCES district ID
- 1913500
- Math proficiency
- 72% ▼ -7.00%
- Reading proficiency
- 77% ▼ -3.00%
- Median HH income
- $48,557
- Composite
- 62.95/100
- National rank
- #656
- State rank
- #81 of 289 in IA
Livability — Harlan
- Score
- 80/100
- State rank
- #79
- US rank
- #1656
Category grades
Schools grade is shown separately in the Schools card above.
Census & demographics
- Census place
- Harlan, IA
- Population (ZIP)
- 6,480
Population outlook (Shelby County) Hauer SSP2
- Today (2025)
- 11,637 people
- By 2030
- 11,472 · -1.4%
- By 2040
- 11,146 · -4.2%
- By 2050
- 10,791 · -7.3%
- By 2075
- 10,601 · -8.9%
- By 2100
- 10,338 · -11.2%
Race, ethnicity, and origin ACS 2023
- Neighborhood character
- Predominantly White (91%)
- Race & ethnicity
- White 91% Two or more races 5% Hispanic / Latino 3%
- Common ancestry
- Portuguese 3% Lithuanian 3% Iranian 2%
- Foreign-born
- 2% · Canada
- Languages at home
- 98% English-only · Spanish 2%
Political lean MEDSL · Shelby
- 2024 margin
- Solid R (+43.0) · D 27.9% · R 70.9% · Other 1.2%
- 2008→2024 swing
- -33.3pp toward R · 2008: -9.7pp · 2024: -43.0pp
- All cycles
- 2024: R+43.0 2020: R+40.3 2016: R+42.9 2012: R+22.2 2008: R+9.7
Not yet ingested
- Civics
- —
Market trends
- HPI YoY
- ▼ -77.04%
- Current HPI
- 209.5911
- Rent YoY
- —
- Metro
- —
- State GDP YoY
- ▲ 2.48%
- F500 in state
- 4
Industry mix (Fortune 500 HQ in IA)
| Industry | F500 HQs | Revenue |
|---|---|---|
| Financial Services | 1 | $16B |
|
||
| Retail / Convenience | 1 | $15B |
|
||
Price history
-26.6% since first listed5 events — show timeline
- 2026-04-20 Pending — SWIAR
- 2026-04-13 Listed $99,000 SWIAR
- 2019-12-11 Sold (Public Records) $137,000 Public Records
- 2019-12-06 Sold (MLS) $137,000 IAR
- 2019-08-30 Listed $134,900 IAR
Property tax history
+3.0%/yrLatest (2025): $3,110 · -2.7% YoY. Source: county tax records.
Cash-flow waterfall
monthlySold comps — $/sqft
last 12 mo · ≤1 miLoading sold comps…