3131 S Ocean Dr #211 · Hallandale Beach, FL
Flood risk 9/10 · Severe
- FEMA flood zone
- AE
- Chance of flooding over 30 yrs
- 0.99%
- Est. flood insurance / yr
- $1,737 – $8,500
Fire risk 1/10 · Minimal
- Est. fire insurance / yr
- $947 – $1,759
Heat risk 10/10 · Severe
- Hot days now (above 103°F)
- 7 days/yr
- Hot days in 30 yrs
- 29 days/yr
Wind risk 10/10 · Severe
- Chance of severe wind over 30 yrs
- 99.0%
Air-quality risk 2/10 · Minimal
- Unhealthy air days now
- 1 days/yr
- Unhealthy air days in 30 yrs
- 2 days/yr
Risk factors via First Street. Map © Google.
Why this score? — see what drove the B grade
The composite is a weighted blend of 9 inputs, each scored 0–100. Each bar is that input's sub-score; the figure is the points it added to the 100-point composite (weight × sub-score).
- Cash flow +30.0/30.0
- 1% rule +10.0/10.0
- DSCR +10.0/10.0
- ARV discount +7.5/15.0
- Schools +4.1/10.0
- Livability +4.0/5.0
- Rent growth +2.6/5.0
- Condition / age +2.5/5.0
- Appreciation +0.0/10.0
$177,000
🖨 Deal sheet 📄 Offer letter ✓ Due diligence
Listing remarks
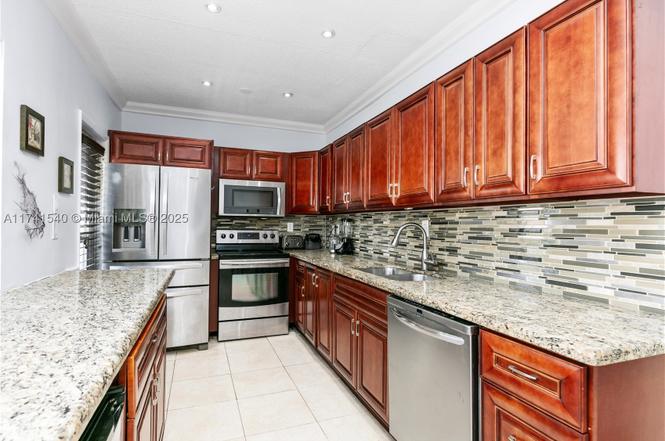
This 1 bed 1 bath with convertible that can be used as a 2nd bedroom or den. The apt. boasts a prime location across the street from the beach. The complex is on the intercoastal waterways offering stunning views of million dollar homes and yachts traveling by. Remolded with newer kitchen, and bath along with elegant tile floors throughout the space. Close to Aventura Mall, Gulfstream Horse Track and Casino, and dining. Free Hallandale bus service to shopping and more. Come have a look before the opportunity is no longer available. Must see!
Key facts
- Newer kitchen
- Elegant tile floors
- Stunning views
Tags
Property features AI
Finance
- Other: 75 units in community
- Financial info: Pets allowed conditionally with possible restrictions
- HOA & community: Monthly association fee; Association amenities include clubhouse, community kitchen, elevator(s), laundry, library, storage, bike storage, pool, transportation service, vehicle wash area; Association maintains common areas, structure, grounds, roof, pest control and reserves; includes parking and pool(s)
Exterior
- Parking: Assigned parking; Guest parking; One assigned space
- Security: Smoke detectors
- Utilities: Cable available; Association provides hot water, sewer, water and trash
- Home design: Attached property; Faces north; Entry on level 2; 1 story unit in a 2-story building
- Construction: Block construction; Resale property
- Exterior features: Balcony (open); Exterior lighting; Association pool (heated)
Interior
- Kitchen: Dishwasher; Electric range; Microwave; Refrigerator; Electric water heater
- Bedrooms: Bedroom on main level; Convertible bedroom/den
- Flooring: Tile
- Bathrooms: 1 full bathroom
- Heating & cooling: Central heating; Central air conditioning
- Interior features: Furnished; Blinds and metal single-hung impact windows; Walk-in closet(s); Living/dining room; Main living area on entry level; Second floor entry; Convertible bedroom
- Laundry & utility: Common area laundry
Neighborhood map
What this means for you Summary
Snapshot
- This is a 1-bed/1.0-bath condo listed at $177k.
Deal economics
- At list price, monthly cash flow is $613 ($7k/yr) — positive.
- The deal already cash-flows at list — no discount required.
- Meets the 1% rule at list price ($4k rent vs $177k).
- Recommended offer: $156k (12.0% below list) — sets the bar for market timing.
- Cap rate 13.3% vs local median 5.2% in Hallandale Beach — top-decile yield for the area; either an underpriced asset or a hidden risk that comps aren't pricing in. Stress-test before assuming the spread holds.
Location & tenants
- Location reads 81/100 on livability (#86 in FL, #1,400 nationally) — a professional / high-income tenant draw. Strengths: commute A+, health & safety A+, crime B+; Watch: schools C-, employment D-.
- Broward (suburban): math 42% / reading 53% proficiency, ranked #46 of 73 in FL (top 63%) — families likely to look elsewhere, expect single-tenant / working-renter base with shorter leases.
- Market conditions: Rents flat; 1373 active listings in the ZIP; 40 comparable units currently listed for rent nearby; rentals at typical pace (median 18d on market — plan ~3-4 weeks tenant-placement turnaround); 2,111 units permitted in Broward County in 2024 (1,265 in 5+ unit buildings).
- At $3,690/mo this rent would consume 85% of the median local household income ($52k/yr) (locally 3293% of renters already pay >50% of income on rent) — very limited rent-growth headroom before tenants either downsize or default.
Forward outlook
- Local home prices are declining (-3.0%/yr); year-one equity from $1k of loan paydown is wiped out by about $5k of value loss. Plan a longer hold.
- Broward County population projected at +34% by 2050 — long-run rental-demand tailwind backs the buy-and-hold thesis.
Negotiation context
- It's been on market 494 days — a 12% lower offer ($156k) is reasonable based on typical stale-listing flexibility.
- 7 sale attempts since 13y ago; this cycle's ask has dropped $24k (12%) from the opening price — seller is motivated, your offer sets the floor, not the list.
- Current owner paid $145k; 22% above their basis — modest negotiation headroom, anchor on the comps not their cost.
Risks & watch-outs
- Watch-outs: flood insurance adds $427/mo.
- Climate carrying-cost: in FEMA flood zone AE (mandatory federal flood insurance); severe wind risk, 99% chance of damaging wind over 30y; extreme-heat days projected 7→29/yr by 2055 (HVAC capex compounding) — expect insurance premiums to compound above CPI over the hold.
Questions for the listing agent
- It's been on market 494 days. Have you received any prior offers? Is the seller open to a 12% concession, seller financing, or rate buy-down credit?
- Built in 1963 — when were the roof, HVAC, electrical panel, plumbing, and water heater last replaced?
- What's the actual annual flood-insurance premium (NFIP or private), and is the property in a SFHA with mandatory coverage?
- What does the HOA fee cover, when was the last increase, and are there any pending special assessments or reserve-fund shortfalls?
- Any open or pending special assessments — roof, HVAC, plumbing, elevator, façade? What's the per-unit balance and payoff schedule, and is the seller paying it off at close or rolling it to the buyer?
- Why hasn't it sold? Are there any deal-killer items the seller is aware of (foundation, flood, title, zoning, code violations)?
- Is there a deadline driving the sale (1031 exchange, divorce, estate, relocation)? That informs how much negotiation room exists.
- What's the average days-on-market for RENTAL listings here right now (not sales)? A rising rental-DOM trend means longer vacancies and softer asking-rent achievability than the comps imply.
- What's the recent tenant-quality profile in this submarket — average credit score on applications, eviction rate, late-payment / NSF rate, and stable-employment percentage? A property-management company in the area should have these aggregated.
- How much new apartment / multifamily construction is in the pipeline within 1–3 miles? Heavy new supply (>2% of stock underway) typically softens rents 12–24 months out; light construction supports rent growth.
Investment metrics
- 1% rule
- 2.08% ✓
- Cap rate
- 13.34%
- Cash-on-cash
- 25.16%
- DSCR
- 2.12
- GRM
- 4.0
CMA / ARV
No comps found within radius.
Projected returns pro-forma
-3.0% appreciation · 0.43% rent growth · sell at horizon
- IRR
- 1.0%
- Equity multiple
- 1.04×
- Total profit
- $1,749
- Equity at exit
- $26,391
- IRR
- 6.1%
- Equity multiple
- 1.37×
- Total profit
- $18,421
- Equity at exit
- $15,304
Cash invested: $49,560 (down + closing). Projections, not guarantees.
Landlord ↔ Tenant lean methodology
- Overall (STATE)
- 87 Strongly Landlord-Friendly
- State Florida
- 87 Strongly Landlord-Friendly · R+3
- County
- — inherits STATE
- City
- — inherits STATE
ZIP-level market 33009
- Rents YoY
- 0.4%
- Active inventory
- 1373
- Price-to-rent
- 4.0×
Monthly cashflow live
- Estimated rent
- $3,690 high interval (Pro) →
- Mortgage (P&I)
- −$928
- Tax from tax record
- −$314 /mo · $3,770/yr
- Insurance
- −$74
- Flood insurance flood zone
- −$427 /mo · $5,118/yr
- HOA
- −$560
- Vacancy / Maint / Mgmt
- −$775
- Net cashflow
- $613
Break-even live
UW: 25.0% down · 7.5% · 30yr · 1.5% tax · 5.0% vac · 8.0% maint · 8.0% mgmt
Financing live
Cash to close
- Down payment
- $44,250
- Closing costs
- $5,310
- Reserves months
- —
- Total cash needed
- —
Loan-product check · same deal, 3 products live
Conventional
25% down · 7.5% · 30yr
- Down + closing
- —
- Monthly P&I
- —
- Monthly cashflow
- —
- DSCR
- —
- Eligible?
- —
Personal DTI + credit; lowest rate.
DSCR
20% down · 8.5% · 30yr
- Down + closing
- —
- Monthly P&I
- —
- Monthly cashflow
- —
- DSCR
- —
- Eligible?
- —
No personal income docs; deal must DSCR.
Hard money
10% down · 12.0% · 12mo
- Down + closing
- —
- Monthly P&I
- —
- Monthly cashflow
- —
- DSCR
- —
- Eligible?
- —
Short-term bridge; refi at stabilization.
Rent comps 40 comps
| Address | Beds | Baths | Sqft | Rent | $/sqft | DOM | Units | Dist |
|---|---|---|---|---|---|---|---|---|
| 2065 S Ocean Dr Unit 1049793P Hallandale Beach, FL | 2.0 | 2.0 | 871 | $4,971 | $5.71 | 8d | 1 | 0.08mi |
| 2080 S Ocean Dr #8 Hallandale Beach, FL | 2.0 | 2.0 | 1100 | $4,000 | $3.64 | 24d | 1 | 0.12mi |
| 2080 S Ocean Dr Hallandale Beach, FL | 2.0–3.0 | 2.0–2.5 | 1270 | $3,800 | $2.99 | 3d | 11 | 0.12mi |
| 2080 S Ocean Dr Hallandale Beach, FL | 2.0–3.0 | 2.0–2.5 | 1270 | $3,900 | $3.07 | 24d | 7 | 0.12mi |
| 3140 S Ocean Dr Hallandale Beach, FL | 2.0 | 2.0 | 1100 | $4,250 | $3.86 | 2d | 2 | 0.12mi |
| 3180 S Ocean Dr #1709 Hallandale Beach, FL | 2.0 | 2.0 | 1105 | $4,000 | $3.62 | 8d | 1 | 0.15mi |
| 3180 S Ocean Dr Hallandale Beach, FL | 2.0–3.0 | 2.0 | 1263 | $3,750 | $2.97 | 21d | 2 | 0.15mi |
| 3180 S Ocean Dr Hallandale Beach, FL | 2.0–3.0 | 2.0 | 1285 | $3,650 | $2.84 | 24d | 3 | 0.15mi |
| 1950 S Ocean Dr Unit 3D Hallandale Beach, FL | 1.0 | 1.5 | 870 | $3,950 | $4.54 | 5d | 1 | 0.27mi |
| 1950 S Ocean Dr Unit 12M Hallandale Beach, FL | 1.0 | 1.5 | 870 | $3,800 | $4.37 | 2d | 1 | 0.27mi |
| 1950 S Ocean Dr Unit 3D Hallandale Beach, FL | 1.0 | 1.5 | 870 | $3,950 | $4.54 | 13d | 1 | 0.27mi |
| 1950 S Ocean Dr Unit 12M Hallandale Beach, FL | 1.0 | 1.5 | 870 | $3,800 | $4.37 | 17d | 1 | 0.27mi |
| 1850 S Ocean Dr #4009 Hallandale Beach, FL | 2.0 | 1.0 | 1086 | $3,900 | $3.59 | 24d | 1 | 0.53mi |
| 1850 S Ocean Dr #2909 Hallandale Beach, FL | 2.0 | 1.0 | 1086 | $4,050 | $3.73 | 24d | 1 | 0.53mi |
| 1850 S Ocean Dr #3509 Hallandale Beach, FL | 2.0 | 1.0 | 1086 | $4,300 | $3.96 | 24d | 1 | 0.53mi |
| 1850 S Ocean Dr #3509 Hallandale Beach, FL | 2.0 | 1.0 | 1086 | $4,000 | $3.68 | 3d | 1 | 0.53mi |
| 1830 S Ocean Dr #1709 Hallandale Beach, FL | 1.0 | 1.0 | 844 | $4,500 | $5.33 | 24d | 1 | 0.57mi |
| 1830 S Ocean Dr #3005 Hallandale Beach, FL | 1.0 | 1.0 | 811 | $4,000 | $4.93 | 4d | 1 | 0.57mi |
| 1830 S Ocean Dr #4112 Hallandale Beach, FL | 1.0 | 1.0 | 844 | $3,950 | $4.68 | 5d | 1 | 0.57mi |
| 1830 S Ocean Dr #4005 Hallandale Beach, FL | 1.0 | 1.0 | 811 | $4,600 | $5.67 | 24d | 1 | 0.57mi |
| 1830 S Ocean Dr #4612 Hallandale Beach, FL | 1.0 | 1.0 | 844 | $4,950 | $5.86 | 24d | 1 | 0.57mi |
| 1830 S Ocean Dr #4307 Hallandale Beach, FL | 1.0 | 1.0 | 871 | $4,100 | $4.71 | 24d | 1 | 0.57mi |
| 1830 S Ocean Dr #3407 Hallandale Beach, FL | 1.0 | 1.0 | 871 | $4,000 | $4.59 | 24d | 1 | 0.57mi |
| 1830 S Ocean Dr #4712 Hallandale Beach, FL | 1.0 | 1.0 | 844 | $3,950 | $4.68 | 24d | 1 | 0.57mi |
| 1830 S Ocean Dr #4309 Hallandale Beach, FL | 1.0 | 1.0 | 844 | $3,900 | $4.62 | 24d | 1 | 0.57mi |
| 1830 S Ocean Dr #4212 Hallandale Beach, FL | 1.0 | 1.0 | 844 | $3,800 | $4.50 | 24d | 1 | 0.57mi |
| 1830 S Ocean Dr #1107 Hallandale Beach, FL | 1.0 | 1.0 | 871 | $3,750 | $4.31 | 24d | 1 | 0.57mi |
| 1830 S Ocean Dr #1812 Hallandale Beach, FL | 1.0 | 1.0 | 844 | $4,999 | $5.92 | 21d | 1 | 0.57mi |
| 1830 S Ocean Dr #2409 Hallandale Beach, FL | 1.0 | 1.0 | 844 | $4,300 | $5.09 | 14d | 1 | 0.57mi |
| 1830 S Ocean Dr #2412 Hallandale Beach, FL | 1.0 | 1.0 | 844 | $3,600 | $4.27 | 10d | 1 | 0.57mi |
| 1830 S Ocean Dr #4412 Hallandale Beach, FL | 1.0 | 1.0 | 844 | $4,500 | $5.33 | 8d | 1 | 0.57mi |
| 1830 S Ocean Dr #3605 Hallandale Beach, FL | 1.0 | 1.0 | 811 | $4,500 | $5.55 | 3d | 1 | 0.57mi |
| 1830 S Ocean Dr #4709 Hallandale Beach, FL | 1.0 | 1.0 | 844 | $3,800 | $4.50 | 3d | 1 | 0.57mi |
| 1830 S Ocean Dr #3005 Hallandale Beach, FL | 1.0 | 1.0 | 811 | $4,000 | $4.93 | 2d | 1 | 0.57mi |
| 1830 S Ocean Dr #1812 Hallandale Beach, FL | 1.0 | 1.0 | 844 | $3,999 | $4.74 | 2d | 1 | 0.57mi |
| 1830 S Ocean Dr #3112 Hallandale Beach, FL | 1.0 | 1.0 | 844 | $3,700 | $4.38 | 2d | 1 | 0.57mi |
| 1830 S Ocean Dr #2907 Hallandale Beach, FL | 1.0 | 1.0 | 871 | $4,000 | $4.59 | 3d | 1 | 0.57mi |
| 1830 S Ocean Dr #3909 Hallandale Beach, FL | 1.0 | 1.0 | 844 | $5,000 | $5.92 | 24d | 1 | 0.57mi |
| 1800 S Ocean Dr #4209 Hallandale Beach, FL | 2.0 | 1.0 | 1086 | $4,000 | $3.68 | 2d | 1 | 0.61mi |
| 1800 S Ocean Dr #909 Hallandale Beach, FL | 2.0 | 1.0 | 1086 | $4,000 | $3.68 | 24d | 1 | 0.61mi |
HOA detail condo
- Monthly dues
- $560 · $6,720/yr
- Likely covers
- water
- Assessments
- None detected in remarks — confirm with the listing agent.
Listing history 29 events
-
2026-06-18days on market $177,000 Active 494 DOM
-
2026-06-17days on market $177,000 Active 493 DOM
-
2026-06-16days on market $177,000 Active 492 DOM
-
2026-06-15days on market $177,000 Active 491 DOM
-
2026-06-13days on market $177,000 Active 489 DOM
-
2026-06-09days on market $177,000 Active 485 DOM
-
2026-06-07days on market $177,000 Active 483 DOM
-
2026-06-04days on market $177,000 Active 480 DOM
-
2026-06-03days on market $177,000 Active 479 DOM
-
2026-06-02days on market $177,000 Active 478 DOM
-
2026-06-01days on market $177,000 Active 477 DOM
-
2026-05-31days on market $177,000 Active 476 DOM
-
2026-04-02price $177,000
-
2026-02-08price $185,000
-
2026-02-08status Active
-
2026-02-07historical
-
2025-02-08$201,000 Active
-
2025-01-16historical
-
2024-12-13$195,000 Active
-
2024-09-05historical
-
2024-03-06$210,000 Active
-
2019-04-01soldstatus $145,000 Sold
-
2019-03-01status Pending
-
2019-02-21$150,000 Active
-
2018-12-23historical
-
2018-11-21price $150,000
-
2018-06-22$159,000 Active
-
2013-06-18soldstatus $86,500
-
2013-06-04$99,000
ⓘ Source: listings_history table (triggers on properties + properties_extension) + one-shot
backfill from property_details.listing_events for pre-trigger history.
Tax reassessment forecast FL · Resets to sale price
- Current annual tax
- $3,770 · $314/mo
- Projected year-2 tax
- $3,770 · $314/mo
- Expected delta
- $0/yr ($0/mo · 0.0%)
ⓘ Screening estimate from a state-policy table — verify with the county assessor before closing.
Climate risk First Street
- Flood 9/10 Extreme FEMA zone AE · 99% chance over 30 yrs
- Wildfire 1/10 Low
- Heat 10/10 Extreme 7 d/yr ≥103°F today · 29 d/yr by 30 yrs out
- Wind 10/10 Extreme 99% chance of damaging wind over 30 yrs
- Air quality 2/10 Low 1 unhealthy d/yr today · 2 by 30 yrs out
Nearby sold comps map
Loading sold comps map…
Walkable amenities ~0.75 mi
Loading nearby amenities…
Taxation est. · year 1
- Rental income
- $44,282
- − Mortgage interest
- −$9,915
- − Property taxes
- −$3,770
- − Insurance
- −$6,004
- − Repairs & maintenance
- −$3,543
- − Management
- −$3,543
- − HOA
- −$6,720
- − Depreciation
- −$5,149
- Taxable income
- $5,640
- Est. tax owed @ 24.0%
- −$1,354
- After-tax cash flow
- $5,997/yr
For passive investors: Depreciation is non-cash, so a rental often shows a tax loss while cash-flowing — sheltering income. Rental losses are passive: they offset passive income freely, and up to $25,000/yr can offset ordinary (W-2) income if you actively participate and your MAGI is under $100k (phasing out to $0 by $150k); unused losses carry forward. On sale, claimed depreciation is recaptured at up to 25%, and gains may owe capital-gains tax (a 1031 exchange can defer both). Figures are a year-1 estimate at your 24.0% rate — not tax advice; consult a CPA.
Schools (NCES district)
- District
- Broward
- NCES district ID
- 1200180
- Math proficiency
- 42% ▼ -18.00%
- Reading proficiency
- 53% ▼ -5.00%
- Median HH income
- $52,139
- Composite
- 40.88/100
- National rank
- #3621
- State rank
- #46 of 73 in FL
Livability — Hallandale Beach
- Score
- 81/100
- State rank
- #86
- US rank
- #1400
Category grades
Schools grade is shown separately in the Schools card above.
Census & demographics
- Census place
- Hallandale Beach, FL
- County
- Broward County · 1,963,430 people
- City population
- 44,021
- Metro
- Miami-Fort Lauderdale-Pompano Beach, FL
- Population (ZIP)
- 44,502
- Household income
- $52,079
- Rent vs Own
- Severe rent burden
- 3293.0
Population outlook (Broward County) Hauer SSP2
- Today (2025)
- 2,207,033 people
- By 2030
- 2,360,704 · +7.0%
- By 2040
- 2,661,208 · +20.6%
- By 2050
- 2,946,698 · +33.5%
- By 2075
- 3,602,273 · +63.2%
- By 2100
- 3,970,984 · +79.9%
Race, ethnicity, and origin ACS 2023
- Neighborhood character
- Diverse neighborhood (Simpson 0.67)
- Race & ethnicity
- Hispanic / Latino 39% White 39% Two or more races 24% Black 17% Asian 1%
- Hispanic origin (detail)
- Mexican 2% Puerto Rican 3% Cuban 9% Dominican 3% Salvadoran 2%
- Common ancestry
- Scotch-Irish 5% Hispanic 5% Subsaharan African 3%
- Foreign-born
- 51% · Canada, Jamaica, Dominican Republic
- Languages at home
- 38% English-only · Spanish 36% Russian/Polish/Slavic 12% French/Haitian/Cajun 7%
Political lean MEDSL · Broward
- 2024 margin
- D (+17.0) · D 58.0% · R 41.0%
- 2008→2024 swing
- -17.8pp toward R · 2008: 34.7pp · 2024: 17.0pp
- All cycles
- 2024: D+17.0 2020: D+29.8 2016: D+35.0 2012: D+34.9 2008: D+34.7
Not yet ingested
- Civics
- —
Market trends
- HPI YoY
- ▼ -299.13%
- Current HPI
- 329.9081
- Rent YoY
- ▲ 0.43%
- Metro
- Miami-Fort Lauderdale-Pompano Beach, FL
- State GDP YoY
- ▲ 3.28%
- F500 in state
- 36
Industry mix (Fortune 500 HQ in FL)
| Industry | F500 HQs | Revenue |
|---|---|---|
| Industrial Technology | 2 | $29B |
|
||
| Insurance | 2 | $17B |
|
||
| Retail | 1 | $60B |
|
||
| Technology Distribution | 1 | $58B |
|
||
| Homebuilding | 1 | $35B |
|
||
| Technology Manufacturing | 1 | $35B |
|
||
Price history
+78.8% since first listed17 events — show timeline
- 2026-04-02 Price Changed $177,000 MARMLS
- 2026-02-08 Price Changed $185,000 MARMLS
- 2026-02-08 Relisted — MARMLS
- 2026-02-07 Listing Removed — MARMLS
- 2025-02-08 Listed $201,000 MARMLS
- 2025-01-16 Listing Removed — MARMLS
- 2024-12-13 Listed $195,000 MARMLS
- 2024-09-05 Listing Removed — MARMLS
- 2024-03-06 Listed $210,000 MARMLS
- 2019-04-01 Sold (MLS) $145,000 MARMLS
- 2019-03-01 Pending — MARMLS
- 2019-02-21 Listed $150,000 MARMLS
- 2018-12-23 Listing Removed — Beaches MLS
- 2018-11-21 Price Changed $150,000 Beaches MLS
- 2018-06-22 Listed $159,000 Beaches MLS
- 2013-06-18 Sold (MLS) $86,500 Beaches MLS
- 2013-06-04 Listed $99,000 Beaches MLS
Property tax history
+8.1%/yrLatest (2025): $3,770 · +5.5% YoY. Source: county tax records.
Cash-flow waterfall
monthlySold comps — $/sqft
last 12 mo · ≤1 miLoading sold comps…