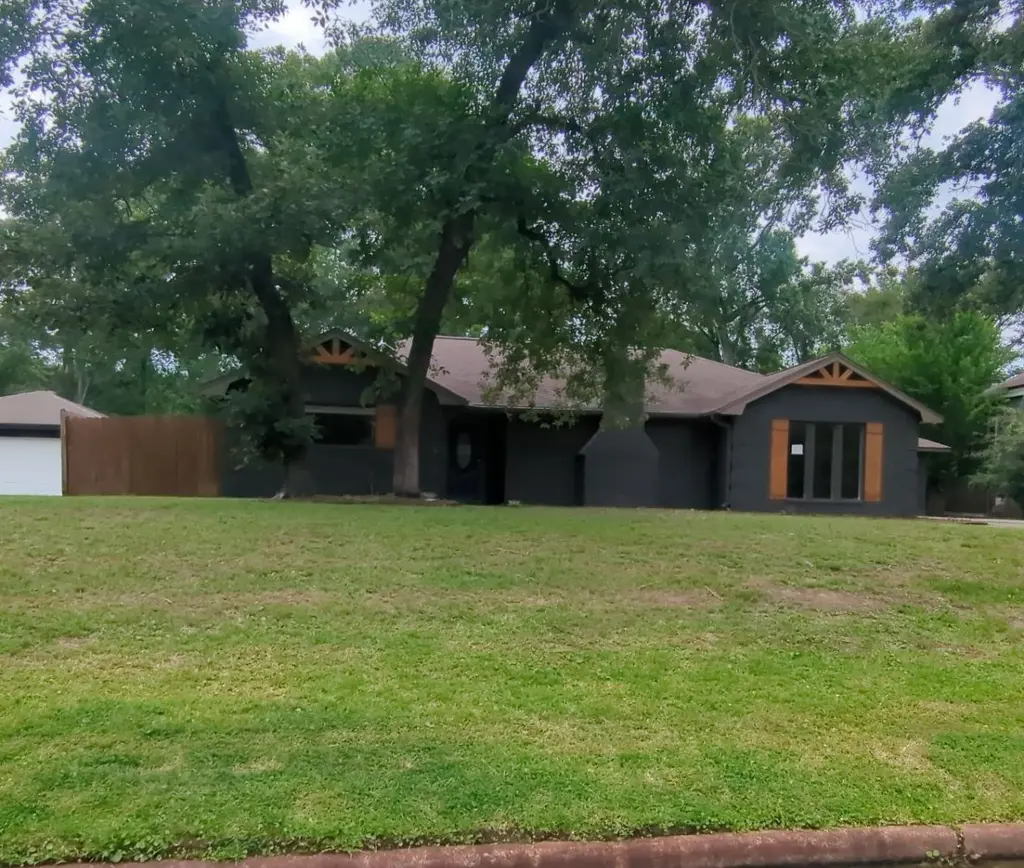
2656 S Woodloch St · Woodloch, TX
Flood risk 1/10 · Minimal
- FEMA flood zone
- AE
- Chance of flooding over 30 yrs
- 0.0%
- Est. flood insurance / yr
- $1,737 – $8,500
Fire risk 3/10 · Minor
- Est. fire insurance / yr
- $1,222 – $2,270
Heat risk 8/10 · Major
- Hot days now (above 111°F)
- 7 days/yr
- Hot days in 30 yrs
- 24 days/yr
Wind risk 8/10 · Major
- Chance of severe wind over 30 yrs
- 99.0%
Air-quality risk 3/10 · Minor
- Unhealthy air days now
- 2 days/yr
- Unhealthy air days in 30 yrs
- 3 days/yr
Risk factors via First Street. Map © Google.
Why this score? — see what drove the B- grade
The composite is a weighted blend of 9 inputs, each scored 0–100. Each bar is that input's sub-score; the figure is the points it added to the 100-point composite (weight × sub-score).
- Cash flow +23.0/30.0
- ARV discount +15.0/15.0
- 1% rule +9.4/10.0
- DSCR +7.4/10.0
- Schools +5.1/10.0
- Rent growth +3.5/5.0
- Livability +3.3/5.0
- Condition / age +2.5/5.0
- Appreciation +0.0/10.0
$146,000
🖨 Deal sheet 📄 Offer letter ✓ Due diligence
Listing remarks MLS
Well maintained and hard to come by ranch style home located on 1/3 acre lot with mature trees. As you enter into the home, you will be greeted by a built-in nook. Hard floors throughout the home makes for a clean look with easy maintenance. Just around the corner your spacious living area awaits with a wood burning fireplace and additional lighting. The space flows into the kitchen with a pass-through opening. The kitchen offers and abundance of custom, soft close cabinets, SS appliances & a walk-in pantry. Just off the living room/kitchen you will find a spacious formal dining room. This versatile space could also be used as a study. Spacious primary bedroom with en-suite bath. The primary bathroom is a blank canvas ready for you to complete with many of the materials avail. Large utility room with access to your extended private patio. Double wide driveway with spacious 2 car garage. Exterior & interior paint -2019. 5-ton A/C unit- 2019. Schedule your viewing today!
Key facts
- 0.34 acre lot
- 2 garage spots
- Built 1974
Property features AI
Exterior
- Parking: Attached 2-car garage
- Utilities: Public water; Public sewer
- Home design: Residential property; Entry on one level (first floor rooms noted)
- Construction: Brick construction; Composition roof; Slab foundation; Built in 1974
- Exterior features: Subdivision lot
Interior
- Kitchen: Kitchen on the first floor (approx. 14 x 19)
- Bedrooms: Bedroom on the first floor (approx. 11 x 12)
- Bathrooms: 2 full bathrooms
- Heating & cooling: Central heating (electric); Central air conditioning (electric)
- Interior features: One fireplace; 6 total rooms
Neighborhood map
What this means for you Summary
Snapshot
- This is a 3-bed/2.0-bath single-family listed at $146k.
Deal economics
- At list price, monthly cash flow is $-168 ($-2k/yr) — negative.
- To cash-flow at today's rent, offer at most $137k (5.9% below list).
- Meets the 1% rule at list price ($2k rent vs $146k).
- Recommended offer: $137k (5.9% below list) — sets the bar for cash-flow.
- Cap rate 8.4% vs local median 2.9% in Woodloch — top-decile yield for the area; either an underpriced asset or a hidden risk that comps aren't pricing in. Stress-test before assuming the spread holds.
Location & tenants
- Location reads 66/100 on livability (#653 in TX) — a middle-class / working-renter tenant base. Strengths: employment A+, cost of living A+, housing A+; Watch: crime C-, amenities F, commute F.
- Conroe ISD (other): math 57% / reading 57% proficiency, ranked #69 of 826 in TX (top 8%) — acceptable for families but not a draw, mixed tenant base, ~2y average lease.
- Zoned schools: Oak Ridge H S (math 48% / reading 62%, grade C, #373 of 1,632 statewide, top 23%, 2,672 students, 42% FRL).
- Market conditions: Rents rising (+3.9%/yr); 316 active listings in the ZIP; 4 comparable units currently listed for rent nearby; rentals at typical pace (median 14d on market — plan ~3-4 weeks tenant-placement turnaround); high-income renter base; 13,259 units permitted in Montgomery County in 2024 (1,402 in 5+ unit buildings).
Forward outlook
- Local home prices are declining (-3.0%/yr); year-one equity from $1k of loan paydown is wiped out by about $4k of value loss. Plan a longer hold.
- Montgomery County population projected at +65% by 2050 — long-run rental-demand tailwind backs the buy-and-hold thesis.
Negotiation context
- It's been on market 16 days — a 2% lower offer ($144k) is reasonable based on typical stale-listing flexibility.
- 4 sale attempts since 14y ago with the ask held roughly flat each time — persistent listings suggest the price (not the market) is what's stuck; bring a comps-based counter.
- Current owner paid $74k; list at $146k implies a 97% gain — meaningful room to come down on a strong offer.
Risks & watch-outs
- Watch-outs: property tax is 4.7% of price; flood insurance adds $427/mo.
- Climate carrying-cost: in FEMA flood zone AE (mandatory federal flood insurance); severe wind risk, 99% chance of damaging wind over 30y; extreme-heat days projected 7→24/yr by 2055 (HVAC capex compounding) — expect insurance premiums to compound above CPI over the hold.
Questions for the listing agent
- What do current leases actually rent for vs. the listed asking? Can we see a recent rent roll and the last 12 months of T-12 income?
- Built in 1974 — when were the roof, HVAC, electrical panel, plumbing, and water heater last replaced?
- Property tax is high relative to price — has the assessment been appealed recently, and will the sale trigger a re-assessment?
- What's the actual annual flood-insurance premium (NFIP or private), and is the property in a SFHA with mandatory coverage?
- Is there a deadline driving the sale (1031 exchange, divorce, estate, relocation)? That informs how much negotiation room exists.
- Schools are F-rated, which usually means shorter tenancies and higher turnover. Who's the typical renter profile here, and what's been the actual vacancy rate?
- What's the average days-on-market for RENTAL listings here right now (not sales)? A rising rental-DOM trend means longer vacancies and softer asking-rent achievability than the comps imply.
- What's the recent tenant-quality profile in this submarket — average credit score on applications, eviction rate, late-payment / NSF rate, and stable-employment percentage? A property-management company in the area should have these aggregated.
- How much new for-sale + rental construction is in the pipeline within 1–3 miles? Heavy new supply typically softens prices + rents 12–24 months out; constrained supply supports both.
Investment metrics
- 1% rule
- 1.44% ✓
- Cap rate
- 8.42%
- Cash-on-cash
- 7.59%
- DSCR
- 1.34
- GRM
- 5.8
CMA / ARV
- ARV (on-the-fly)
- $283,638
- Comps found
- 12
Show comp detail 12 sales within ~0.75 mi
| Address | Dist | Beds/Ba | Sqft | Sold | Price | $/sf | Match |
|---|---|---|---|---|---|---|---|
| 2535 River Rdg | 0.09mi | 4/2.5 (+1) | 2,301 (-0%) | 0mo | $274,900 | $119 | 88 |
| 2652 S Woodloch St | 0.04mi | 4/2.5 (+1) | 2,322 (+1%) | 5mo | $199,900 | $86 | 86 |
| 2664 S Woodloch St | 0.08mi | 3/2.0 | 2,260 (-2%) | 12mo | $244,900 | $108 | 83 |
| 2682 S Woodloch St | 0.24mi | 4/2.0 (+1) | 2,252 (-2%) | 13mo | $250,000 | $111 | 69 |
| 2554 River Rdg | 0.14mi | 3/2.0 | 2,547 (+10%) | 11mo | $159,000 | $62 | 67 |
| 2687 S Woodloch St | 0.29mi | 4/2.5 (+1) | 2,463 (+7%) | 2mo | $189,900 | $77 | 66 |
| 2524 River Rdg | 0.18mi | 3/2.0 | 1,990 (-14%) | 3mo | $260,000 | $131 | 66 |
| 10158 N Whimbrel Cir | 0.66mi | 4/2.5 (+1) | 2,284 (-1%) | 1mo | $316,000 | $138 | 60 |
| 10190 N Whimbrel Cir | 0.74mi | 4/2.5 (+1) | 2,254 (-2%) | 1mo | $317,000 | $141 | 54 |
| 16325 Olive Sparrow Dr | 0.43mi | 4/3.0 (+1) | 2,510 (+9%) | 13mo | $309,500 | $123 | 46 |
| 10127 N Whimbrel Cir | 0.57mi | 3/2.0 | 1,981 (-14%) | 13mo | $295,000 | $149 | 39 |
| 10035 S Whimbrel Cir | 0.63mi | 4/2.5 (+1) | 2,491 (+8%) | 15mo | $320,000 | $128 | 38 |
Match score weights: distance 35% · size 25% · config 20% · recency 20%. Top-matched comps best support the ARV.
Projected returns pro-forma
-3.0% appreciation · 3.88% rent growth · sell at horizon
- IRR
- -22.3%
- Equity multiple
- 0.22×
- Total profit
- $-31,956
- Equity at exit
- $21,769
- IRR
- -11.9%
- Equity multiple
- 0.23×
- Total profit
- $-31,616
- Equity at exit
- $12,623
Cash invested: $40,880 (down + closing). Projections, not guarantees.
Landlord ↔ Tenant lean methodology
- Overall (STATE)
- 87 Strongly Landlord-Friendly
- State Texas
- 87 Strongly Landlord-Friendly · R+5
- County
- — inherits STATE
- City
- — inherits STATE
ZIP-level market 77385
- Home prices YoY
- -27.5%
- Rents YoY
- 3.9%
- Active inventory
- 316
- Price-to-rent
- 5.8×
Monthly cashflow live
- Estimated rent
- $2,098 medium interval (Pro) →
- Mortgage (P&I)
- −$766
- Tax from tax record
- −$572 /mo · $6,868/yr
- Insurance
- −$61
- Flood insurance flood zone
- −$427 /mo · $5,118/yr
- HOA
- −$0
- Vacancy / Maint / Mgmt
- −$441
- Net cashflow
- $-168
Break-even live
UW: 25.0% down · 7.5% · 30yr · 1.5% tax · 5.0% vac · 8.0% maint · 8.0% mgmt
Financing live
Cash to close
- Down payment
- $36,500
- Closing costs
- $4,380
- Reserves months
- —
- Total cash needed
- —
Loan-product check · same deal, 3 products live
Conventional
25% down · 7.5% · 30yr
- Down + closing
- —
- Monthly P&I
- —
- Monthly cashflow
- —
- DSCR
- —
- Eligible?
- —
Personal DTI + credit; lowest rate.
DSCR
20% down · 8.5% · 30yr
- Down + closing
- —
- Monthly P&I
- —
- Monthly cashflow
- —
- DSCR
- —
- Eligible?
- —
No personal income docs; deal must DSCR.
Hard money
10% down · 12.0% · 12mo
- Down + closing
- —
- Monthly P&I
- —
- Monthly cashflow
- —
- DSCR
- —
- Eligible?
- —
Short-term bridge; refi at stabilization.
Rent comps 4 comps
| Address | Beds | Baths | Sqft | Rent | $/sqft | DOM | Units | Dist |
|---|---|---|---|---|---|---|---|---|
| 2657 S Woodloch St Conroe, TX | 4.0 | 2.0 | 1920 | $1,910 | $0.99 | 11d | 1 | 0.02mi |
| 2662 S Woodloch St Conroe, TX | 3.0 | 2.0 | 2046 | $1,960 | $0.96 | 14d | 1 | 0.07mi |
| 9952 Swallow Dr Conroe, TX | 3.0 | 2.5 | 3136 | $2,180 | $0.70 | 17d | 1 | 0.77mi |
| 16782 N Thrasher Dr Conroe, TX | 4.0 | 2.5 | 2137 | $2,065 | $0.97 | 14d | 1 | 0.96mi |
Listing history 12 events
-
2026-06-18days on market $146,000 Active 16 DOM
-
2026-06-17days on market $146,000 Active 15 DOM
-
2026-06-16days on market $146,000 Active 14 DOM
-
2026-06-15days on market $146,000 Active 13 DOM
-
2026-06-13days on market $146,000 Active 11 DOM
-
2026-06-09days on market $146,000 Active 7 DOM
-
2026-06-08days on market $146,000 Active 6 DOM
-
2026-06-07remarks 525-char remark
-
2026-06-07days on market $146,000 Active 5 DOM
-
2026-06-04days on market $146,000 Active 2 DOM
-
2026-06-02remarks 455-char remark
-
2026-06-02$146,000 Active 1 DOM
ⓘ Source: listings_history table (triggers on properties + properties_extension) + one-shot
backfill from property_details.listing_events for pre-trigger history.
Tax reassessment forecast TX · Resets to sale price
- Current annual tax
- $6,868 · $572/mo
- Projected year-2 tax
- $6,868 · $572/mo
- Expected delta
- $0/yr ($0/mo · 0.0%)
ⓘ Screening estimate from a state-policy table — verify with the county assessor before closing.
Climate risk First Street
- Flood 1/10 Low FEMA zone AE · 0% chance over 30 yrs
- Wildfire 3/10 Moderate
- Heat 8/10 Severe 7 d/yr ≥111°F today · 24 d/yr by 30 yrs out
- Wind 8/10 Severe 99% chance of damaging wind over 30 yrs
- Air quality 3/10 Moderate 2 unhealthy d/yr today · 3 by 30 yrs out
Nearby sold comps map
Loading sold comps map…
Walkable amenities ~0.75 mi
Loading nearby amenities…
Taxation est. · year 1
- Rental income
- $25,174
- − Mortgage interest
- −$8,178
- − Property taxes
- −$6,868
- − Insurance
- −$5,848
- − Repairs & maintenance
- −$2,014
- − Management
- −$2,014
- − Depreciation
- −$4,247
- Taxable loss
- −$3,996
- Est. tax savings @ 24.0%
- +$959
- After-tax cash flow
- $-1,058/yr
For passive investors: Depreciation is non-cash, so a rental often shows a tax loss while cash-flowing — sheltering income. Rental losses are passive: they offset passive income freely, and up to $25,000/yr can offset ordinary (W-2) income if you actively participate and your MAGI is under $100k (phasing out to $0 by $150k); unused losses carry forward. On sale, claimed depreciation is recaptured at up to 25%, and gains may owe capital-gains tax (a 1031 exchange can defer both). Figures are a year-1 estimate at your 24.0% rate — not tax advice; consult a CPA.
Schools (NCES district)
- District
- Conroe ISD
- NCES district ID
- 4815000
- Math proficiency
- 57% ▼ -6.00%
- Reading proficiency
- 57% ▼ -1.00%
- Median HH income
- $71,541
- Composite
- 50.65/100
- National rank
- #1833
- State rank
- #69 of 826 in TX
Livability — Woodloch
- Score
- 66/100
- State rank
- #653
- US rank
- #12310
Category grades
Schools grade is shown separately in the Schools card above.
Census & demographics
- Census place
- Woodloch, TX
- County
- Montgomery County · 663,713 people
- Metro
- Houston-The Woodlands-Sugar Land, TX
- Population (ZIP)
- 28,156
- Household income
- $117,118
- Rent vs Own
- Severe rent burden
- 471.0
Population outlook (Montgomery County) Hauer SSP2
- Today (2025)
- 713,896 people
- By 2030
- 805,263 · +12.8%
- By 2040
- 992,708 · +39.1%
- By 2050
- 1,179,590 · +65.2%
- By 2075
- 1,628,084 · +128.1%
- By 2100
- 1,937,880 · +171.5%
Race, ethnicity, and origin ACS 2023
- Neighborhood character
- Diverse neighborhood (Simpson 0.63)
- Race & ethnicity
- White 53% Hispanic / Latino 27% Two or more races 16% Black 11% Asian 5%
- Hispanic origin (detail)
- Mexican 15% Puerto Rican 2% Cuban 1%
- Common ancestry
- Slovak 3% Romanian 2% Italian 2%
- Foreign-born
- 15% · Canada, Jamaica, Vietnam
- Languages at home
- 76% English-only · Spanish 16% Other Indo-European 2% Other Asian/Pacific 1%
Political lean MEDSL · Montgomery
- 2024 margin
- Solid R (+45.5) · D 26.8% · R 72.3%
- 2008→2024 swing
- +7.2pp toward D · 2008: -52.7pp · 2024: -45.5pp
- All cycles
- 2024: R+45.5 2020: R+43.8 2016: R+51.4 2012: R+60.7 2008: R+52.7
Not yet ingested
- Civics
- —
Market trends
- HPI YoY
- ▼ -91.09%
- Current HPI
- 239.9434
- Rent YoY
- ▲ 3.88%
- Metro
- Houston-The Woodlands-Sugar Land, TX
- State GDP YoY
- ▲ 3.95%
- F500 in state
- 110
Industry mix (Fortune 500 HQ in TX)
| Industry | F500 HQs | Revenue |
|---|---|---|
| Energy | 16 | $1,198B |
|
||
| Technology | 5 | $198B |
|
||
| Engineering / Construction | 4 | $72B |
|
||
| Energy Services | 3 | $60B |
|
||
| Utilities | 3 | $41B |
|
||
| Healthcare | 2 | $330B |
|
||
Price history
+80.2% since first listed20 events — show timeline
- 2026-06-02 Listed $146,000 HARMLS
- 2023-03-03 Sold (Public Records) — Public Records
- 2023-03-01 Sold (MLS) — HARMLS
- 2023-01-26 Pending — HARMLS
- 2023-01-18 Pending — HARMLS
- 2022-12-30 Price Changed $260,000 HARMLS
- 2022-10-05 Price Changed $280,500 HARMLS
- 2022-10-03 Listed $289,900 HARMLS
- 2022-10-03 Listing Removed — HARMLS
- 2022-09-27 Price Changed $295,500 HARMLS
- 2022-09-19 Price Changed $299,300 HARMLS
- 2022-08-31 Price Changed $301,500 HARMLS
- 2022-08-22 Price Changed $307,500 HARMLS
- 2022-08-01 Price Changed $314,500 HARMLS
- 2022-07-21 Listed $319,500 HARMLS
- 2016-01-06 Sold (Public Records) — Public Records
- 2015-11-20 Sold (Public Records) — Public Records
- 2015-10-21 Sold (Public Records) $74,000 Public Records
- 2013-02-06 Listing Removed — HARMLS
- 2012-09-23 Listed $81,000 HARMLS
Property tax history
+6.0%/yrLatest (2025): $6,868 · +4.5% YoY. Source: county tax records.
Cash-flow waterfall
monthlySold comps — $/sqft
last 12 mo · ≤1 miLoading sold comps…