 Multi-family
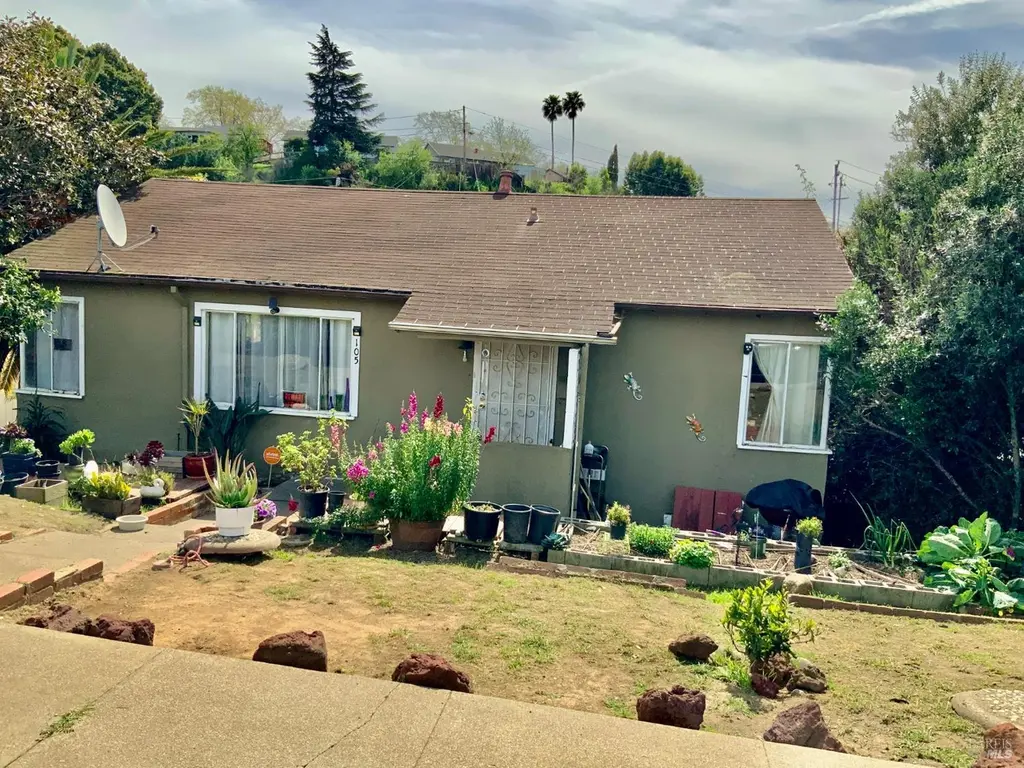
105 Laguna St · Vallejo, CA
Flood risk 7/10 · Major
- FEMA flood zone
- X (unshaded)
- Chance of flooding over 30 yrs
- 0.78%
- Est. flood insurance / yr
- $507 – $1,088
Fire risk 1/10 · Minimal
- Est. fire insurance / yr
- $659 – $1,223
Heat risk 4/10 · Minor
- Hot days now (above 93°F)
- 7 days/yr
- Hot days in 30 yrs
- 14 days/yr
Wind risk 1/10 · Minimal
- Chance of severe wind over 30 yrs
- —
Air-quality risk 9/10 · Severe
- Unhealthy air days now
- 16 days/yr
- Unhealthy air days in 30 yrs
- 17 days/yr
Risk factors via First Street. Map © Google.
Why this score? — see what drove the C+ grade
The composite is a weighted blend of 9 inputs, each scored 0–100. Each bar is that input's sub-score; the figure is the points it added to the 100-point composite (weight × sub-score).
- Cash flow +22.5/30.0
- ARV discount +15.0/15.0
- DSCR +7.2/10.0
- 1% rule +6.2/10.0
- Livability +3.4/5.0
- Rent growth +2.8/5.0
- Schools +2.6/10.0
- Condition / age +2.5/5.0
- Appreciation +0.0/10.0
$399,999
🖨 Deal sheet 📄 Offer letter ✓ Due diligence
Multi-family units
County records classify this as Multi-Family (2-4 Unit). Listing-text estimate: 1 unit. estimate disagrees with records
Listing remarks MLS
Fantastic opportunity for a visionary buyer! This Diamond in the Rough could be your Sparkling Gem with a little elbow grease and modernization. This property offers endless opportunity as a possible income producing duplex or as a primary residence with multi-generational intent. Live in the upstairs and finish building out the lower level for mom and pop, or live upstairs and rent out lower level. Lower level entry has separate access on the side of house or back entry from Denton Ct. with off-street parking. Lower level has existing 3 rooms, hallway, kitchen and bathroom. Property has a relatively short distance location to schools, shopping, freeways and waterfront. Let this must-see property welcome you and make your Dream come true!
Key facts
- Separate access
- Existing 3 rooms
- Off-street parking
Tags
Neighborhood map
What this means for you Summary
Snapshot
- This is a 3-bed/1.0-bath multifamily listed at $400k.
Deal economics
- At list price, monthly cash flow is $607 ($7k/yr) — positive.
- The deal already cash-flows at list — no discount required.
- Meets the 1% rule at list price ($4k rent vs $400k).
- Recommended offer: $364k (9.0% below list) — sets the bar for market timing.
- Cap rate 8.3% vs local median 3.1% in Vallejo — top-decile yield for the area; either an underpriced asset or a hidden risk that comps aren't pricing in. Stress-test before assuming the spread holds.
Location & tenants
- Location reads 67/100 on livability (#304 in CA) — a middle-class / working-renter tenant base. Strengths: commute A+, housing A+, health & safety A+; Watch: schools D-, crime F, cost of living F.
- Vallejo City Unified (urban): math 20% / reading 30% proficiency, ranked #1,124 of 1,400 in CA (top 80%) — low school quality limits family demand, transient renter base, plan for 1-2y turnover; 62% free/reduced lunch — lower-income household profile, screen leases tightly.
- Market conditions: Rents rising (+1.4%/yr); 185 active listings in the ZIP; 32 comparable units currently listed for rent nearby; rentals at typical pace (median 24d on market — plan ~3-4 weeks tenant-placement turnaround); 44% of comp listings sitting > 30 days — soft ceiling on asking rent; solid renter incomes; 1,472 units permitted in Solano County in 2024 (131 in 5+ unit buildings).
- At $4,471/mo this rent would consume 51% of the median local household income ($105k/yr) (locally 2021% of renters already pay >50% of income on rent) — very limited rent-growth headroom before tenants either downsize or default.
Forward outlook
- Local home prices are declining (-3.0%/yr); year-one equity from $3k of loan paydown is wiped out by about $12k of value loss. Plan a longer hold.
- Solano County population projected at +15% by 2050 — modest demand growth; plan on rents tracking national, not racing it.
Negotiation context
- It's been on market 94 days — a 9% lower offer ($364k) is reasonable based on typical stale-listing flexibility.
- Current owner paid $120k; list at $400k implies a 233% gain — meaningful room to come down on a strong offer.
Risks & watch-outs
- Watch-outs: flood insurance adds $66/mo; built in 1944 — expect roof / HVAC / electrical / plumbing capex.
- Climate carrying-cost: major flood risk — expect insurance premiums to compound above CPI over the hold.
Questions for the listing agent
- It's been on market 94 days. Have you received any prior offers? Is the seller open to a 9% concession, seller financing, or rate buy-down credit?
- Built in 1944 — when were the roof, HVAC, electrical panel, plumbing, and water heater last replaced?
- What's the actual annual flood-insurance premium (NFIP or private), and is the property in a SFHA with mandatory coverage?
- Why hasn't it sold? Are there any deal-killer items the seller is aware of (foundation, flood, title, zoning, code violations)?
- Is there a deadline driving the sale (1031 exchange, divorce, estate, relocation)? That informs how much negotiation room exists.
- Schools are D-rated, which usually means shorter tenancies and higher turnover. Who's the typical renter profile here, and what's been the actual vacancy rate?
- Crime grade is F in this area — have there been break-ins, vandalism, or insurance claims at this property in the last 3 years? What carrier currently insures it and at what premium?
- What's the average days-on-market for RENTAL listings here right now (not sales)? A rising rental-DOM trend means longer vacancies and softer asking-rent achievability than the comps imply.
- What's the recent tenant-quality profile in this submarket — average credit score on applications, eviction rate, late-payment / NSF rate, and stable-employment percentage? A property-management company in the area should have these aggregated.
- How much new apartment / multifamily construction is in the pipeline within 1–3 miles? Heavy new supply (>2% of stock underway) typically softens rents 12–24 months out; light construction supports rent growth.
Investment metrics
- 1% rule
- 1.12% ✓
- Cap rate
- 8.31%
- Cash-on-cash
- 7.21%
- DSCR
- 1.32
- GRM
- 7.5
CMA / ARV
- ARV (median comp)
- $494,961
- List price
- $399,999
- Delta
- -19.19%
- Verdict
- UNDERPRICED
- Comps
- 20 within 1.0 mi
Show comp detail 2 sales within ~0.75 mi
| Address | Dist | Beds/Ba | Sqft | Sold | Price | $/sf | Match |
|---|---|---|---|---|---|---|---|
| 954 Grant St | 0.52mi | 3/2.0 | 1,540 (+9%) | 11mo | $520,000 | $338 | 48 |
| 849 Benicia Rd | 0.52mi | 2/3.0 (-1) | 1,576 (+11%) | 14mo | $425,000 | $270 | 32 |
Match score weights: distance 35% · size 25% · config 20% · recency 20%. Top-matched comps best support the ARV.
Projected returns pro-forma
-3.0% appreciation · 1.35% rent growth · sell at horizon
- IRR
- -8.2%
- Equity multiple
- 0.70×
- Total profit
- $-33,305
- Equity at exit
- $59,641
- IRR
- -1.1%
- Equity multiple
- 0.93×
- Total profit
- $-7,548
- Equity at exit
- $34,585
Cash invested: $112,000 (down + closing). Projections, not guarantees.
Landlord ↔ Tenant lean methodology
- Overall (STATE)
- 18 Strongly Tenant-Friendly
- State California
- 18 Strongly Tenant-Friendly · D+13
- County
- — inherits STATE
- City
- — inherits STATE
ZIP-level market 94591
- Rents YoY
- 1.4%
- Active inventory
- 185
- Price-to-rent
- 14.9×
Monthly cashflow live
- Estimated rent
- $4,471 high interval (Pro) →
- Mortgage (P&I)
- −$2,098
- Tax from tax record
- −$595 /mo · $7,134/yr
- Insurance
- −$167
- Flood insurance flood zone
- −$66 /mo · $798/yr
- HOA
- −$0
- Vacancy / Maint / Mgmt
- −$939
- Net cashflow
- $607
Break-even live
2-unit breakdown (identical units grouped — click to expand)
| Units | Beds | Baths | Est. rent |
|---|---|---|---|
| 2× units | 2 | 1 | $4,472 |
| #1 | 2 | 1 | $2,236 |
| #2 | 2 | 1 | $2,236 |
| Total (2 units) | $4,471 | ||
UW: 25.0% down · 7.5% · 30yr · 1.5% tax · 5.0% vac · 8.0% maint · 8.0% mgmt
Financing live
Cash to close
- Down payment
- $100,000
- Closing costs
- $12,000
- Reserves months
- —
- Total cash needed
- —
Loan-product check · same deal, 3 products live
Conventional
25% down · 7.5% · 30yr
- Down + closing
- —
- Monthly P&I
- —
- Monthly cashflow
- —
- DSCR
- —
- Eligible?
- —
Personal DTI + credit; lowest rate.
DSCR
20% down · 8.5% · 30yr
- Down + closing
- —
- Monthly P&I
- —
- Monthly cashflow
- —
- DSCR
- —
- Eligible?
- —
No personal income docs; deal must DSCR.
Hard money
10% down · 12.0% · 12mo
- Down + closing
- —
- Monthly P&I
- —
- Monthly cashflow
- —
- DSCR
- —
- Eligible?
- —
Short-term bridge; refi at stabilization.
Rent comps 32 comps
| Address | Beds | Baths | Sqft | Rent | $/sqft | DOM | Units | Dist |
|---|---|---|---|---|---|---|---|---|
| 962 Pine St Vallejo, CA | 3.0 | 2.0 | 1000 | $3,200 | $3.20 | 43d | 1 | 0.27mi |
| 929 6th St Vallejo, CA | 3.0 | 2.0 | 1414 | $2,600 | $1.84 | 43d | 1 | 0.35mi |
| 407 Jordan St Vallejo, CA | 4.0 | 2.5 | 1408 | $2,850 | $2.02 | 43d | 1 | 0.43mi |
| 452 Wilshire Ave Vallejo, CA | 4.0 | 3.0 | 1845 | $3,500 | $1.90 | 13d | 1 | 0.54mi |
| 706 La Canyada Dr Vallejo, CA | 3.0 | 2.0 | 1075 | $2,799 | $2.60 | 13d | 1 | 0.54mi |
| 532 Magazine St Vallejo, CA | 2.0 | 2.0 | 762 | $3,188 | $4.18 | 1d | 9 | 0.58mi |
| 532 Magazine St Vallejo, CA | 2.0 | 1.0–2.0 | 792 | $2,988 | $3.77 | 3d | 11 | 0.58mi |
| 532 Magazine St Vallejo, CA | 1.0–2.0 | 1.0–2.0 | 792 | $2,888 | $3.65 | 24d | 12 | 0.58mi |
| 415 Wallace Ave Unit A Vallejo, CA | 2.0 | 1.0 | 1200 | $2,100 | $1.75 | 23d | 1 | 0.61mi |
| 415 Wallace Ave Unit 1 Vallejo, CA | 2.0 | 1.0 | 1200 | $2,650 | $2.21 | 43d | 1 | 0.61mi |
| 108 Esa Dr Vallejo, CA | 3.0 | 2.0 | 1196 | $2,200 | $1.84 | 43d | 1 | 0.61mi |
| 551 5th St Vallejo, CA | 3.0 | 1.0 | 1000 | $2,550 | $2.55 | 23d | 1 | 0.63mi |
| 100 Buss Ave Vallejo, CA | 2.0 | 1.0 | 1116 | $2,800 | $2.51 | 43d | 1 | 0.67mi |
| 573 Laurel St Vallejo, CA | 3.0 | 2.0 | 1710 | $2,869 | $1.68 | 23d | 1 | 0.70mi |
| 961 Porter St Vallejo, CA | 2.0–3.0 | 1.0–3.0 | 1159 | $3,355 | $2.89 | 1d | 11 | 0.70mi |
| 924 Palou St Vallejo, CA | 3.0 | 1.0 | 966 | $2,500 | $2.59 | 23d | 1 | 0.72mi |
| 925 Hargus Ave Unit C Vallejo, CA | 2.0 | 1.0 | 1300 | $1,960 | $1.51 | 13d | 1 | 0.79mi |
| 206 Sea Crest Cir Vallejo, CA | 2.0 | 2.5 | 1464 | $2,595 | $1.77 | 43d | 1 | 0.83mi |
| 136 Sea Crest Cir Vallejo, CA | 2.0 | 1.0 | 900 | $2,350 | $2.61 | 43d | 1 | 0.84mi |
| 2228 Georgia St Vallejo, CA | 3.0 | 2.0 | 1286 | $3,300 | $2.57 | 43d | 1 | 0.90mi |
| 209 14th St Vallejo, CA | 2.0 | 1.5 | 1600 | $2,300 | $1.44 | 13d | 1 | 0.93mi |
| 1222 York St Unit 1222-B Vallejo, CA | 2.0 | 1.0 | 1054 | $1,799 | $1.71 | 43d | 1 | 1.06mi |
| 1029 Virginia St Vallejo, CA | 2.0 | 1.0 | 1050 | $1,950 | $1.86 | 43d | 1 | 1.24mi |
| 115 James River Rd Vallejo, CA | 3.0 | 2.5 | 1472 | $2,850 | $1.94 | 12d | 1 | 1.24mi |
| 232 Doyle Dr Vallejo, CA | 3.0 | 1.5 | 1395 | $2,945 | $2.11 | 23d | 1 | 1.31mi |
| 116 Westwood St Vallejo, CA | 3.0 | 2.0 | 1000 | $2,800 | $2.80 | 23d | 1 | 1.34mi |
| 808 Georgia St Vallejo, CA | 3.0 | 1.0 | 1300 | $2,500 | $1.92 | 13d | 1 | 1.36mi |
| 765 Pope Dr Unit C Vallejo, CA | 2.0 | 2.0 | 1050 | $1,950 | $1.86 | 43d | 1 | 1.43mi |
| 1026 Carolina St Vallejo, CA | 3.0 | 1.0 | 1300 | $2,100 | $1.62 | 43d | 1 | 1.43mi |
| 1201 Glen Cove Pkwy Vallejo, CA | 2.0 | 2.0 | 1038 | $2,150 | $2.07 | 43d | 2 | 1.46mi |
| 1201 Glen Cove Pkwy Vallejo, CA | 2.0 | 2.0 | 1100 | $2,350 | $2.14 | 23d | 2 | 1.46mi |
| 709 Napa St Vallejo, CA | 3.0 | 1.5 | 1250 | $2,500 | $2.00 | 23d | 1 | 1.47mi |
Listing history 19 events
-
2026-06-18days on market $399,999 Active 94 DOM
-
2026-06-17days on market $399,999 Active 93 DOM
-
2026-06-16days on market $399,999 Active 92 DOM
-
2026-06-15days on market $399,999 Active 91 DOM
-
2026-06-14days on market $399,999 Active 89 DOM
-
2026-06-10days on market $399,999 Active 86 DOM
-
2026-06-09days on market $399,999 Active 85 DOM
-
2026-06-08days on market $399,999 Active 84 DOM
-
2026-06-07days on market $399,999 Active 83 DOM
-
2026-06-05days on market $399,999 Active 80 DOM
-
2026-06-03days on market $399,999 Active 79 DOM
-
2026-06-02days on market $399,999 Active 78 DOM
-
2026-06-01days on market $399,999 Active 77 DOM
-
2026-05-31pricedays on market $399,999 Active 76 DOM
-
2026-05-30days on market $485,000 Active 75 DOM
-
2026-03-16$485,000 Active 749-char remark
Show marketing remark (749 chars)
Fantastic opportunity for a visionary buyer! This Diamond in the Rough could be your Sparkling Gem with a little elbow grease and modernization. This property offers endless opportunity as a possible income producing duplex or as a primary residence with multi-generational intent. Live in the upstairs and finish building out the lower level for mom and pop, or live upstairs and rent out lower level. Lower level entry has separate access on the side of house or back entry from Denton Ct. with off-street parking. Lower level has existing 3 rooms, hallway, kitchen and bathroom. Property has a relatively short distance location to schools, shopping, freeways and waterfront. Let this must-see property welcome you and make your Dream come true!
-
2011-10-19soldstatus $120,000
-
2011-02-23soldstatus $85,000
-
2002-01-04soldstatus $175,000
ⓘ Source: listings_history table (triggers on properties + properties_extension) + one-shot
backfill from property_details.listing_events for pre-trigger history.
Tax reassessment forecast CA · Resets to sale price
- Current annual tax
- $7,134 · $595/mo
- Projected year-2 tax
- $7,134 · $595/mo
- Expected delta
- $0/yr ($0/mo · 0.0%)
ⓘ Screening estimate from a state-policy table — verify with the county assessor before closing.
Climate risk First Street
- Flood 7/10 Severe FEMA zone X (unshaded) · 78% chance over 30 yrs
- Wildfire 1/10 Low
- Heat 4/10 Moderate 7 d/yr ≥93°F today · 14 d/yr by 30 yrs out
- Wind 1/10 Low
- Air quality 9/10 Extreme 16 unhealthy d/yr today · 17 by 30 yrs out
Nearby sold comps map
Loading sold comps map…
Walkable amenities ~0.75 mi
Loading nearby amenities…
Taxation est. · year 1
- Rental income
- $53,652
- − Mortgage interest
- −$22,406
- − Property taxes
- −$7,134
- − Insurance
- −$2,797
- − Repairs & maintenance
- −$4,292
- − Management
- −$4,292
- − Depreciation
- −$11,636
- Taxable income
- $1,094
- Est. tax owed @ 24.0%
- −$262
- After-tax cash flow
- $7,019/yr
For passive investors: Depreciation is non-cash, so a rental often shows a tax loss while cash-flowing — sheltering income. Rental losses are passive: they offset passive income freely, and up to $25,000/yr can offset ordinary (W-2) income if you actively participate and your MAGI is under $100k (phasing out to $0 by $150k); unused losses carry forward. On sale, claimed depreciation is recaptured at up to 25%, and gains may owe capital-gains tax (a 1031 exchange can defer both). Figures are a year-1 estimate at your 24.0% rate — not tax advice; consult a CPA.
Schools (NCES district)
- District
- Vallejo City Unified
- NCES district ID
- 0640740
- Math proficiency
- 20% ▬ 0.00%
- Reading proficiency
- 30% ▬ 0.00%
- Median HH income
- $59,919
- Composite
- 26.02/100
- National rank
- #12743
- State rank
- #1124 of 1400 in CA
Livability — Vallejo
- Score
- 67/100
- State rank
- #304
- US rank
- #10215
Category grades
Schools grade is shown separately in the Schools card above.
Census & demographics
- Census place
- Vallejo, CA
- County
- Solano County · 433,239 people
- City population
- 125,311
- Metro
- Vallejo, CA
- Population (ZIP)
- 58,193
- Household income
- $104,550
- Rent vs Own
- Severe rent burden
- 2021.0
Population outlook (Solano County) Hauer SSP2
- Today (2025)
- 478,685 people
- By 2030
- 497,974 · +4.0%
- By 2040
- 528,515 · +10.4%
- By 2050
- 549,115 · +14.7%
- By 2075
- 587,229 · +22.7%
- By 2100
- 571,378 · +19.4%
Race, ethnicity, and origin ACS 2023
- Neighborhood character
- Highly diverse neighborhood (Simpson 0.79)
- Race & ethnicity
- Asian 28% Hispanic / Latino 24% White 23% Two or more races 17% Black 15%
- Hispanic origin (detail)
- Mexican 17%
- Common ancestry
- Lithuanian 1% Italian 1% Russian 1%
- Foreign-born
- 26% · Canada, China, Vietnam
- Languages at home
- 65% English-only · Tagalog/Filipino 15% Spanish 14% Chinese 2%
Political lean MEDSL · Solano
- 2024 margin
- Strong D (+23.0) · D 60.0% · R 37.1% · Other 2.9%
- 2008→2024 swing
- -5.6pp toward R · 2008: 28.6pp · 2024: 23.0pp
- All cycles
- 2024: D+23.0 2020: D+30.3 2016: D+30.5 2012: D+28.1 2008: D+28.6
Not yet ingested
- Civics
- —
Market trends
- HPI YoY
- ▼ -414.47%
- Current HPI
- 282.9528
- Rent YoY
- ▲ 1.35%
- Metro
- Vallejo, CA
- State GDP YoY
- ▲ 3.21%
- F500 in state
- 116
Industry mix (Fortune 500 HQ in CA)
| Industry | F500 HQs | Revenue |
|---|---|---|
| Technology | 27 | $1,492B |
|
||
| Financial Services | 3 | $174B |
|
||
| Retail | 3 | $44B |
|
||
| Insurance | 3 | $26B |
|
||
| Media / Entertainment | 2 | $115B |
|
||
| Pharmaceuticals / Biotech | 2 | $62B |
|
||
Price history
+177.1% since first listed4 events — show timeline
- 2026-03-16 Listed $485,000 BAREIS
- 2011-10-19 Sold (Public Records) $120,000 Public Records
- 2011-02-23 Sold (Public Records) $85,000 Public Records
- 2002-01-04 Sold (Public Records) $175,000 Public Records
Property tax history
+7.2%/yrLatest (2025): $7,134 · +1.0% YoY. Source: county tax records.
Cash-flow waterfall
monthlySold comps — $/sqft
last 12 mo · ≤1 miLoading sold comps…