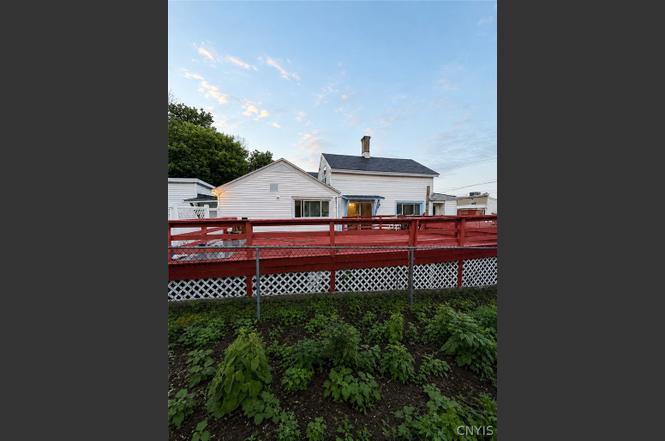
631 South St · Utica, NY
Flood risk 8/10 · Major
- FEMA flood zone
- X (unshaded)
- Chance of flooding over 30 yrs
- 0.99%
- Est. flood insurance / yr
- $473 – $860
Fire risk 3/10 · Minor
- Est. fire insurance / yr
- $691 – $1,283
Heat risk 3/10 · Minor
- Hot days now (above 95°F)
- 8 days/yr
- Hot days in 30 yrs
- 18 days/yr
Wind risk 2/10 · Minimal
- Chance of severe wind over 30 yrs
- 1.0%
Air-quality risk 2/10 · Minimal
- Unhealthy air days now
- 0 days/yr
- Unhealthy air days in 30 yrs
- 1 days/yr
Risk factors via First Street. Map © Google.
Why this score? — see what drove the B- grade
The composite is a weighted blend of 9 inputs, each scored 0–100. Each bar is that input's sub-score; the figure is the points it added to the 100-point composite (weight × sub-score).
- Cash flow +22.5/30.0
- ARV discount +10.0/15.0
- Appreciation +10.0/10.0
- DSCR +7.2/10.0
- 1% rule +5.4/10.0
- Livability +4.0/5.0
- Schools +2.9/10.0
- Rent growth +2.5/5.0
- Condition / age +2.5/5.0
$174,000
🖨 Deal sheet 📄 Offer letter ✓ Due diligence
Key facts
- 5,600 sq ft lot
- 4 garage spots
- Built 1930
Property features AI
Exterior
- Parking: Attached garage; 4-car garage
- Utilities: Public water connected; Sewer connected
- Home design: Single-story property; Vinyl siding; Resale condition
- Construction: Vinyl siding construction; Block foundation; Existing structure
- Exterior features: Blacktop driveway; Near public transit; Rectangular residential lot; City street frontage; Lot dimensions approximately 56 x 100
Interior
- Kitchen: Gas cooktop; Refrigerator
- Bedrooms: 2 bedrooms on the main level
- Flooring: Laminate; Vinyl; Varied flooring
- Bathrooms: 2 full bathrooms (1 on the main level)
- Heating & cooling: Forced-air heating; Electric and gas heating
- Interior features: Eat-in kitchen; Separate formal living room; Combined living/dining area; Bedroom on main level; Full basement
- Laundry & utility: Main-level laundry; Electric and gas water heaters
Neighborhood map
What this means for you Summary
Snapshot
- This is a 3-bed/1.5-bath single-family listed at $174k.
Deal economics
- At list price, monthly cash flow is $237 ($3k/yr) — positive.
- The deal already cash-flows at list — no discount required.
- Meets the 1% rule at list price ($2k rent vs $174k).
Location & tenants
- Location reads 80/100 on livability (#104 in NY, #1,589 nationally) — a professional / high-income tenant draw. Strengths: commute A+, cost of living A+, housing A+; Watch: employment D, schools D-, crime F.
- Utica City School District (urban): math 33% / reading 38% proficiency, ranked #562 of 590 in NY (top 95%) — families likely to look elsewhere, expect single-tenant / working-renter base with shorter leases; 71% free/reduced lunch — lower-income household profile, screen leases tightly.
- Market conditions: 143 active listings in the ZIP; 6 comparable units currently listed for rent nearby; rentals lingering (median 44d on market — plan ~5-8 weeks vacancy on turnover, expect pricing pressure); 100% of comp listings sitting > 30 days — soft ceiling on asking rent; 204 units permitted in Oneida County in 2024 (68 in 5+ unit buildings).
- This rent runs 41% of the median local income ($53k/yr) — at the standard rent-burdened threshold; future hikes will face affordability resistance.
Forward outlook
- In year one you build about $19k of equity ($1k loan paydown + $17k appreciation (10.0% local appreciation)).
- Oneida County population projected at -12% by 2050 — secular population decline; favor cash flow + early exit over multi-decade hold.
- At projected returns (10.0% appreciation + 3.0% rent growth), your $49k cash investment doubles in ~3 years — after that, you're playing with house money.
- By year 3, paydown + projected appreciation supports a ~$47k cash-out refi (75% LTV) — recoverable capital for the next deal without selling this one.
Negotiation context
- Only 4 days on market — expect competitive offers; lowballing is unlikely to land.
- 8 sale attempts since 22y ago with the ask held roughly flat each time — persistent listings suggest the price (not the market) is what's stuck; bring a comps-based counter.
- Current owner paid $140k; 24% above their basis — modest negotiation headroom, anchor on the comps not their cost.
Risks & watch-outs
- Watch-outs: flood insurance adds $56/mo; built in 1930 — expect roof / HVAC / electrical / plumbing capex.
- Climate carrying-cost: severe flood risk — expect insurance premiums to compound above CPI over the hold.
Questions for the listing agent
- Built in 1930 — when were the roof, HVAC, electrical panel, plumbing, and water heater last replaced?
- What's the actual annual flood-insurance premium (NFIP or private), and is the property in a SFHA with mandatory coverage?
- Is there a deadline driving the sale (1031 exchange, divorce, estate, relocation)? That informs how much negotiation room exists.
- Schools are D-rated, which usually means shorter tenancies and higher turnover. Who's the typical renter profile here, and what's been the actual vacancy rate?
- Crime grade is F in this area — have there been break-ins, vandalism, or insurance claims at this property in the last 3 years? What carrier currently insures it and at what premium?
- What's the average days-on-market for RENTAL listings here right now (not sales)? A rising rental-DOM trend means longer vacancies and softer asking-rent achievability than the comps imply.
- What's the recent tenant-quality profile in this submarket — average credit score on applications, eviction rate, late-payment / NSF rate, and stable-employment percentage? A property-management company in the area should have these aggregated.
- How much new for-sale + rental construction is in the pipeline within 1–3 miles? Heavy new supply typically softens prices + rents 12–24 months out; constrained supply supports both.
Investment metrics
- 1% rule
- 1.04% ✓
- Cap rate
- 8.31%
- Cash-on-cash
- 7.20%
- DSCR
- 1.32
- GRM
- 8.0
CMA / ARV
- ARV (on-the-fly)
- $184,320
- Comps found
- 12
Show comp detail 12 sales within ~0.75 mi
| Address | Dist | Beds/Ba | Sqft | Sold | Price | $/sf | Match |
|---|---|---|---|---|---|---|---|
| 1036 Morris St | 0.03mi | 4/2.0 (+1) | 1,504 (+4%) | 11mo | $149,400 | $99 | 75 |
| 1135 Mc Quade Ave | 0.22mi | 4/2.0 (+1) | 1,370 (-5%) | 11mo | $160,000 | $117 | 65 |
| 1204 Neilson St | 0.52mi | 3/1.0 | 1,400 (-3%) | 12mo | $62,000 | $44 | 59 |
| 1129 Hilton Ave | 0.66mi | 4/1.5 (+1) | 1,344 (-7%) | 5mo | $185,400 | $138 | 49 |
| 528 Jefferson Ave | 0.71mi | 4/2.0 (+1) | 1,510 (+5%) | 4mo | $100,000 | $66 | 49 |
| 715 Catherine St | 0.58mi | 4/1.0 (+1) | 1,340 (-7%) | 8mo | $75,000 | $56 | 48 |
| 1105 South St | 0.62mi | 3/1.0 | 1,344 (-7%) | 12mo | $140,000 | $104 | 48 |
| 1525 Saint Vincent St | 0.65mi | 3/1.0 | 1,320 (-8%) | 15mo | $195,700 | $148 | 41 |
| 1155 Jefferson Ave | 0.61mi | 3/2.0 | 1,604 (+11%) | 16mo | $224,900 | $140 | 37 |
| 1130 Hilton Ave | 0.64mi | 3/1.5 | 1,252 (-13%) | 18mo | $160,000 | $128 | 34 |
| 1214 Hillview Dr | 0.65mi | 3/1.0 | 1,248 (-13%) | 14mo | $185,000 | $148 | 33 |
| 906 Arthur St | 0.70mi | 4/1.0 (+1) | 1,248 (-13%) | 13mo | $195,000 | $156 | 27 |
Match score weights: distance 35% · size 25% · config 20% · recency 20%. Top-matched comps best support the ARV.
Projected returns pro-forma
10.0% appreciation · 3.0% rent growth · sell at horizon
- IRR
- 28.5%
- Equity multiple
- 3.26×
- Total profit
- $109,873
- Equity at exit
- $156,753
- IRR
- 24.8%
- Equity multiple
- 7.40×
- Total profit
- $311,747
- Equity at exit
- $338,044
Cash invested: $48,720 (down + closing). Projections, not guarantees.
Landlord ↔ Tenant lean methodology
- Overall (STATE)
- 15 Strongly Tenant-Friendly
- State New York
- 15 Strongly Tenant-Friendly · D+10
- County
- — inherits STATE
- City
- — inherits STATE
ZIP-level market 13501
- Home prices YoY
- 5.6%
- Active inventory
- 143
- Price-to-rent
- 8.0×
Monthly cashflow live
- Estimated rent
- $1,817 high interval (Pro) →
- Mortgage (P&I)
- −$912
- Tax from tax record
- −$158 /mo · $1,895/yr
- Insurance
- −$72
- Flood insurance flood zone
- −$56 /mo · $666/yr
- HOA
- −$0
- Vacancy / Maint / Mgmt
- −$382
- Net cashflow
- $237
Break-even live
UW: 25.0% down · 7.5% · 30yr · 1.5% tax · 5.0% vac · 8.0% maint · 8.0% mgmt
Financing live
Cash to close
- Down payment
- $43,500
- Closing costs
- $5,220
- Reserves months
- —
- Total cash needed
- —
Loan-product check · same deal, 3 products live
Conventional
25% down · 7.5% · 30yr
- Down + closing
- —
- Monthly P&I
- —
- Monthly cashflow
- —
- DSCR
- —
- Eligible?
- —
Personal DTI + credit; lowest rate.
DSCR
20% down · 8.5% · 30yr
- Down + closing
- —
- Monthly P&I
- —
- Monthly cashflow
- —
- DSCR
- —
- Eligible?
- —
No personal income docs; deal must DSCR.
Hard money
10% down · 12.0% · 12mo
- Down + closing
- —
- Monthly P&I
- —
- Monthly cashflow
- —
- DSCR
- —
- Eligible?
- —
Short-term bridge; refi at stabilization.
Rent comps 6 comps
| Address | Beds | Baths | Sqft | Rent | $/sqft | DOM | Units | Dist |
|---|---|---|---|---|---|---|---|---|
| 1124 Dudley Ave Unit 1 Utica, NY | 3.0 | 1.0 | 1300 | $1,400 | $1.08 | 43d | 1 | 0.37mi |
| 807 Eagle St Utica, NY | 3.0 | 1.0 | 1526 | $1,300 | $0.85 | 43d | 1 | 0.39mi |
| 221 Elizabeth St #2 Utica, NY | 2.0 | 1.0 | 1100 | $2,000 | $1.82 | 44d | 1 | 0.63mi |
| 239 Genesee St Utica, NY | 1.0–2.0 | 1.0–2.0 | 1200 | $2,700 | $2.25 | 43d | 15 | 0.76mi |
| 119 Hotel St Utica, NY | 1.0–2.0 | 1.0–2.0 | 1053 | $2,300 | $2.18 | 43d | 14 | 0.82mi |
| 11 Noyes St Unit 4 Utica, NY | 2.0 | 1.0 | 1000 | $1,125 | $1.12 | 43d | 1 | 1.25mi |
Listing history 4 events
-
2026-06-19days on market $174,000 Active 4 DOM
-
2026-06-18days on market $174,000 Active 3 DOM
-
2026-06-17days on market $174,000 Active 2 DOM
-
2026-06-15$174,000 Active 1 DOM
ⓘ Source: listings_history table (triggers on properties + properties_extension) + one-shot
backfill from property_details.listing_events for pre-trigger history.
Tax reassessment forecast NY · Partial reset (capped growth)
- Current annual tax
- $1,895 · $158/mo
- Projected year-2 tax
- $2,418 · $201/mo
- Expected delta
- +$523/yr (+$44/mo · 27.6%)
ⓘ Screening estimate from a state-policy table — verify with the county assessor before closing.
Climate risk First Street
- Flood 8/10 Severe FEMA zone X (unshaded) · 99% chance over 30 yrs
- Wildfire 3/10 Moderate
- Heat 3/10 Moderate 8 d/yr ≥95°F today · 18 d/yr by 30 yrs out
- Wind 2/10 Low 100% chance of damaging wind over 30 yrs
- Air quality 2/10 Low 0 unhealthy d/yr today · 1 by 30 yrs out
Nearby sold comps map
Loading sold comps map…
Walkable amenities ~0.75 mi
Loading nearby amenities…
Taxation est. · year 1
- Rental income
- $21,802
- − Mortgage interest
- −$9,747
- − Property taxes
- −$1,895
- − Insurance
- −$1,536
- − Repairs & maintenance
- −$1,744
- − Management
- −$1,744
- − Depreciation
- −$5,062
- Taxable income
- $73
- Est. tax owed @ 24.0%
- −$18
- After-tax cash flow
- $2,824/yr
For passive investors: Depreciation is non-cash, so a rental often shows a tax loss while cash-flowing — sheltering income. Rental losses are passive: they offset passive income freely, and up to $25,000/yr can offset ordinary (W-2) income if you actively participate and your MAGI is under $100k (phasing out to $0 by $150k); unused losses carry forward. On sale, claimed depreciation is recaptured at up to 25%, and gains may owe capital-gains tax (a 1031 exchange can defer both). Figures are a year-1 estimate at your 24.0% rate — not tax advice; consult a CPA.
Schools (NCES district)
- District
- Utica City School District
- NCES district ID
- 3629370
- Math proficiency
- 33% ▼ -7.00%
- Reading proficiency
- 38% ▲ 2.00%
- Median HH income
- $31,834
- Composite
- 29.01/100
- National rank
- #6613
- State rank
- #562 of 590 in NY
Livability — Utica
- Score
- 80/100
- State rank
- #104
- US rank
- #1589
Category grades
Schools grade is shown separately in the Schools card above.
Census & demographics
- Census place
- Utica, NY
- County
- Oneida County · 89,710 people
- City population
- 72,968
- Metro
- Utica-Rome, NY
- Population (ZIP)
- 38,931
- Household income
- $52,548
- Rent vs Own
- Severe rent burden
- 2251.0
Population outlook (Oneida County) Hauer SSP2
- Today (2025)
- 225,223 people
- By 2030
- 220,384 · -2.1%
- By 2040
- 209,071 · -7.2%
- By 2050
- 197,920 · -12.1%
- By 2075
- 175,541 · -22.1%
- By 2100
- 148,491 · -34.1%
Race, ethnicity, and origin ACS 2023
- Neighborhood character
- Highly diverse neighborhood (Simpson 0.70)
- Race & ethnicity
- White 49% Two or more races 15% Hispanic / Latino 14% Black 14% Asian 14%
- Hispanic origin (detail)
- Puerto Rican 8% Dominican 4%
- Common ancestry
- American 8% Romanian 3% Lithuanian 1%
- Foreign-born
- 25% · Canada, Philippines, Vietnam
- Languages at home
- 62% English-only · Other Asian/Pacific 11% Russian/Polish/Slavic 10% Spanish 9%
Political lean MEDSL · Oneida
- 2024 margin
- Strong R (+21.3) · D 39.4% · R 60.6%
- 2008→2024 swing
- -15.2pp toward R · 2008: -6.1pp · 2024: -21.3pp
- All cycles
- 2024: R+21.3 2020: R+15.5 2016: R+21.1 2012: R+5.3 2008: R+6.1
Not yet ingested
- Civics
- —
Market trends
- HPI YoY
- ▲ 20.28%
- Current HPI
- 382.3726
- Rent YoY
- —
- Metro
- Utica-Rome, NY
- State GDP YoY
- ▲ 2.60%
- F500 in state
- 92
Industry mix (Fortune 500 HQ in NY)
| Industry | F500 HQs | Revenue |
|---|---|---|
| Financial Services | 10 | $950B |
|
||
| Consumer Goods | 9 | $162B |
|
||
| Insurance | 4 | $225B |
|
||
| Telecommunications | 2 | $144B |
|
||
| Pharmaceuticals | 2 | $112B |
|
||
| Media / Entertainment | 2 | $69B |
|
||
Price history
+357.9% since first listed22 events — show timeline
- 2026-06-15 Listed $174,000 CNYIS
- 2024-10-25 Listing Removed — CNYIS
- 2024-10-08 Price Changed $150,000 CNYIS
- 2024-08-05 Listed $170,000 CNYIS
- 2024-06-25 Sold (MLS) $140,000 CNYIS
- 2024-05-07 Pending — CNYIS
- 2024-05-05 Contingent — CNYIS
- 2024-04-11 Price Changed $149,999 CNYIS
- 2024-03-25 Relisted — CNYIS
- 2024-03-19 Contingent — CNYIS
- 2024-03-10 Listed $159,000 CNYIS
- 2022-07-11 Listing Removed — CNYIS
- 2022-06-11 Contingent — CNYIS
- 2022-06-06 Listed $129,900 CNYIS
- 2021-03-24 Sold (Public Records) $75,000 Public Records
- 2021-03-19 Sold (MLS) $75,000 CNYIS
- 2020-10-20 Listed $79,900 CNYIS
- 2019-05-24 Listing Removed — CNYIS
- 2018-09-24 Listed $75,500 CNYIS
- 2004-11-03 Sold (MLS) $29,000 CNYIS
- 2004-09-21 Listed $34,900 CNYIS
- 1999-11-15 Sold (Public Records) $38,000 Public Records
Property tax history
+4.0%/yrLatest (2025): $1,895 · +5.6% YoY. Source: county tax records.
Cash-flow waterfall
monthlySold comps — $/sqft
last 12 mo · ≤1 miLoading sold comps…