 🏗️ New Construction
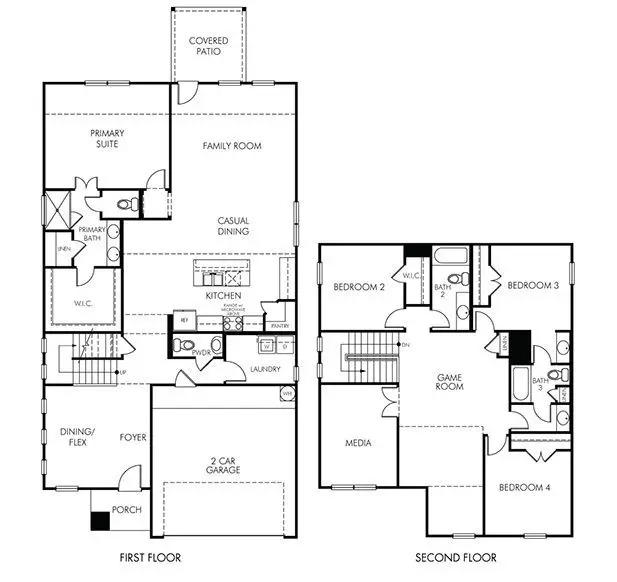
The Texoma (3L08) Plan · Conroe, TX
Flood risk No data
- FEMA flood zone
- —
- Chance of flooding over 30 yrs
- —
- Est. flood insurance / yr
- —
Fire risk No data
- Est. fire insurance / yr
- —
Heat risk No data
- Hot days now (above threshold)
- —
- Hot days in 30 yrs
- —
Wind risk No data
- Chance of severe wind over 30 yrs
- —
Air-quality risk No data
- Unhealthy air days now
- —
- Unhealthy air days in 30 yrs
- —
Risk factors via First Street. Map © Google.
Why this score? — see what drove the F grade
The composite is a weighted blend of 9 inputs, each scored 0–100. Each bar is that input's sub-score; the figure is the points it added to the 100-point composite (weight × sub-score).
- ARV discount +7.5/15.0
- Cash flow +7.3/30.0
- Schools +5.4/10.0
- Livability +3.7/5.0
- Rent growth +2.6/5.0
- Condition / age +2.5/5.0
- 1% rule +2.0/10.0
- DSCR +1.4/10.0
- Appreciation +0.0/10.0
$357,640
🖨 Deal sheet 📄 Offer letter ✓ Due diligence
Listing remarks MLS
Two story with more to adore. A formal dining room flows to the vast kitchen, casual meal spot & family oasis. Upstairs bed, game & media rooms hide from the tranquil downstairs primary suite. Oversized walk-in closet.
Key facts
- Formal dining room
- Vast kitchen
- Upstairs media room
Tags
Neighborhood map
What this means for you Summary
Snapshot
- This is a 4-bed/3.5-bath single-family listed at $358k.
Deal economics
- At list price, monthly cash flow is $-537 ($-6k/yr) — negative.
- To cash-flow at today's rent, offer at most $320k (10.5% below list).
- To meet the 1% rule (rent ≥ 1% of price), the offer needs to be $280k (21.7% below list).
- Recommended offer: $280k (21.7% below list) — sets the bar for 1% rule.
- Cap rate 4.7% vs local median 3.1% in Conroe — top-decile yield for the area; either an underpriced asset or a hidden risk that comps aren't pricing in. Stress-test before assuming the spread holds.
Location & tenants
- Location reads 74/100 on livability (#169 in TX, #4,447 nationally) — a middle-class / working-renter tenant base. Strengths: cost of living A+, housing A+, amenities B; Watch: schools D+, commute F, health & safety F.
- Montgomery ISD (rural): math 63% / reading 57% proficiency, ranked #49 of 826 in TX (top 6%) — acceptable for families but not a draw, mixed tenant base, ~2y average lease.
- Market conditions: Rents flat; 2283 active listings in the ZIP; 4 comparable units currently listed for rent nearby; rentals lingering (median 44d on market — plan ~5-8 weeks vacancy on turnover, expect pricing pressure); 75% of comp listings sitting > 30 days — soft ceiling on asking rent; high-income renter base; 13,259 units permitted in Montgomery County in 2024 (1,402 in 5+ unit buildings).
Forward outlook
- Local home prices are declining (-3.0%/yr); year-one equity from $3k of loan paydown is wiped out by about $12k of value loss. Plan a longer hold.
- Montgomery County population projected at +65% by 2050 — long-run rental-demand tailwind backs the buy-and-hold thesis.
Negotiation context
- It's been on market 127 days — a 12% lower offer ($315k) is reasonable based on typical stale-listing flexibility.
- 4 sale attempts with the ask held roughly flat each time — persistent listings suggest the price (not the market) is what's stuck; bring a comps-based counter.
Questions for the listing agent
- What do current leases actually rent for vs. the listed asking? Can we see a recent rent roll and the last 12 months of T-12 income?
- It's been on market 127 days. Have you received any prior offers? Is the seller open to a 22% concession, seller financing, or rate buy-down credit?
- Why hasn't it sold? Are there any deal-killer items the seller is aware of (foundation, flood, title, zoning, code violations)?
- Is there a deadline driving the sale (1031 exchange, divorce, estate, relocation)? That informs how much negotiation room exists.
- Schools are D-rated, which usually means shorter tenancies and higher turnover. Who's the typical renter profile here, and what's been the actual vacancy rate?
- The area grade is low — what's the realistic commute time and amenity access for the typical tenant pool here? Any planned neighborhood developments (good or bad) we should know about?
- What's the average days-on-market for RENTAL listings here right now (not sales)? A rising rental-DOM trend means longer vacancies and softer asking-rent achievability than the comps imply.
- What's the recent tenant-quality profile in this submarket — average credit score on applications, eviction rate, late-payment / NSF rate, and stable-employment percentage? A property-management company in the area should have these aggregated.
- How much new for-sale + rental construction is in the pipeline within 1–3 miles? Heavy new supply typically softens prices + rents 12–24 months out; constrained supply supports both.
Investment metrics
- 1% rule
- 0.70% ✗
- Cap rate
- 4.67%
- Cash-on-cash
- -5.79%
- DSCR
- 0.74
- GRM
- 11.8
CMA / ARV
- ARV (median comp)
- $397,696
- List price
- $357,640
- Delta
- -10.07%
- Verdict
- UNDERPRICED
- Comps
- 20 within 1.0 mi
Show comp detail 12 sales within ~0.75 mi
| Address | Dist | Beds/Ba | Sqft | Sold | Price | $/sf | Match |
|---|---|---|---|---|---|---|---|
| 17929 Canopy Trace Ct | 0.21mi | 4/3.0 | 2,621 (-4%) | 1mo | $325,000 | $124 | 80 |
| 17718 Hanson Ridge Dr | 0.22mi | 4/3.5 | 2,530 (-8%) | 1mo | $327,500 | $129 | 76 |
| 17732 Mill Manor Dr | 0.34mi | 4/2.5 | 2,636 (-4%) | 0mo | $364,560 | $138 | 74 |
| 124 Bay Bridge Ct | 0.29mi | 5/3.0 (+1) | 2,636 (-4%) | 1mo | $342,260 | $130 | 72 |
| 17779 Mill Manor Dr | 0.46mi | 5/4.0 (+1) | 2,800 (+2%) | 0mo | $351,790 | $126 | 67 |
| 132 Bay Bridge Ct | 0.30mi | 4/2.5 | 2,949 (+8%) | 2mo | $339,110 | $115 | 67 |
| 17796 Mill Manor Dr | 0.50mi | 5/4.0 (+1) | 2,800 (+2%) | 1mo | $329,340 | $118 | 65 |
| 17804 Mill Manor Dr | 0.51mi | 5/4.0 (+1) | 2,800 (+2%) | 2mo | $352,340 | $126 | 64 |
| 216 Raine Manor Ct | 0.34mi | 4/2.5 | 3,001 (+10%) | 2mo | $429,010 | $143 | 62 |
| 17874 Stone Terrace Ln | 0.58mi | 4/3.5 | 2,544 (-7%) | 2mo | $323,190 | $127 | 59 |
| 314 Bayshore Dr | 0.66mi | 3/3.0 (-1) | 2,383 (-13%) | 2mo | $940,000 | $394 | 39 |
| 11 Villas Ways Dr | 0.66mi | 3/2.5 (-1) | 2,336 (-15%) | 1mo | $935,000 | $400 | 35 |
Match score weights: distance 35% · size 25% · config 20% · recency 20%. Top-matched comps best support the ARV.
Projected returns pro-forma
-3.0% appreciation · 0.4% rent growth · sell at horizon
- IRR
- -29.1%
- Equity multiple
- 0.05×
- Total profit
- $-105,733
- Equity at exit
- $59,298
- IRR
- -44.2%
- Equity multiple
- -0.47×
- Total profit
- $-163,734
- Equity at exit
- $34,386
Cash invested: $111,355 (down + closing). Projections, not guarantees.
Landlord ↔ Tenant lean methodology
- Overall (STATE)
- 87 Strongly Landlord-Friendly
- State Texas
- 87 Strongly Landlord-Friendly · R+5
- County
- — inherits STATE
- City
- — inherits STATE
ZIP-level market 77316
- Home prices YoY
- -10.7%
- Rents YoY
- 0.4%
- Active inventory
- 2283
- Price-to-rent
- 10.6×
Monthly cashflow live
- Estimated rent
- $2,799 medium interval (Pro) →
- Mortgage (P&I)
- −$2,086
- Tax est. 1.5%
- −$497 /mo · $5,965/yr
- Insurance
- −$166
- HOA
- −$0
- Vacancy / Maint / Mgmt
- −$588
- Net cashflow
- $-537
Break-even live
UW: 25.0% down · 7.5% · 30yr · 1.5% tax · 5.0% vac · 8.0% maint · 8.0% mgmt
Financing live
Cash to close
- Down payment
- $99,424
- Closing costs
- $11,931
- Reserves months
- —
- Total cash needed
- —
Loan-product check · same deal, 3 products live
Conventional
25% down · 7.5% · 30yr
- Down + closing
- —
- Monthly P&I
- —
- Monthly cashflow
- —
- DSCR
- —
- Eligible?
- —
Personal DTI + credit; lowest rate.
DSCR
20% down · 8.5% · 30yr
- Down + closing
- —
- Monthly P&I
- —
- Monthly cashflow
- —
- DSCR
- —
- Eligible?
- —
No personal income docs; deal must DSCR.
Hard money
10% down · 12.0% · 12mo
- Down + closing
- —
- Monthly P&I
- —
- Monthly cashflow
- —
- DSCR
- —
- Eligible?
- —
Short-term bridge; refi at stabilization.
Rent comps 4 comps
| Address | Beds | Baths | Sqft | Rent | $/sqft | DOM | Units | Dist |
|---|---|---|---|---|---|---|---|---|
| 17685 Martin Creek Ln Montgomery, TX | 4.0 | 3.5 | 3500 | $2,999 | $0.86 | 44d | 1 | 0.06mi |
| 275 Pine Terrace Dr Unit 5106C Montgomery, TX | 3.0 | 2.5 | 1773 | $2,820 | $1.59 | 44d | 1 | 0.31mi |
| 18436 Sunrise Pines Dr Montgomery, TX | 4.0 | 2.5 | 1952 | $2,200 | $1.13 | 44d | 1 | 0.75mi |
| 18490 Sunrise Pines Dr Montgomery, TX | 3.0 | 2.5 | 1976 | $1,731 | $0.88 | 13d | 1 | 0.88mi |
Listing history 27 events
-
2026-06-18days on market $357,640 Active 127 DOM
-
2026-06-16days on market $357,640 Active 126 DOM
-
2026-06-15days on market $357,640 Active 125 DOM
-
2026-06-13days on market $357,640 Active 123 DOM
-
2026-06-13days on market $357,640 Active 122 DOM
-
2026-06-09days on market $357,640 Active 119 DOM
-
2026-06-08days on market $357,640 Active 118 DOM
-
2026-06-07days on market $357,640 Active 117 DOM
-
2026-06-04days on market $357,640 Active 114 DOM
-
2026-06-03pricedays on market $357,640 Active 113 DOM
-
2026-06-02days on market $365,640 Active 112 DOM
-
2026-06-01days on market $365,640 Active 111 DOM
-
2026-05-31days on market $365,640 Active 110 DOM
-
2026-05-02price $365,640 230-char remark
Show marketing remark (230 chars)
Two story with more to adore. A formal dining room flows to the vast kitchen, casual meal spot & family oasis. Upstairs bed, game & media rooms hide from the tranquil downstairs primary suite. Oversized walk-in closet.
-
2026-05-01price $360,990 230-char remark
Show marketing remark (230 chars)
Two story with more to adore. A formal dining room flows to the vast kitchen, casual meal spot & family oasis. Upstairs bed, game & media rooms hide from the tranquil downstairs primary suite. Oversized walk-in closet.
-
2026-04-22price $360,640 230-char remark
Show marketing remark (230 chars)
Two story with more to adore. A formal dining room flows to the vast kitchen, casual meal spot & family oasis. Upstairs bed, game & media rooms hide from the tranquil downstairs primary suite. Oversized walk-in closet.
-
2026-04-08price $358,640 230-char remark
Show marketing remark (230 chars)
Two story with more to adore. A formal dining room flows to the vast kitchen, casual meal spot & family oasis. Upstairs bed, game & media rooms hide from the tranquil downstairs primary suite. Oversized walk-in closet.
-
2026-02-19price $360,990 230-char remark
Show marketing remark (230 chars)
Two story with more to adore. A formal dining room flows to the vast kitchen, casual meal spot & family oasis. Upstairs bed, game & media rooms hide from the tranquil downstairs primary suite. Oversized walk-in closet.
-
2026-02-19status Active 230-char remark
Show marketing remark (230 chars)
Two story with more to adore. A formal dining room flows to the vast kitchen, casual meal spot & family oasis. Upstairs bed, game & media rooms hide from the tranquil downstairs primary suite. Oversized walk-in closet.
-
2026-01-29historical 230-char remark
Show marketing remark (230 chars)
Two story with more to adore. A formal dining room flows to the vast kitchen, casual meal spot & family oasis. Upstairs bed, game & media rooms hide from the tranquil downstairs primary suite. Oversized walk-in closet.
-
2026-01-28status Active 230-char remark
Show marketing remark (230 chars)
Two story with more to adore. A formal dining room flows to the vast kitchen, casual meal spot & family oasis. Upstairs bed, game & media rooms hide from the tranquil downstairs primary suite. Oversized walk-in closet.
-
2026-01-28price $324,590 230-char remark
Show marketing remark (230 chars)
Two story with more to adore. A formal dining room flows to the vast kitchen, casual meal spot & family oasis. Upstairs bed, game & media rooms hide from the tranquil downstairs primary suite. Oversized walk-in closet.
-
2026-01-12historical 230-char remark
Show marketing remark (230 chars)
Two story with more to adore. A formal dining room flows to the vast kitchen, casual meal spot & family oasis. Upstairs bed, game & media rooms hide from the tranquil downstairs primary suite. Oversized walk-in closet.
-
2026-01-11status Active 230-char remark
Show marketing remark (230 chars)
Two story with more to adore. A formal dining room flows to the vast kitchen, casual meal spot & family oasis. Upstairs bed, game & media rooms hide from the tranquil downstairs primary suite. Oversized walk-in closet.
-
2026-01-11price $342,140 230-char remark
Show marketing remark (230 chars)
Two story with more to adore. A formal dining room flows to the vast kitchen, casual meal spot & family oasis. Upstairs bed, game & media rooms hide from the tranquil downstairs primary suite. Oversized walk-in closet.
-
2025-10-30historical 230-char remark
Show marketing remark (230 chars)
Two story with more to adore. A formal dining room flows to the vast kitchen, casual meal spot & family oasis. Upstairs bed, game & media rooms hide from the tranquil downstairs primary suite. Oversized walk-in closet.
-
2025-10-24$353,640 Active 230-char remark
Show marketing remark (230 chars)
Two story with more to adore. A formal dining room flows to the vast kitchen, casual meal spot & family oasis. Upstairs bed, game & media rooms hide from the tranquil downstairs primary suite. Oversized walk-in closet.
ⓘ Source: listings_history table (triggers on properties + properties_extension) + one-shot
backfill from property_details.listing_events for pre-trigger history.
Nearby sold comps map
Loading sold comps map…
Walkable amenities ~0.75 mi
Loading nearby amenities…
Taxation est. · year 1
- Rental income
- $33,593
- − Mortgage interest
- −$22,277
- − Property taxes
- −$5,965
- − Insurance
- −$1,988
- − Repairs & maintenance
- −$2,687
- − Management
- −$2,687
- − Depreciation
- −$11,569
- Taxable loss
- −$13,583
- Est. tax savings @ 24.0%
- +$3,260
- After-tax cash flow
- $-3,183/yr
For passive investors: Depreciation is non-cash, so a rental often shows a tax loss while cash-flowing — sheltering income. Rental losses are passive: they offset passive income freely, and up to $25,000/yr can offset ordinary (W-2) income if you actively participate and your MAGI is under $100k (phasing out to $0 by $150k); unused losses carry forward. On sale, claimed depreciation is recaptured at up to 25%, and gains may owe capital-gains tax (a 1031 exchange can defer both). Figures are a year-1 estimate at your 24.0% rate — not tax advice; consult a CPA.
Schools (NCES district)
- District
- Montgomery ISD
- NCES district ID
- 4831260
- Math proficiency
- 63% ▼ -3.00%
- Reading proficiency
- 57% ▼ -3.00%
- Median HH income
- $75,596
- Composite
- 53.55/100
- National rank
- #1445
- State rank
- #49 of 826 in TX
Livability — Conroe
- Score
- 74/100
- State rank
- #169
- US rank
- #4447
Category grades
Schools grade is shown separately in the Schools card above.
Census & demographics
- Census place
- Conroe, TX
- County
- Montgomery County · 663,713 people
- City population
- 205,417
- Metro
- Houston-The Woodlands-Sugar Land, TX
- Population (ZIP)
- 34,694
- Household income
- $124,055
- Rent vs Own
- Severe rent burden
- 273.0
Population outlook (Montgomery County) Hauer SSP2
- Today (2025)
- 713,896 people
- By 2030
- 805,263 · +12.8%
- By 2040
- 992,708 · +39.1%
- By 2050
- 1,179,590 · +65.2%
- By 2075
- 1,628,084 · +128.1%
- By 2100
- 1,937,880 · +171.5%
Race, ethnicity, and origin ACS 2023
- Neighborhood character
- Predominantly White (80%)
- Race & ethnicity
- White 80% Hispanic / Latino 14% Two or more races 11% Black 1% Asian 1%
- Hispanic origin (detail)
- Mexican 9%
- Common ancestry
- Lithuanian 6% Slovak 3% Romanian 3%
- Foreign-born
- 6% · Canada
- Languages at home
- 90% English-only · Spanish 8%
Political lean MEDSL · Montgomery
- 2024 margin
- Solid R (+45.5) · D 26.8% · R 72.3%
- 2008→2024 swing
- +7.2pp toward D · 2008: -52.7pp · 2024: -45.5pp
- All cycles
- 2024: R+45.5 2020: R+43.8 2016: R+51.4 2012: R+60.7 2008: R+52.7
Not yet ingested
- Civics
- —
Market trends
- HPI YoY
- ▼ -31.44%
- Current HPI
- 262.6973
- Rent YoY
- ▲ 0.40%
- Metro
- Houston-The Woodlands-Sugar Land, TX
- State GDP YoY
- ▲ 3.95%
- F500 in state
- 110
Industry mix (Fortune 500 HQ in TX)
| Industry | F500 HQs | Revenue |
|---|---|---|
| Energy | 16 | $1,198B |
|
||
| Technology | 5 | $198B |
|
||
| Engineering / Construction | 4 | $72B |
|
||
| Energy Services | 3 | $60B |
|
||
| Utilities | 3 | $41B |
|
||
| Healthcare | 2 | $330B |
|
||
Price history
+3.4% since first listed14 events — show timeline
- 2026-05-02 Price Changed $365,640 Zillow
- 2026-05-01 Price Changed $360,990 Zillow
- 2026-04-22 Price Changed $360,640 Zillow
- 2026-04-08 Price Changed $358,640 Zillow
- 2026-02-19 Relisted — Zillow
- 2026-02-19 Price Changed $360,990 Zillow
- 2026-01-29 Delisted — Zillow
- 2026-01-28 Relisted — Zillow
- 2026-01-28 Price Changed $324,590 Zillow
- 2026-01-12 Delisted — Zillow
- 2026-01-11 Relisted — Zillow
- 2026-01-11 Price Changed $342,140 Zillow
- 2025-10-30 Delisted — Zillow
- 2025-10-24 Listed $353,640 Zillow
Cash-flow waterfall
monthlySold comps — $/sqft
last 12 mo · ≤1 miLoading sold comps…