 🏗️ New Construction
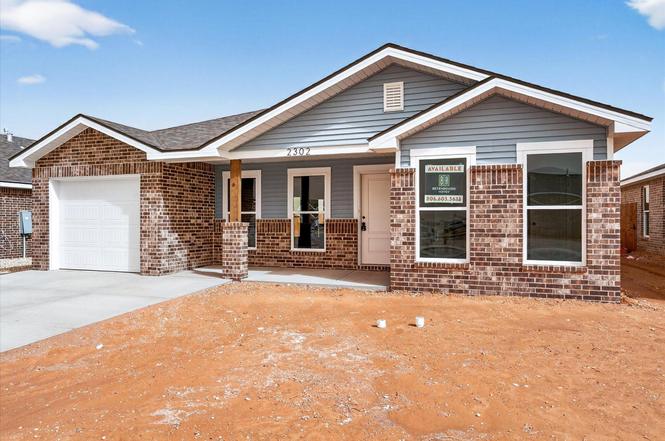
2302 Corpus Ave · Wolfforth, TX
Flood risk 1/10 · Minimal
- FEMA flood zone
- X (unshaded)
- Chance of flooding over 30 yrs
- 0.0%
- Est. flood insurance / yr
- $507 – $1,088
Fire risk 3/10 · Minor
- Est. fire insurance / yr
- $1,222 – $2,270
Heat risk 5/10 · Moderate
- Hot days now (above 99°F)
- 7 days/yr
- Hot days in 30 yrs
- 21 days/yr
Wind risk 2/10 · Minimal
- Chance of severe wind over 30 yrs
- 1.0%
Air-quality risk 2/10 · Minimal
- Unhealthy air days now
- 1 days/yr
- Unhealthy air days in 30 yrs
- 1 days/yr
Risk factors via First Street. Map © Google.
Why this score? — see what drove the C- grade
The composite is a weighted blend of 9 inputs, each scored 0–100. Each bar is that input's sub-score; the figure is the points it added to the 100-point composite (weight × sub-score).
- Cash flow +12.1/30.0
- Appreciation +10.0/10.0
- ARV discount +7.5/15.0
- Schools +4.4/10.0
- Livability +4.0/5.0
- DSCR +3.6/10.0
- 1% rule +3.5/10.0
- Rent growth +2.5/5.0
- Condition / age +2.5/5.0
$187,000
🖨 Deal sheet 📄 Offer letter ✓ Due diligence
Listing remarks
Buy NOW and get up to $7,000 Use-It-Your-Way CASH! This home offers a timeless brick and vinyl exterior with a welcoming covered front entry. Inside, luxury vinyl plank flooring flows through the common areas, leading to an open-concept kitchen and living area. The kitchen boasts granite or quartz countertops, a spacious island with bar seating, stainless steel appliances, and an enclosed pantry for added convenience. Premium plumbing and lighting fixtures elevate the home's style. The secluded master suite features a walk-in closet, creating an idyllic retreat.
Key facts
- Spacious island
- Open-concept kitchen
- Covered front entry
Tags
Neighborhood map
What this means for you Summary
Snapshot
- This is a 3-bed/2.0-bath single-family listed at $187k.
Deal economics
- At list price, monthly cash flow is $-40 ($-480/yr) — negative.
- To cash-flow at today's rent, offer at most $181k (3.1% below list).
- To meet the 1% rule (rent ≥ 1% of price), the offer needs to be $159k (15.2% below list).
- Recommended offer: $159k (15.2% below list) — sets the bar for 1% rule.
Location & tenants
- Location reads 80/100 on livability (#43 in TX, #1,872 nationally) — a professional / high-income tenant draw. Strengths: cost of living A+, housing A+, health & safety A+; Watch: amenities F, commute F.
- Frenship ISD (urban): math 47% / reading 54% proficiency, ranked #162 of 826 in TX (top 20%) — acceptable for families but not a draw, mixed tenant base, ~2y average lease.
- Zoned schools: Upland Heights El (math 49% / reading 55%, grade C-, #742 of 4,322 statewide, top 19%, 840 students, 46% FRL); Frenship Middle (math 46% / reading 50%, grade C-, #400 of 1,662 statewide, top 24%, 833 students, 47% FRL); Frenship H S (math 44% / reading 65%, grade C-, #379 of 1,632 statewide, top 26%, 3,247 students, 46% FRL).
- Market conditions: 472 active listings in the ZIP; 17 comparable units currently listed for rent nearby; rentals lingering (median 44d on market — plan ~5-8 weeks vacancy on turnover, expect pricing pressure); 53% of comp listings sitting > 30 days — soft ceiling on asking rent; solid renter incomes; 2,219 units permitted in Lubbock County in 2024 (252 in 5+ unit buildings).
Forward outlook
- In year one you build about $20k of equity ($1k loan paydown + $19k appreciation (10.0% local appreciation)).
- Lubbock County population projected at +39% by 2050 — long-run rental-demand tailwind backs the buy-and-hold thesis.
- At projected returns (10.0% appreciation + 3.0% rent growth), your $52k cash investment doubles in ~3 years — after that, you're playing with house money.
- By year 2, paydown + projected appreciation supports a ~$32k cash-out refi (75% LTV) — recoverable capital for the next deal without selling this one.
Negotiation context
- It's been on market 27 days — a 2% lower offer ($184k) is reasonable based on typical stale-listing flexibility.
Risks & watch-outs
- Climate carrying-cost: extreme-heat days projected 7→21/yr by 2055 (HVAC capex compounding) — expect insurance premiums to compound above CPI over the hold.
Questions for the listing agent
- What do current leases actually rent for vs. the listed asking? Can we see a recent rent roll and the last 12 months of T-12 income?
- Is there a deadline driving the sale (1031 exchange, divorce, estate, relocation)? That informs how much negotiation room exists.
- Schools are B-rated — typically a magnet for longer-tenancy family renters. What's the average tenant stay here, and is there a school-zone premium baked into asking?
- What's the average days-on-market for RENTAL listings here right now (not sales)? A rising rental-DOM trend means longer vacancies and softer asking-rent achievability than the comps imply.
- What's the recent tenant-quality profile in this submarket — average credit score on applications, eviction rate, late-payment / NSF rate, and stable-employment percentage? A property-management company in the area should have these aggregated.
- How much new for-sale + rental construction is in the pipeline within 1–3 miles? Heavy new supply typically softens prices + rents 12–24 months out; constrained supply supports both.
Investment metrics
- 1% rule
- 0.85% ✗
- Cap rate
- 6.04%
- Cash-on-cash
- -0.92%
- DSCR
- 0.96
- GRM
- 9.8
CMA / ARV
No comps found within radius.
Projected returns pro-forma
10.0% appreciation · 3.0% rent growth · sell at horizon
- IRR
- 23.6%
- Equity multiple
- 2.90×
- Total profit
- $99,319
- Equity at exit
- $168,464
- IRR
- 21.0%
- Equity multiple
- 6.63×
- Total profit
- $294,532
- Equity at exit
- $363,300
Cash invested: $52,360 (down + closing). Projections, not guarantees.
Landlord ↔ Tenant lean methodology
- Overall (STATE)
- 87 Strongly Landlord-Friendly
- State Texas
- 87 Strongly Landlord-Friendly · R+5
- County
- — inherits STATE
- City
- — inherits STATE
ZIP-level market 79382
- Active inventory
- 472
- Price-to-rent
- 9.8×
Monthly cashflow live
- Estimated rent
- $1,585 high interval (Pro) →
- Mortgage (P&I)
- −$981
- Tax est. 1.5%
- −$234 /mo · $2,805/yr
- Insurance
- −$78
- HOA
- −$0
- Vacancy / Maint / Mgmt
- −$333
- Net cashflow
- $-40
Break-even live
UW: 25.0% down · 7.5% · 30yr · 1.5% tax · 5.0% vac · 8.0% maint · 8.0% mgmt
Financing live
Cash to close
- Down payment
- $46,750
- Closing costs
- $5,610
- Reserves months
- —
- Total cash needed
- —
Loan-product check · same deal, 3 products live
Conventional
25% down · 7.5% · 30yr
- Down + closing
- —
- Monthly P&I
- —
- Monthly cashflow
- —
- DSCR
- —
- Eligible?
- —
Personal DTI + credit; lowest rate.
DSCR
20% down · 8.5% · 30yr
- Down + closing
- —
- Monthly P&I
- —
- Monthly cashflow
- —
- DSCR
- —
- Eligible?
- —
No personal income docs; deal must DSCR.
Hard money
10% down · 12.0% · 12mo
- Down + closing
- —
- Monthly P&I
- —
- Monthly cashflow
- —
- DSCR
- —
- Eligible?
- —
Short-term bridge; refi at stabilization.
Rent comps 17 comps
| Address | Beds | Baths | Sqft | Rent | $/sqft | DOM | Units | Dist |
|---|---|---|---|---|---|---|---|---|
| 2008 Cottonwood Ave Wolfforth, TX | 3.0 | 2.0 | 1450 | $1,810 | $1.25 | 43d | 1 | 0.01mi |
| 2304 Corpus Ave Wolfforth, TX | 3.0 | 2.0 | 1316 | $1,425 | $1.08 | 43d | 1 | 0.03mi |
| 1817 Corpus Ave Wolfforth, TX | 3.0 | 2.0 | 1405 | $1,600 | $1.14 | 13d | 1 | 0.06mi |
| 2001 Corpus Ave Unit 2001 B Corpus Wolfforth, TX | 3.0 | 2.0 | 1350 | $1,500 | $1.11 | 21d | 1 | 0.07mi |
| 2001 Corpus Ave Unit B Wolfforth, TX | 3.0 | 2.0 | 1316 | $1,500 | $1.14 | 13d | 1 | 0.07mi |
| 2006 Corpus Ave Unit A Wolfforth, TX | 3.0 | 2.0 | 1223 | $1,425 | $1.17 | 13d | 1 | 0.07mi |
| 2008 Bryan Ave Unit Harvest-2008 A Bryan Wolfforth, TX | 3.0 | 2.0 | 1223 | $1,400 | $1.14 | 43d | 1 | 0.11mi |
| 2001 Bryan Ave Unit B Wolfforth, TX | 3.0 | 2.0 | 1360 | $1,400 | $1.03 | 43d | 1 | 0.12mi |
| 1712 Corpus Ave Wolfforth, TX | 2.0 | 2.0 | 1335 | $1,375 | $1.03 | 43d | 1 | 0.13mi |
| 2011 Bryan Ave Wolfforth, TX | 3.0 | 2.0 | 1350 | $1,450 | $1.07 | 43d | 1 | 0.15mi |
| 2418 Aberdeen Ave Wolfforth, TX | 3.0 | 2.0 | 1450 | $1,799 | $1.24 | 43d | 1 | 0.17mi |
| 407 E 21st St Wolfforth, TX | 3.0 | 2.0 | 1360 | $1,399 | $1.03 | 21d | 1 | 0.17mi |
| 304 E 19th St Wolfforth, TX | 3.0 | 2.0 | 1114 | $1,150 | $1.03 | 13d | 1 | 0.27mi |
| 611 E 14th St Wolfforth, TX | 3.0 | 2.0 | 1299 | $1,725 | $1.33 | 43d | 1 | 0.49mi |
| 127 Brooke Blvd Wolfforth, TX | 3.0 | 2.5 | 1714 | $1,757 | $1.03 | 13d | 2 | 1.07mi |
| 7456 104th St Lubbock, TX | 3.0 | 2.0 | 1460 | $1,700 | $1.16 | 43d | 1 | 1.38mi |
| 7449 104th St Lubbock, TX | 3.0 | 2.0 | 1481 | $1,625 | $1.10 | 21d | 1 | 1.38mi |
Listing history 3 events
-
2026-03-15status Pending
-
2026-03-06price $187,000
-
2026-02-12$194,000 Active
ⓘ Source: listings_history table (triggers on properties + properties_extension) + one-shot
backfill from property_details.listing_events for pre-trigger history.
Climate risk First Street
- Flood 1/10 Low FEMA zone X (unshaded) · 0% chance over 30 yrs
- Wildfire 3/10 Moderate
- Heat 5/10 Major 7 d/yr ≥99°F today · 21 d/yr by 30 yrs out
- Wind 2/10 Low 100% chance of damaging wind over 30 yrs
- Air quality 2/10 Low 1 unhealthy d/yr today · 1 by 30 yrs out
Nearby sold comps map
Loading sold comps map…
Walkable amenities ~0.75 mi
Loading nearby amenities…
Taxation est. · year 1
- Rental income
- $19,022
- − Mortgage interest
- −$10,475
- − Property taxes
- −$2,805
- − Insurance
- −$935
- − Repairs & maintenance
- −$1,522
- − Management
- −$1,522
- − Depreciation
- −$5,440
- Taxable loss
- −$3,676
- Est. tax savings @ 24.0%
- +$882
- After-tax cash flow
- $402/yr
For passive investors: Depreciation is non-cash, so a rental often shows a tax loss while cash-flowing — sheltering income. Rental losses are passive: they offset passive income freely, and up to $25,000/yr can offset ordinary (W-2) income if you actively participate and your MAGI is under $100k (phasing out to $0 by $150k); unused losses carry forward. On sale, claimed depreciation is recaptured at up to 25%, and gains may owe capital-gains tax (a 1031 exchange can defer both). Figures are a year-1 estimate at your 24.0% rate — not tax advice; consult a CPA.
Schools (NCES district)
- District
- Frenship ISD
- NCES district ID
- 4819830
- Math proficiency
- 47% ▼ -8.00%
- Reading proficiency
- 54% ▬ 0.00%
- Median HH income
- $54,376
- Composite
- 43.59/100
- National rank
- #2976
- State rank
- #162 of 826 in TX
Livability — Wolfforth
- Score
- 80/100
- State rank
- #43
- US rank
- #1872
Category grades
Schools grade is shown separately in the Schools card above.
Census & demographics
- Census place
- Wolfforth, TX
- County
- Lubbock County · 293,542 people
- City population
- 10,512
- Metro
- Lubbock, TX
- Population (ZIP)
- 10,512
- Household income
- $84,457
- Rent vs Own
- Severe rent burden
- 135.0
Population outlook (Lubbock County) Hauer SSP2
- Today (2025)
- 345,960 people
- By 2030
- 371,449 · +7.4%
- By 2040
- 424,539 · +22.7%
- By 2050
- 481,150 · +39.1%
- By 2075
- 633,467 · +83.1%
- By 2100
- 746,853 · +115.9%
Race, ethnicity, and origin ACS 2023
- Neighborhood character
- Majority White (64%)
- Race & ethnicity
- White 64% Hispanic / Latino 31% Two or more races 18% Black 1%
- Hispanic origin (detail)
- Mexican 28%
- Common ancestry
- Italian 4% Slovak 2% Lithuanian 2%
- Foreign-born
- 4% · Canada
- Languages at home
- 85% English-only · Spanish 14%
Political lean MEDSL · Lubbock
- 2024 margin
- Solid R (+39.5) · D 29.7% · R 69.2% · Other 1.0%
- 2008→2024 swing
- -2.8pp toward R · 2008: -36.7pp · 2024: -39.5pp
- All cycles
- 2024: R+39.5 2020: R+32.2 2016: R+38.4 2012: R+40.9 2008: R+36.7
Not yet ingested
- Civics
- —
Market trends
- HPI YoY
- ▲ 166.08%
- Current HPI
- 561.4491
- Rent YoY
- —
- Metro
- Lubbock, TX
- State GDP YoY
- ▲ 3.95%
- F500 in state
- 110
Industry mix (Fortune 500 HQ in TX)
| Industry | F500 HQs | Revenue |
|---|---|---|
| Energy | 16 | $1,198B |
|
||
| Technology | 5 | $198B |
|
||
| Engineering / Construction | 4 | $72B |
|
||
| Energy Services | 3 | $60B |
|
||
| Utilities | 3 | $41B |
|
||
| Healthcare | 2 | $330B |
|
||
Price history
-3.6% since first listed3 events — show timeline
- 2026-03-15 Pending — LARMLS
- 2026-03-06 Price Changed $187,000 LARMLS
- 2026-02-12 Listed $194,000 LARMLS
Cash-flow waterfall
monthlySold comps — $/sqft
last 12 mo · ≤1 miLoading sold comps…