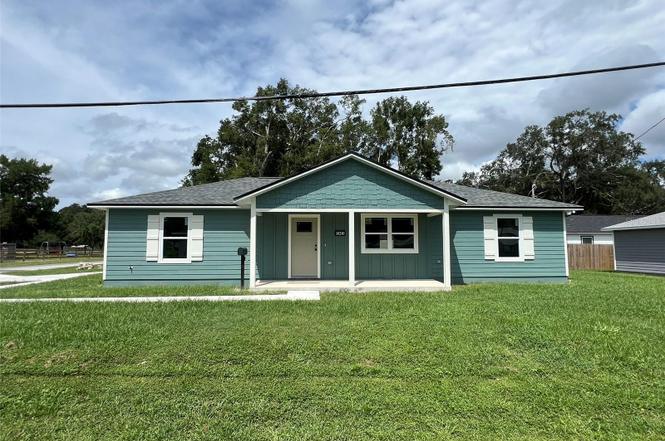
18210 Douglass St · High Springs, FL
Flood risk 1/10 · Minimal
- FEMA flood zone
- X (unshaded)
- Chance of flooding over 30 yrs
- 0.0%
- Est. flood insurance / yr
- $507 – $1,088
Fire risk 5/10 · Moderate
- Est. fire insurance / yr
- $947 – $1,759
Heat risk 8/10 · Major
- Hot days now (above 109°F)
- 7 days/yr
- Hot days in 30 yrs
- 21 days/yr
Wind risk 9/10 · Severe
- Chance of severe wind over 30 yrs
- 99.0%
Air-quality risk 4/10 · Minor
- Unhealthy air days now
- 4 days/yr
- Unhealthy air days in 30 yrs
- 5 days/yr
Risk factors via First Street. Map © Google.
Why this score? — see what drove the D+ grade
The composite is a weighted blend of 9 inputs, each scored 0–100. Each bar is that input's sub-score; the figure is the points it added to the 100-point composite (weight × sub-score).
- Cash flow +17.7/30.0
- ARV discount +7.5/15.0
- DSCR +5.5/10.0
- 1% rule +4.8/10.0
- Schools +4.3/10.0
- Livability +3.4/5.0
- Rent growth +2.5/5.0
- Condition / age +2.5/5.0
- Appreciation +0.0/10.0
$260,000
🖨 Deal sheet 📄 Offer letter ✓ Due diligence
Listing remarks
Under contract-accepting backup offers. Experience quality craftsmanship and peace of mind in this NEW CONSTRUCTION home! This 4 bedroom/2 bath home is located on a corner lot across from Catherine Taylor Park and the newly renovated Douglass Community Center. With vaulted ceilings and an open floor plan you’ll enjoy lots of natural lighting throughout the large great room and living space. Highlighted finishes include a kitchen island with counter seating, dining area, luxury vinyl plank, ceramic tile, wood cabinets, stone tops and stainless-steel appliances. Conveniently located just under a mile from downtown High Springs & Main Street or jump on I-75 for an easy commute to G
Key facts
- New construction
- Luxury vinyl plank
- Ceramic tile
Tags
Property features AI
Finance
- Other: Property zoning: R3; Lot size about 0.1 acre; Living area reported at 1,300 sq ft (builder source); Building area reported at 1,400 sq ft; Corner lot permit: 23-000130
- Financial info: No lease restrictions
- HOA & community: No HOA/association indicated
Exterior
- Parking: Driveway
- Security: Security lights
- Utilities: Public water; Public sewer; Broadband/high-speed internet available; Cable available; Electricity connected; Phone available; Water connected; Sewer connected
- Home design: Single-family residence; One story; New construction; Faces east; Completed condition
- Construction: Frame construction; Shingle roof; Slab foundation; Built by Fla. Homes, Inc. (model: St. Johns II)
- Exterior features: Covered front porch; Exterior lighting; Corner lot; Asphalt road, public maintained
Interior
- Kitchen: Dishwasher; Microwave; Range; Refrigerator; Exhaust fan; Electric water heater
- Bedrooms: 4 bedrooms
- Flooring: Carpet; Ceramic tile
- Bathrooms: 2 full bathrooms
- Heating & cooling: Electric heat; Heat pump; Central air
- Interior features: Cathedral ceilings; Ceiling fans; Eat-in kitchen; High ceilings; Open floor plan; Solid wood cabinets; Split bedroom layout; Stone countertops; Thermostat; Blinds
- Laundry & utility: Inside laundry room with washer and electric dryer hookups; Inside utility / great room
Neighborhood map
What this means for you Summary
Snapshot
- This is a 4-bed/2.0-bath land listed at $260k.
Deal economics
- At list price, monthly cash flow is $209 ($3k/yr) — positive.
- The deal already cash-flows at list — no discount required.
- To meet the 1% rule (rent ≥ 1% of price), the offer needs to be $254k (2.3% below list).
- Recommended offer: $229k (12.0% below list) — sets the bar for market timing.
- Cap rate 7.3% vs local median 4.0% in High Springs — top-decile yield for the area; either an underpriced asset or a hidden risk that comps aren't pricing in. Stress-test before assuming the spread holds.
Location & tenants
- Location reads 68/100 on livability (#506 in FL) — a middle-class / working-renter tenant base. Strengths: cost of living A+, housing A+, crime B+; Watch: health & safety D, amenities F, commute F.
- Alachua (urban): math 49% / reading 54% proficiency, ranked #30 of 73 in FL (top 41%) — acceptable for families but not a draw, mixed tenant base, ~2y average lease.
- Zoned schools: High Springs Community School (math 68% / reading 60%, grade B, #552 of 2,144 statewide, top 26%, 974 students, 45% FRL); Santa Fe High School (math 35% / reading 56%, grade D-, #223 of 667 statewide, top 34%, 1,154 students, 47% FRL) — zoned schools at 46% FRL track the district average.
- Market conditions: 189 active listings in the ZIP; solid renter incomes; 1,774 units permitted in Alachua County in 2024 (984 in 5+ unit buildings).
- This rent runs 37% of the median local income ($83k/yr) — at the standard rent-burdened threshold; future hikes will face affordability resistance.
Forward outlook
- Local home prices are declining (-3.0%/yr); year-one equity from $2k of loan paydown is wiped out by about $8k of value loss. Plan a longer hold.
- Alachua County population projected at +26% by 2050 — long-run rental-demand tailwind backs the buy-and-hold thesis.
Negotiation context
- It's been on market 306 days — a 12% lower offer ($229k) is reasonable based on typical stale-listing flexibility.
- 2 sale attempts with the ask held roughly flat each time — persistent listings suggest the price (not the market) is what's stuck; bring a comps-based counter.
Risks & watch-outs
- Climate carrying-cost: severe wind risk, 99% chance of damaging wind over 30y; moderate wildfire risk; extreme-heat days projected 7→21/yr by 2055 (HVAC capex compounding) — expect insurance premiums to compound above CPI over the hold.
Questions for the listing agent
- It's been on market 306 days. Have you received any prior offers? Is the seller open to a 12% concession, seller financing, or rate buy-down credit?
- Why hasn't it sold? Are there any deal-killer items the seller is aware of (foundation, flood, title, zoning, code violations)?
- Is there a deadline driving the sale (1031 exchange, divorce, estate, relocation)? That informs how much negotiation room exists.
- Schools are B-rated — typically a magnet for longer-tenancy family renters. What's the average tenant stay here, and is there a school-zone premium baked into asking?
- The area grade is low — what's the realistic commute time and amenity access for the typical tenant pool here? Any planned neighborhood developments (good or bad) we should know about?
- What's the average days-on-market for RENTAL listings here right now (not sales)? A rising rental-DOM trend means longer vacancies and softer asking-rent achievability than the comps imply.
- What's the recent tenant-quality profile in this submarket — average credit score on applications, eviction rate, late-payment / NSF rate, and stable-employment percentage? A property-management company in the area should have these aggregated.
- How much new for-sale + rental construction is in the pipeline within 1–3 miles? Heavy new supply typically softens prices + rents 12–24 months out; constrained supply supports both.
Investment metrics
- 1% rule
- 0.98% ✗
- Cap rate
- 7.26%
- Cash-on-cash
- 3.45%
- DSCR
- 1.15
- GRM
- 8.5
CMA / ARV
No comps found within radius.
Projected returns pro-forma
-3.0% appreciation · 3.0% rent growth · sell at horizon
- IRR
- -10.9%
- Equity multiple
- 0.60×
- Total profit
- $-28,769
- Equity at exit
- $38,767
- IRR
- -1.6%
- Equity multiple
- 0.89×
- Total profit
- $-7,739
- Equity at exit
- $22,480
Cash invested: $72,800 (down + closing). Projections, not guarantees.
Landlord ↔ Tenant lean methodology
- Overall (STATE)
- 87 Strongly Landlord-Friendly
- State Florida
- 87 Strongly Landlord-Friendly · R+3
- County
- — inherits STATE
- City
- — inherits STATE
ZIP-level market 32643
- Home prices YoY
- -5.5%
- Active inventory
- 189
- Price-to-rent
- 8.5×
Monthly cashflow live
- Estimated rent
- $2,539 medium interval (Pro) →
- Mortgage (P&I)
- −$1,363
- Tax est. 1.5%
- −$325 /mo · $3,900/yr
- Insurance
- −$108
- HOA
- −$0
- Vacancy / Maint / Mgmt
- −$533
- Net cashflow
- $209
Break-even live
UW: 25.0% down · 7.5% · 30yr · 1.5% tax · 5.0% vac · 8.0% maint · 8.0% mgmt
Financing live
Cash to close
- Down payment
- $65,000
- Closing costs
- $7,800
- Reserves months
- —
- Total cash needed
- —
Loan-product check · same deal, 3 products live
Conventional
25% down · 7.5% · 30yr
- Down + closing
- —
- Monthly P&I
- —
- Monthly cashflow
- —
- DSCR
- —
- Eligible?
- —
Personal DTI + credit; lowest rate.
DSCR
20% down · 8.5% · 30yr
- Down + closing
- —
- Monthly P&I
- —
- Monthly cashflow
- —
- DSCR
- —
- Eligible?
- —
No personal income docs; deal must DSCR.
Hard money
10% down · 12.0% · 12mo
- Down + closing
- —
- Monthly P&I
- —
- Monthly cashflow
- —
- DSCR
- —
- Eligible?
- —
Short-term bridge; refi at stabilization.
Listing history 5 events
-
2026-05-05status Pending
-
2026-04-03status Active
-
2026-03-26status Pending
-
2026-03-13price $260,000
-
2025-06-25$265,000 Active
ⓘ Source: listings_history table (triggers on properties + properties_extension) + one-shot
backfill from property_details.listing_events for pre-trigger history.
Climate risk First Street
- Flood 1/10 Low FEMA zone X (unshaded) · 0% chance over 30 yrs
- Wildfire 5/10 Major
- Heat 8/10 Severe 7 d/yr ≥109°F today · 21 d/yr by 30 yrs out
- Wind 9/10 Extreme 99% chance of damaging wind over 30 yrs
- Air quality 4/10 Moderate 4 unhealthy d/yr today · 5 by 30 yrs out
Nearby sold comps map
Loading sold comps map…
Walkable amenities ~0.75 mi
Loading nearby amenities…
Taxation est. · year 1
- Rental income
- $30,471
- − Mortgage interest
- −$14,564
- − Property taxes
- −$3,900
- − Insurance
- −$1,300
- − Repairs & maintenance
- −$2,438
- − Management
- −$2,438
- − Depreciation
- −$7,564
- Taxable loss
- −$1,732
- Est. tax savings @ 24.0%
- +$416
- After-tax cash flow
- $2,926/yr
For passive investors: Depreciation is non-cash, so a rental often shows a tax loss while cash-flowing — sheltering income. Rental losses are passive: they offset passive income freely, and up to $25,000/yr can offset ordinary (W-2) income if you actively participate and your MAGI is under $100k (phasing out to $0 by $150k); unused losses carry forward. On sale, claimed depreciation is recaptured at up to 25%, and gains may owe capital-gains tax (a 1031 exchange can defer both). Figures are a year-1 estimate at your 24.0% rate — not tax advice; consult a CPA.
Schools (NCES district)
- District
- Alachua
- NCES district ID
- 1200030
- Math proficiency
- 49% ▼ -9.00%
- Reading proficiency
- 54% ▼ -3.00%
- Median HH income
- $42,683
- Composite
- 43.31/100
- National rank
- #3038
- State rank
- #30 of 73 in FL
Livability — High Springs
- Score
- 68/100
- State rank
- #506
- US rank
- #9346
Category grades
Schools grade is shown separately in the Schools card above.
Census & demographics
- Census place
- High Springs, FL
- County
- Alachua County · 218,005 people
- City population
- 11,953
- Metro
- Gainesville, FL
- Population (ZIP)
- 11,953
- Household income
- $83,386
- Rent vs Own
- Severe rent burden
- 150.0
Population outlook (Alachua County) Hauer SSP2
- Today (2025)
- 289,834 people
- By 2030
- 305,873 · +5.5%
- By 2040
- 335,246 · +15.7%
- By 2050
- 364,719 · +25.8%
- By 2075
- 436,665 · +50.7%
- By 2100
- 482,920 · +66.6%
Race, ethnicity, and origin ACS 2023
- Neighborhood character
- Predominantly White (77%)
- Race & ethnicity
- White 77% Black 11% Hispanic / Latino 8% Two or more races 5%
- Hispanic origin (detail)
- Mexican 1% Cuban 1%
- Common ancestry
- Slovak 5% Italian 3% Lithuanian 3%
- Foreign-born
- 3% · Canada
- Languages at home
- 94% English-only · Spanish 4% Other Indo-European 1% Other Asian/Pacific 1%
Political lean MEDSL · Alachua
- 2024 margin
- Strong D (+21.0) · D 59.7% · R 38.8% · Other 1.5%
- 2008→2024 swing
- -0.6pp no change · 2008: 21.6pp · 2024: 21.0pp
- All cycles
- 2024: D+21.0 2020: D+27.2 2016: D+22.5 2012: D+17.3 2008: D+21.6
Not yet ingested
- Civics
- —
Market trends
- HPI YoY
- ▼ -18.02%
- Current HPI
- 308.0178
- Rent YoY
- —
- Metro
- Gainesville, FL
- State GDP YoY
- ▲ 3.28%
- F500 in state
- 36
Industry mix (Fortune 500 HQ in FL)
| Industry | F500 HQs | Revenue |
|---|---|---|
| Industrial Technology | 2 | $29B |
|
||
| Insurance | 2 | $17B |
|
||
| Retail | 1 | $60B |
|
||
| Technology Distribution | 1 | $58B |
|
||
| Homebuilding | 1 | $35B |
|
||
| Technology Manufacturing | 1 | $35B |
|
||
Price history
-1.9% since first listed5 events — show timeline
- 2026-05-05 Pending — Stellar MLS as Distributed by MLS Grid
- 2026-04-03 Relisted — Stellar MLS as Distributed by MLS Grid
- 2026-03-26 Pending — Stellar MLS as Distributed by MLS Grid
- 2026-03-13 Price Changed $260,000 Stellar MLS as Distributed by MLS Grid
- 2025-06-25 Listed $265,000 Stellar MLS as Distributed by MLS Grid
Property tax history
+10.9%/yrLatest (2025): $237 · +32.4% YoY. Source: county tax records.
Cash-flow waterfall
monthlySold comps — $/sqft
last 12 mo · ≤1 miLoading sold comps…