 Duplex
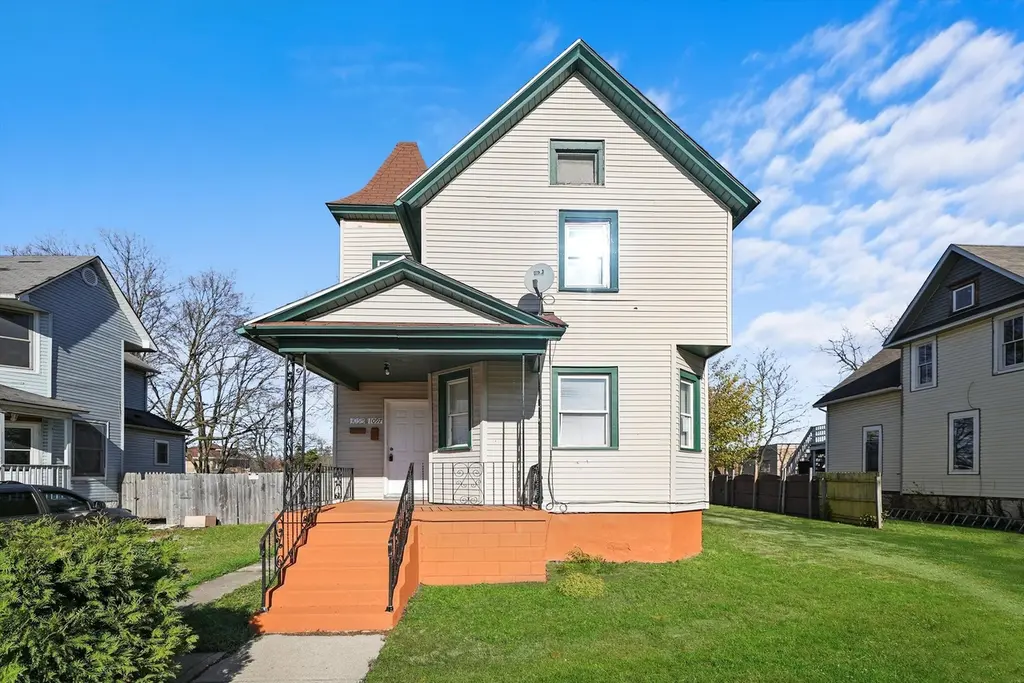
1095-1097 E Merchant St · Kankakee, IL
Flood risk 1/10 · Minimal
- FEMA flood zone
- X (unshaded)
- Chance of flooding over 30 yrs
- 0.0%
- Est. flood insurance / yr
- $473 – $860
Fire risk 1/10 · Minimal
- Est. fire insurance / yr
- $804 – $1,492
Heat risk 3/10 · Minor
- Hot days now (above 105°F)
- 7 days/yr
- Hot days in 30 yrs
- 16 days/yr
Wind risk 2/10 · Minimal
- Chance of severe wind over 30 yrs
- 1.0%
Air-quality risk 2/10 · Minimal
- Unhealthy air days now
- 1 days/yr
- Unhealthy air days in 30 yrs
- 1 days/yr
Risk factors via First Street. Map © Google.
Why this score? — see what drove the B- grade
The composite is a weighted blend of 9 inputs, each scored 0–100. Each bar is that input's sub-score; the figure is the points it added to the 100-point composite (weight × sub-score).
- Cash flow +25.3/30.0
- ARV discount +15.0/15.0
- DSCR +8.4/10.0
- 1% rule +6.6/10.0
- Rent growth +3.6/5.0
- Livability +3.1/5.0
- Condition / age +2.5/5.0
- Schools +0.8/10.0
- Appreciation +0.0/10.0
$195,000
🖨 Deal sheet (PDF) 📄 Offer letter ✓ Due diligence
Multi-family units
County records classify this as Multi-Family (2-4 Unit). Listing-text estimate: 2 units. confirmed
Listing remarks
Fantastic Investment Opportunity in Kankakee! This remodeled 2-unit building is ideal for investors or those seeking a multi-family living option. The property includes a spacious 3-bedroom, 1-bathroom unit and a well-designed 2-bedroom, 1-bathroom unit, both featuring modern finishes and thoughtful upgrades. Each unit is equipped with its own laundry facilities, providing added convenience for residents. Both apartments offer comfortable living spaces with access to front and back porches, making them highly desirable for tenants. A sidewalk leads to a detached 2-car garage, offering plenty of parking and storage options. Conveniently located near local amenities, this property has the pot
Key facts
- Laundry facilities
- Thoughtful upgrades
- Modern finishes
Tags
Property features AI
Finance
- Other: School bus service and commuter bus access; close to interstate access
- Financial info: Property is a two-unit investment: first-floor unit rents for $1,400/month with $2,100 security deposit; second-floor unit currently vacant; Tenants are month-to-month
- HOA & community: No special service area
Exterior
- Parking: Detached garage (2 garage spaces, 2 parking spaces total); Garage owned
- Utilities: Public water; Public sewer; Natural gas heating
- Home design: Two-to-four unit building (2 units total); Over 100 years old; Fee simple ownership
- Construction: Vinyl siding exterior; Asphalt roof; Built before 1978
- Exterior features: Lot roughly 58 x 141; Less than 0.25 acre
Interior
- Kitchen: Both units include stove, refrigerator and microwave
- Bedrooms: Five bedrooms total (three-bedroom unit on first floor; two-bedroom unit on second floor)
- Bathrooms: Two full bathrooms total (one full bath in each unit)
- Interior features: Nine total rooms; Unfinished full basement; Sidewalks, street lights and paved streets in the neighborhood
- Laundry & utility: Tenant pays electric and gas (for each unit)
Neighborhood map
What this means for you Summary
Snapshot
- This is a 2 × 2-bed/1.0-bath units multifamily listed at $195k.
Deal economics
- At list price, monthly cash flow is $445 ($5k/yr) — positive. Per door: $222/mo.
- The deal already cash-flows at list — no discount required.
- Meets the 1% rule at list price ($2k rent vs $195k).
- Recommended offer: $189k (3.0% below list) — sets the bar for market timing.
- Cap rate 9.0% vs local median 5.8% in Kankakee — top-decile yield for the area; either an underpriced asset or a hidden risk that comps aren't pricing in. Stress-test before assuming the spread holds.
Location & tenants
- Location reads 62/100 on livability (#832 in IL) — a middle-class / working-renter tenant base. Strengths: commute A+, cost of living A+, housing A; Watch: schools F, crime F, amenities F.
- Kankakee SD 111 (urban): math 6% / reading 13% proficiency, ranked #584 of 620 in IL (top 94%) — low school quality limits family demand, transient renter base, plan for 1-2y turnover; 78% free/reduced lunch — lower-income household profile, screen leases tightly.
- Market conditions: Rents rising fast (+4.4%/yr); 115 active listings in the ZIP; 5 comparable units currently listed for rent nearby; rentals lingering (median 45d on market — plan ~5-8 weeks vacancy on turnover, expect pricing pressure); 100% of comp listings sitting > 30 days — soft ceiling on asking rent; 145 units permitted in Kankakee County in 2024 (5 in 5+ unit buildings).
- At $2,269/mo this rent would consume 47% of the median local household income ($58k/yr) (locally 1317% of renters already pay >50% of income on rent) — very limited rent-growth headroom before tenants either downsize or default.
Forward outlook
- Local home prices are declining (-3.0%/yr); year-one equity from $1k of loan paydown is wiped out by about $6k of value loss. Plan a longer hold.
- Kankakee County population projected at -19% by 2050 — secular population decline; favor cash flow + early exit over multi-decade hold.
- At projected returns (-3.0% appreciation + 4.4% rent growth), your $55k cash investment doubles in ~10 years — after that, you're playing with house money.
Negotiation context
- It's been on market 46 days — a 3% lower offer ($189k) is reasonable based on typical stale-listing flexibility.
- 7 sale attempts since 23y ago with the ask held roughly flat each time — persistent listings suggest the price (not the market) is what's stuck; bring a comps-based counter.
- Current owner paid $50k; list at $195k implies a 290% gain — meaningful room to come down on a strong offer.
Risks & watch-outs
- Watch-outs: built in 1890 — expect roof / HVAC / electrical / plumbing capex.
Questions for the listing agent
- It's been on market 46 days. Have you received any prior offers? Is the seller open to a 3% concession, seller financing, or rate buy-down credit?
- Can we see the unit-by-unit rent roll, current vacancy, and any below-market leases? What's the average tenancy length?
- What capital expenditures (roof, boiler, parking lot, exteriors) have been made in the last 5 years, and what's planned in the next 2?
- Built in 1890 — when were the roof, HVAC, electrical panel, plumbing, and water heater last replaced?
- Is there a deadline driving the sale (1031 exchange, divorce, estate, relocation)? That informs how much negotiation room exists.
- Schools are F-rated, which usually means shorter tenancies and higher turnover. Who's the typical renter profile here, and what's been the actual vacancy rate?
- Crime grade is F in this area — have there been break-ins, vandalism, or insurance claims at this property in the last 3 years? What carrier currently insures it and at what premium?
- What's the average days-on-market for RENTAL listings here right now (not sales)? A rising rental-DOM trend means longer vacancies and softer asking-rent achievability than the comps imply.
- What's the recent tenant-quality profile in this submarket — average credit score on applications, eviction rate, late-payment / NSF rate, and stable-employment percentage? A property-management company in the area should have these aggregated.
- How much new apartment / multifamily construction is in the pipeline within 1–3 miles? Heavy new supply (>2% of stock underway) typically softens rents 12–24 months out; light construction supports rent growth.
Investment metrics
- 1% rule
- 1.16% ✓
- Cap rate
- 9.03%
- Cash-on-cash
- 9.78%
- DSCR
- 1.44
- GRM
- 7.2
CMA / ARV
- ARV (median comp)
- $286,181
- List price
- $195,000
- Delta
- -31.86%
- Verdict
- UNDERPRICED
- Comps
- 1 within 2.0 mi
Show comp detail 12 sales within ~0.75 mi
| Address | Dist | Beds/Ba | Sqft | Sold | Price | $/sf | Match |
|---|---|---|---|---|---|---|---|
| 1019 E Bourbonnais St | 0.28mi | 4/2.0 | — | 6mo | $100,000 | — | 69 |
| 263 N Wildwood Ave | 0.24mi | 4/2.0 | — | 9mo | $70,000 | — | 69 |
| 229 S Sibley Ave | 0.11mi | 5/3.0 (+1) | — | 6mo | $10,000 | — | 68 |
| 361 S Nelson Ave | 0.38mi | 4/2.0 | — | 4mo | $152,500 | — | 66 |
| 381 S Nelson Ave | 0.38mi | 4/2.0 | — | 4mo | $152,500 | — | 66 |
| 529 S Indiana Ave | 0.58mi | 4/2.0 | — | 1mo | $135,000 | — | 60 |
| 653 E River St | 0.46mi | 3/2.0 (-1) | — | 6mo | $100,000 | — | 56 |
| 464 E Station St | 0.44mi | 4/3.0 | — | 10mo | $120,000 | — | 55 |
| 370 E Court St | 0.49mi | 4/2.5 | — | 14mo | $137,000 | — | 51 |
| 357-359 E Hickory St | 0.54mi | 4/3.0 | — | 11mo | $157,000 | — | 49 |
| 363-365 E Hickory St | 0.53mi | 4/4.0 | — | 8mo | $230,000 | — | 48 |
| 671 N Chicago Ave | 0.66mi | 4/2.0 | — | 12mo | $145,000 | — | 47 |
Match score weights: distance 35% · size 25% · config 20% · recency 20%. Top-matched comps best support the ARV.
Projected returns pro-forma
-3.0% appreciation · 4.38% rent growth · sell at horizon
- IRR
- -0.0%
- Equity multiple
- 1.00×
- Total profit
- $-34
- Equity at exit
- $29,075
- IRR
- 11.0%
- Equity multiple
- 1.92×
- Total profit
- $50,077
- Equity at exit
- $16,860
Cash invested: $54,600 (down + closing). Projections, not guarantees.
Landlord ↔ Tenant lean methodology
- Overall (STATE)
- 43 Moderately Tenant-Leaning
- State Illinois
- 43 Moderately Tenant-Leaning · D+7
- County
- — inherits STATE
- City
- — inherits STATE
ZIP-level market 60901
- Home prices YoY
- -32.5%
- Rents YoY
- 4.4%
- Active inventory
- 115
- Price-to-rent
- 14.3×
Monthly cashflow live
- Estimated rent
- $2,269 high interval (Pro) →
- Mortgage (P&I)
- −$1,023
- Tax est. 1.5%
- −$244 /mo · $2,925/yr
- Insurance
- −$81
- HOA
- −$0
- Vacancy / Maint / Mgmt
- −$476
- Net cashflow
- $445
Break-even live
Sensitivity live
| Price | -10% $580 | -5% $512 | +0% $445 | +5% $378 | +10% $310 |
|---|---|---|---|---|---|
| Rent | -10% $266 | -5% $355 | +0% $445 | +5% $535 | +10% $624 |
| Rate | -1.0pp $543 | -0.5pp $495 | base $445 | +0.5pp $394 | +1.0pp $343 |
2-unit breakdown (identical units grouped — click to expand)
| Units | Beds | Baths | Est. rent |
|---|---|---|---|
| 2× units | 2 | 1 | $2,270 |
| #1 | 2 | 1 | $1,135 |
| #2 | 2 | 1 | $1,135 |
| Total (2 units) | $2,269 | ||
UW: 25.0% down · 7.5% · 30yr · 1.5% tax · 5.0% vac · 8.0% maint · 8.0% mgmt
Financing live
Cash to close
- Down payment
- $48,750
- Closing costs
- $5,850
- Reserves months
- —
- Total cash needed
- —
Loan-product check · same deal, 3 products live
Conventional
25% down · 7.5% · 30yr
- Down + closing
- —
- Monthly P&I
- —
- Monthly cashflow
- —
- DSCR
- —
- Eligible?
- —
Personal DTI + credit; lowest rate.
DSCR
20% down · 8.5% · 30yr
- Down + closing
- —
- Monthly P&I
- —
- Monthly cashflow
- —
- DSCR
- —
- Eligible?
- —
No personal income docs; deal must DSCR.
Hard money
10% down · 12.0% · 12mo
- Down + closing
- —
- Monthly P&I
- —
- Monthly cashflow
- —
- DSCR
- —
- Eligible?
- —
Short-term bridge; refi at stabilization.
Rent comps 5 comps
| Address | Beds | Baths | Sqft | Rent | $/sqft | DOM | Units | Dist |
|---|---|---|---|---|---|---|---|---|
| 294 N Greenwood Ave Unit 1 Kankakee, IL | 3.0 | 1.0 | — | $1,200 | — | 44d | 1 | 0.35mi |
| 744 S Elm Ave Kankakee, IL | 4.0 | 2.0 | 1200 | $1,575 | $1.31 | 44d | 1 | 0.52mi |
| 200 N Crestlane Dr Unit 103 Kankakee, IL | 3.0 | 1.0 | — | $1,338 | — | 44d | 1 | 0.98mi |
| 932 S Washington Ave Kankakee, IL | 4.0 | 1.5 | 2000 | $1,500 | $0.75 | 44d | 1 | 1.05mi |
| 220 Tedmark Ct Unit 4 Kankakee, IL | 3.0 | 1.5 | 500 | $1,200 | $2.40 | 44d | 1 | 1.35mi |
Listing history 33 events
-
2026-06-19days on market $195,000 Active 46 DOM
-
2026-06-18days on market $195,000 Active 45 DOM
-
2026-06-17days on market $195,000 Active 44 DOM
-
2026-06-16days on market $195,000 Active 43 DOM
-
2026-06-15days on market $195,000 Active 42 DOM
-
2026-06-14days on market $195,000 Active 40 DOM
-
2026-06-13days on market $195,000 Active 39 DOM
-
2026-06-10days on market $195,000 Active 37 DOM
-
2026-06-09days on market $195,000 Active 36 DOM
-
2026-06-08days on market $195,000 Active 35 DOM
-
2026-06-07days on market $195,000 Active 34 DOM
-
2026-06-03days on market $195,000 Active 30 DOM
-
2026-06-02days on market $195,000 Active 29 DOM
-
2026-06-01days on market $195,000 Active 28 DOM
-
2026-05-31days on market $195,000 Active 27 DOM
-
2026-05-30days on market $195,000 Active 26 DOM
-
2026-05-04$195,000 Active 874-char remark
-
2025-10-02historical
-
2025-09-03Active
-
2025-04-11historical
-
2024-11-25Active
-
2024-03-08soldstatus $50,000 Closed
-
2024-02-23historical Contingent - Continue to Show
-
2024-02-03status Active
-
2024-01-03status Pending
-
2023-10-17price $65,000
-
2023-07-24price $70,000
-
2023-04-22$79,000 Active
-
2018-10-29historical
-
2018-07-22price
-
2018-02-13New
-
2004-06-11soldstatus $52,000
-
2003-11-23$59,900
ⓘ Source: listings_history table (triggers on properties + properties_extension) + one-shot
backfill from property_details.listing_events for pre-trigger history.
Climate risk First Street
- Flood 1/10 Low FEMA zone X (unshaded) · 0% chance over 30 yrs
- Wildfire 1/10 Low
- Heat 3/10 Moderate 7 d/yr ≥105°F today · 16 d/yr by 30 yrs out
- Wind 2/10 Low 100% chance of damaging wind over 30 yrs
- Air quality 2/10 Low 1 unhealthy d/yr today · 1 by 30 yrs out
Nearby sold comps map
Loading sold comps map…
Walkable amenities ~0.75 mi
Loading nearby amenities…
Taxation est. · year 1
- Rental income
- $27,228
- − Mortgage interest
- −$10,923
- − Property taxes
- −$2,925
- − Insurance
- −$975
- − Repairs & maintenance
- −$2,178
- − Management
- −$2,178
- − Depreciation
- −$5,673
- Taxable income
- $2,376
- Est. tax owed @ 24.0%
- −$570
- After-tax cash flow
- $4,769/yr
For passive investors: Depreciation is non-cash, so a rental often shows a tax loss while cash-flowing — sheltering income. Rental losses are passive: they offset passive income freely, and up to $25,000/yr can offset ordinary (W-2) income if you actively participate and your MAGI is under $100k (phasing out to $0 by $150k); unused losses carry forward. On sale, claimed depreciation is recaptured at up to 25%, and gains may owe capital-gains tax (a 1031 exchange can defer both). Figures are a year-1 estimate at your 24.0% rate — not tax advice; consult a CPA.
Schools (NCES district)
- District
- Kankakee SD 111
- NCES district ID
- 1720760
- Math proficiency
- 6% ▼ -7.00%
- Reading proficiency
- 13% ▼ -6.00%
- Median HH income
- $37,968
- Composite
- 8.03/100
- National rank
- #9921
- State rank
- #584 of 620 in IL
Livability — Kankakee
- Score
- 62/100
- State rank
- #832
- US rank
- #16432
Category grades
Schools grade is shown separately in the Schools card above.
Census & demographics
- Census place
- Kankakee, IL
- County
- Kankakee County · 61,801 people
- City population
- 33,128
- Metro
- Kankakee, IL
- Population (ZIP)
- 33,128
- Household income
- $58,309
- Rent vs Own
- Severe rent burden
- 1317.0
Population outlook (Kankakee County) Hauer SSP2
- Today (2025)
- 105,479 people
- By 2030
- 101,792 · -3.5%
- By 2040
- 93,479 · -11.4%
- By 2050
- 85,061 · -19.4%
- By 2075
- 67,314 · -36.2%
- By 2100
- 52,439 · -50.3%
Race, ethnicity, and origin ACS 2023
- Neighborhood character
- Diverse neighborhood (Simpson 0.65)
- Race & ethnicity
- White 47% Black 30% Hispanic / Latino 19% Two or more races 7%
- Hispanic origin (detail)
- Mexican 16%
- Common ancestry
- Lithuanian 4% Romanian 4% Slovak 1%
- Foreign-born
- 10% · Canada
- Languages at home
- 82% English-only · Spanish 16%
Political lean MEDSL · Kankakee
- 2024 margin
- Strong R (+20.8) · D 38.7% · R 59.5% · Other 1.8%
- 2008→2024 swing
- -25.4pp toward R · 2008: 4.6pp · 2024: -20.8pp
- All cycles
- 2024: R+20.8 2020: R+16.5 2016: R+13.3 2012: R+3.4 2008: D+4.6
Not yet ingested
- Civics
- —
Market trends
- HPI YoY
- ▼ -92.12%
- Current HPI
- 190.8755
- Rent YoY
- ▲ 4.38%
- Metro
- Kankakee, IL
- State GDP YoY
- ▲ 1.59%
- F500 in state
- 60
Industry mix (Fortune 500 HQ in IL)
| Industry | F500 HQs | Revenue |
|---|---|---|
| Insurance | 4 | $201B |
|
||
| Consumer Goods | 4 | $87B |
|
||
| Industrial Machinery | 3 | $64B |
|
||
| Healthcare | 2 | $55B |
|
||
| Retail / Pharmacy | 1 | $148B |
|
||
| Agriculture / Food | 1 | $86B |
|
||
Price history
+225.5% since first listed17 events — show timeline
- 2026-05-04 Listed $195,000 MRED as Distributed by MLS Grid
- 2025-10-02 Listing Removed — MRED as Distributed by MLS Grid
- 2025-09-03 Listed — MRED as Distributed by MLS Grid
- 2025-04-11 Listing Removed — MRED as Distributed by MLS Grid
- 2024-11-25 Listed — MRED as Distributed by MLS Grid
- 2024-03-08 Sold (MLS) $50,000 MRED as Distributed by MLS Grid
- 2024-02-23 Contingent — MRED as Distributed by MLS Grid
- 2024-02-03 Relisted — MRED as Distributed by MLS Grid
- 2024-01-03 Pending — MRED as Distributed by MLS Grid
- 2023-10-17 Price Changed $65,000 MRED as Distributed by MLS Grid
- 2023-07-24 Price Changed $70,000 MRED as Distributed by MLS Grid
- 2023-04-22 Listed $79,000 MRED as Distributed by MLS Grid
- 2018-10-29 Listing Removed — MRED as Distributed by MLS Grid
- 2018-07-22 Price Changed — MRED as Distributed by MLS Grid
- 2018-02-13 Listed — MRED as Distributed by MLS Grid
- 2004-06-11 Sold (MLS) $52,000 MRED as Distributed by MLS Grid
- 2003-11-23 Listed $59,900 MRED as Distributed by MLS Grid
Cash-flow waterfall
monthlySold comps — $/sqft
last 12 mo · ≤1 miLoading sold comps…