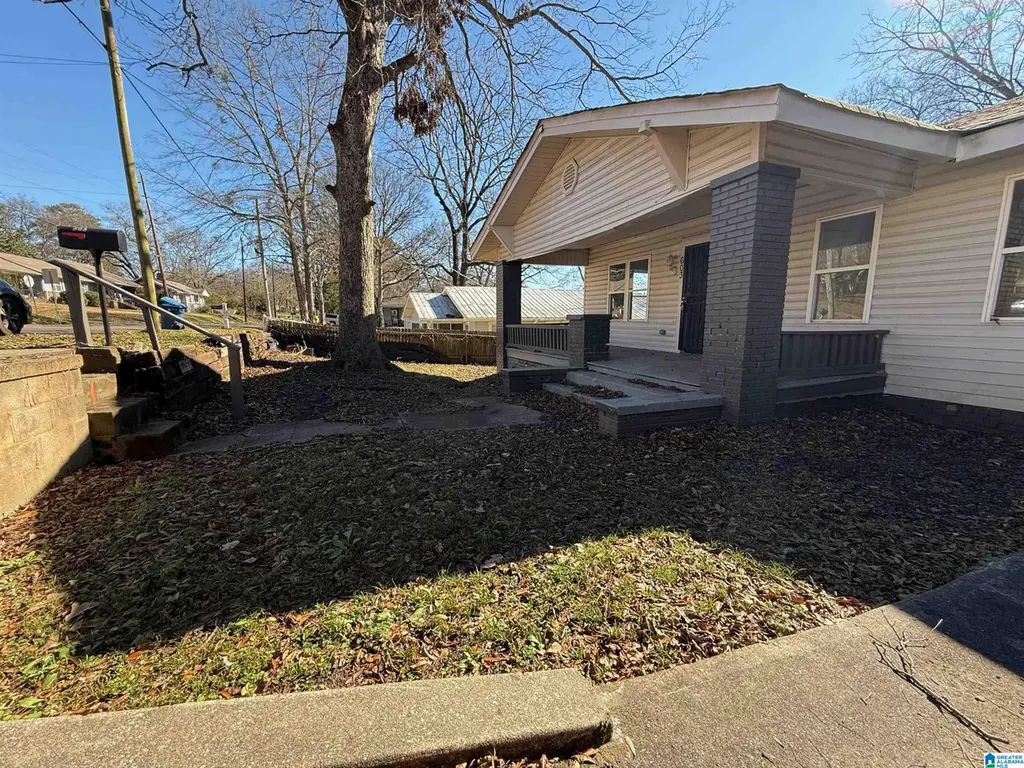
603 12th Ave · Midfield, AL
Flood risk No data
- FEMA flood zone
- —
- Chance of flooding over 30 yrs
- —
- Est. flood insurance / yr
- —
Fire risk No data
- Est. fire insurance / yr
- —
Heat risk No data
- Hot days now (above threshold)
- —
- Hot days in 30 yrs
- —
Wind risk No data
- Chance of severe wind over 30 yrs
- —
Air-quality risk No data
- Unhealthy air days now
- —
- Unhealthy air days in 30 yrs
- —
Risk factors via First Street. Map © Google.
Why this score? — see what drove the C- grade
The composite is a weighted blend of 9 inputs, each scored 0–100. Each bar is that input's sub-score; the figure is the points it added to the 100-point composite (weight × sub-score).
- Cash flow +20.9/30.0
- ARV discount +7.5/15.0
- DSCR +6.7/10.0
- 1% rule +5.0/10.0
- Livability +3.2/5.0
- Appreciation +2.6/10.0
- Condition / age +2.5/5.0
- Rent growth +2.1/5.0
- Schools +0.7/10.0
$104,900
🖨 Deal sheet (PDF) 📄 Offer letter ✓ Due diligence
Listing remarks MLS
Great Investment, recent complete rehab. New AC.
Key facts
- 6,534 sq ft lot
- Built 1945
- Listed 159 days
Neighborhood map
What this means for you Summary
Snapshot
- This is a 2-bed/1.0-bath single-family listed at $105k.
Deal economics
- At list price, monthly cash flow is $146 ($2k/yr) — positive.
- The deal already cash-flows at list — no discount required.
- To meet the 1% rule (rent ≥ 1% of price), the offer needs to be $104k (0.4% below list).
- Recommended offer: $92k (12.0% below list) — sets the bar for market timing.
Location & tenants
- Location reads 64/100 on livability (#164 in AL) — a middle-class / working-renter tenant base. Strengths: commute A+, cost of living A+, housing A+; Watch: amenities F, employment F, health & safety F.
- Midfield City (suburban): math 2% / reading 14% proficiency, ranked #126 of 129 in AL (top 98%) — low school quality limits family demand, transient renter base, plan for 1-2y turnover; 83% free/reduced lunch — lower-income household profile, screen leases tightly.
- Zoned schools: Midfield Elementary School (math 2% / reading 17%, grade F, #568 of 627 statewide, top 94%, 390 students, 84% FRL); Rutledge School (math 0% / reading 15%, grade F, #241 of 257 statewide, top 95%, 315 students, 92% FRL); Midfield High School (math 2% / reading 2%, grade F, #291 of 305 statewide, top 100%, 340 students, 87% FRL).
- Market conditions: Rents soft (-1.5%/yr); 88 active listings in the ZIP; 17 comparable units currently listed for rent nearby; rentals leasing fast (median 13d on market — plan ~1-2 weeks tenant-placement turnaround); 2,114 units permitted in Jefferson County in 2024 (556 in 5+ unit buildings).
Forward outlook
- Local home prices are declining (-3.0%/yr); year-one equity from $725 of loan paydown is wiped out by about $3k of value loss. Plan a longer hold.
- Jefferson County population projected to shrink 4% by 2050 — rents likely to lag national; underwrite the cash flow, not the appreciation.
Negotiation context
- It's been on market 159 days — a 12% lower offer ($92k) is reasonable based on typical stale-listing flexibility.
- 7 sale attempts since 9y ago; this cycle's ask has dropped $32k (23%) from the opening price — seller is motivated, your offer sets the floor, not the list.
Risks & watch-outs
- Watch-outs: built in 1945 — expect roof / HVAC / electrical / plumbing capex.
Questions for the listing agent
- It's been on market 159 days. Have you received any prior offers? Is the seller open to a 12% concession, seller financing, or rate buy-down credit?
- Built in 1945 — when were the roof, HVAC, electrical panel, plumbing, and water heater last replaced?
- Why hasn't it sold? Are there any deal-killer items the seller is aware of (foundation, flood, title, zoning, code violations)?
- Is there a deadline driving the sale (1031 exchange, divorce, estate, relocation)? That informs how much negotiation room exists.
- Schools are F-rated, which usually means shorter tenancies and higher turnover. Who's the typical renter profile here, and what's been the actual vacancy rate?
- What's the average days-on-market for RENTAL listings here right now (not sales)? A rising rental-DOM trend means longer vacancies and softer asking-rent achievability than the comps imply.
- What's the recent tenant-quality profile in this submarket — average credit score on applications, eviction rate, late-payment / NSF rate, and stable-employment percentage? A property-management company in the area should have these aggregated.
- How much new for-sale + rental construction is in the pipeline within 1–3 miles? Heavy new supply typically softens prices + rents 12–24 months out; constrained supply supports both.
Investment metrics
- 1% rule
- 1.00% ✗
- Cap rate
- 7.96%
- Cash-on-cash
- 5.97%
- DSCR
- 1.27
- GRM
- 8.4
CMA / ARV
- ARV (median comp)
- $58,765
- List price
- $104,900
- Delta
- 78.51%
- Verdict
- OVERPRICED
- Comps
- 20 within 1.0 mi
Show comp detail 12 sales within ~0.75 mi
| Address | Dist | Beds/Ba | Sqft | Sold | Price | $/sf | Match |
|---|---|---|---|---|---|---|---|
| 911 12th Ave | 0.31mi | 2/1.0 | 992 (+1%) | 1mo | $26,500 | $27 | 83 |
| 504 9th Ave | 0.40mi | 2/1.0 | 1,016 (+3%) | 1mo | $58,000 | $57 | 75 |
| 907 7th St | 0.31mi | 2/1.0 | 1,044 (+6%) | 11mo | $56,500 | $54 | 66 |
| 800 Rutledge Dr | 0.29mi | 3/1.0 (+1) | 1,028 (+4%) | 11mo | $50,000 | $49 | 64 |
| 600 9th Ave | 0.35mi | 3/1.0 (+1) | 1,028 (+4%) | 10mo | $79,900 | $78 | 62 |
| 1401 Carol Cir | 0.43mi | 3/1.0 (+1) | 1,075 (+9%) | 5mo | $105,000 | $98 | 55 |
| 1589 Carver St | 0.74mi | 3/1.0 (+1) | 957 (-3%) | 5mo | $120,000 | $125 | 52 |
| 1209 8th St | 0.39mi | 3/1.0 (+1) | 912 (-7%) | 15mo | $52,000 | $57 | 52 |
| 808 Alden Ave | 0.64mi | 3/1.0 (+1) | 962 (-2%) | 12mo | $61,900 | $64 | 51 |
| 112 9th St | 0.67mi | 3/1.0 (+1) | 1,026 (+4%) | 14mo | $78,000 | $76 | 45 |
| 713 Westfield Dr | 0.66mi | 3/1.0 (+1) | 1,106 (+12%) | 2mo | $104,000 | $94 | 42 |
| 1446 12th St | 0.53mi | 3/1.0 (+1) | 1,123 (+14%) | 12mo | $80,000 | $71 | 36 |
Match score weights: distance 35% · size 25% · config 20% · recency 20%. Top-matched comps best support the ARV.
Projected returns pro-forma
-3.0% appreciation · 0.0% rent growth · sell at horizon
- IRR
- -10.4%
- Equity multiple
- 0.63×
- Total profit
- $-10,766
- Equity at exit
- $15,641
- IRR
- -5.6%
- Equity multiple
- 0.68×
- Total profit
- $-9,275
- Equity at exit
- $9,070
Cash invested: $29,372 (down + closing). Projections, not guarantees.
Landlord ↔ Tenant lean methodology
- Overall (STATE)
- 90 Strongly Landlord-Friendly
- State Alabama
- 90 Strongly Landlord-Friendly · R+15
- County
- — inherits STATE
- City
- — inherits STATE
ZIP-level market 35228
- Home prices YoY
- -3.5%
- Rents YoY
- -1.5%
- Active inventory
- 88
- Price-to-rent
- 8.4×
Monthly cashflow live
- Estimated rent
- $1,045 high interval (Pro) →
- Mortgage (P&I)
- −$550
- Tax from tax record
- −$86 /mo · $1,026/yr
- Insurance
- −$44
- HOA
- −$0
- Vacancy / Maint / Mgmt
- −$219
- Net cashflow
- $146
Break-even live
Sensitivity live
| Price | -10% $206 | -5% $176 | +0% $146 | +5% $116 | +10% $87 |
|---|---|---|---|---|---|
| Rent | -10% $64 | -5% $105 | +0% $146 | +5% $187 | +10% $229 |
| Rate | -1.0pp $199 | -0.5pp $173 | base $146 | +0.5pp $119 | +1.0pp $91 |
UW: 25.0% down · 7.5% · 30yr · 1.5% tax · 5.0% vac · 8.0% maint · 8.0% mgmt
Financing live
Cash to close
- Down payment
- $26,225
- Closing costs
- $3,147
- Reserves months
- —
- Total cash needed
- —
Loan-product check · same deal, 3 products live
Conventional
25% down · 7.5% · 30yr
- Down + closing
- —
- Monthly P&I
- —
- Monthly cashflow
- —
- DSCR
- —
- Eligible?
- —
Personal DTI + credit; lowest rate.
DSCR
20% down · 8.5% · 30yr
- Down + closing
- —
- Monthly P&I
- —
- Monthly cashflow
- —
- DSCR
- —
- Eligible?
- —
No personal income docs; deal must DSCR.
Hard money
10% down · 12.0% · 12mo
- Down + closing
- —
- Monthly P&I
- —
- Monthly cashflow
- —
- DSCR
- —
- Eligible?
- —
Short-term bridge; refi at stabilization.
Rent comps 17 comps
| Address | Beds | Baths | Sqft | Rent | $/sqft | DOM | Units | Dist |
|---|---|---|---|---|---|---|---|---|
| 605 10th Ave Birmingham, AL | 3.0 | 1.0 | 1060 | $850 | $0.80 | 45d | 1 | 0.38mi |
| 1565 Miles St Dolomite, AL | 3.0 | 2.0 | 1120 | $1,175 | $1.05 | 18d | 1 | 0.90mi |
| 200 Woodward Dr Bessemer, AL | 3.0 | 1.0 | 900 | $1,123 | $1.25 | 4d | 1 | 0.93mi |
| 407 Fairfax Dr Fairfield, AL | 1.0 | 1.5 | 850 | $1,160 | $1.36 | 45d | 2 | 0.99mi |
| 36 Wilkes Cir Birmingham, AL | 2.0 | 1.0 | 762 | $875 | $1.15 | 45d | 1 | 0.99mi |
| 412 Fairfax Dr Unit 424-10 Fairfield, AL | 3.0 | 1.5 | 1035 | $1,275 | $1.23 | 13d | 1 | 1.02mi |
| 412 Fairfax Dr Unit 444-12 Fairfield, AL | 2.0 | 1.0 | 888 | $910 | $1.02 | 12d | 1 | 1.02mi |
| 412 Fairfax Dr Unit 400-1 Fairfield, AL | 2.0 | 1.5 | 935 | $1,175 | $1.26 | 5d | 1 | 1.02mi |
| 412 Fairfax Dr Unit 432-13 Fairfield, AL | 1.0 | 1.0 | 555 | $775 | $1.40 | 12d | 1 | 1.02mi |
| 412 Fairfax Dr Unit 400-12 Fairfield, AL | 2.0 | 1.0 | 888 | $915 | $1.03 | 12d | 1 | 1.02mi |
| 412 Fairfax Dr Unit 416-11 Fairfield, AL | 2.0 | 1.5 | 935 | $975 | $1.04 | 5d | 1 | 1.02mi |
| 412 Fairfax Dr Unit 424-3 Fairfield, AL | 3.0 | 1.5 | 1035 | $1,200 | $1.16 | 12d | 1 | 1.02mi |
| 412 Fairfax Dr Unit 436-11 Fairfield, AL | 2.0 | 1.5 | 935 | $910 | $0.97 | 12d | 1 | 1.02mi |
| 412 Fairfax Dr Unit 436-10 Fairfield, AL | 2.0 | 1.0 | 888 | $890 | $1.00 | 12d | 1 | 1.02mi |
| 216 Pine St Bessemer, AL | 3.0 | 2.0 | 1000 | $1,200 | $1.20 | 45d | 1 | 1.06mi |
| 925 Woodward Rd Birmingham, AL | 2.0 | 2.0 | 1104 | $950 | $0.86 | 45d | 1 | 1.13mi |
| 4506 Letson St Brighton, AL | 3.0 | 2.0 | 1032 | $1,200 | $1.16 | 25d | 1 | 1.19mi |
Listing history 38 events
-
2026-06-22days on market $104,900 Active 159 DOM
-
2026-06-19price $104,900 Active 156 DOM
-
2026-06-18days on market $109,900 Active 156 DOM
-
2026-06-17days on market $109,900 Active 155 DOM
-
2026-06-16days on market $109,900 Active 154 DOM
-
2026-06-15days on market $109,900 Active 153 DOM
-
2026-06-13days on market $109,900 Active 151 DOM
-
2026-06-13days on market $109,900 Active 150 DOM
-
2026-06-10days on market $109,900 Active 148 DOM
-
2026-06-09days on market $109,900 Active 147 DOM
-
2026-06-08days on market $109,900 Active 146 DOM
-
2026-06-07days on market $109,900 Active 145 DOM
-
2026-06-05days on market $109,900 Active 142 DOM
-
2026-06-03days on market $109,900 Active 141 DOM
-
2026-06-02days on market $109,900 Active 140 DOM
-
2026-06-01days on market $109,900 Active 139 DOM
-
2026-05-31days on market $109,900 Active 138 DOM
-
2026-04-30price $115,900 48-char remark
Show marketing remark (48 chars)
Great Investment, recent complete rehab. New AC.
-
2026-04-10price $122,000 48-char remark
Show marketing remark (48 chars)
Great Investment, recent complete rehab. New AC.
-
2026-03-18price $127,000 48-char remark
Show marketing remark (48 chars)
Great Investment, recent complete rehab. New AC.
-
2026-02-19price $132,000 48-char remark
Show marketing remark (48 chars)
Great Investment, recent complete rehab. New AC.
-
2026-01-12$137,000 Active 48-char remark
Show marketing remark (48 chars)
Great Investment, recent complete rehab. New AC.
-
2025-11-08historical $1,250
-
2025-09-04$1,250
-
2025-09-04historical $1,250
-
2025-02-06$1,250
-
2024-12-30soldstatus $92,000 Sold 219-char remark
Show marketing remark (219 chars)
Cash/Conventional. Come check out this one level home with a large, covered porch. Kitchen is equipped with granite counters. Home has newer windows. Three bedrooms, 1 bath. Laundry conveniently located off the kitchen.
-
2024-11-25historical Contingent 219-char remark
Show marketing remark (219 chars)
Cash/Conventional. Come check out this one level home with a large, covered porch. Kitchen is equipped with granite counters. Home has newer windows. Three bedrooms, 1 bath. Laundry conveniently located off the kitchen.
-
2024-11-15price $98,888 219-char remark
Show marketing remark (219 chars)
Cash/Conventional. Come check out this one level home with a large, covered porch. Kitchen is equipped with granite counters. Home has newer windows. Three bedrooms, 1 bath. Laundry conveniently located off the kitchen.
-
2024-10-23$110,000 Active 219-char remark
Show marketing remark (219 chars)
Cash/Conventional. Come check out this one level home with a large, covered porch. Kitchen is equipped with granite counters. Home has newer windows. Three bedrooms, 1 bath. Laundry conveniently located off the kitchen.
-
2023-09-22historical $800
-
2023-09-16price $800
-
2023-09-15$850
-
2022-06-16soldstatus $106,800
-
2017-12-29soldstatus $18,000 Sold
-
2017-11-06status Active
-
2017-10-19historical Contingent
-
2017-10-10$19,800 Active
ⓘ Source: listings_history table (triggers on properties + properties_extension) + one-shot
backfill from property_details.listing_events for pre-trigger history.
Tax reassessment forecast AL · Resets to sale price
- Current annual tax
- $1,026 · $86/mo
- Projected year-2 tax
- $1,026 · $86/mo
- Expected delta
- $0/yr ($0/mo · 0.0%)
ⓘ Screening estimate from a state-policy table — verify with the county assessor before closing.
Nearby sold comps map
Loading sold comps map…
Walkable amenities ~0.75 mi
Loading nearby amenities…
Taxation est. · year 1
- Rental income
- $12,539
- − Mortgage interest
- −$5,876
- − Property taxes
- −$1,026
- − Insurance
- −$524
- − Repairs & maintenance
- −$1,003
- − Management
- −$1,003
- − Depreciation
- −$3,052
- Taxable income
- $54
- Est. tax owed @ 24.0%
- −$13
- After-tax cash flow
- $1,741/yr
For passive investors: Depreciation is non-cash, so a rental often shows a tax loss while cash-flowing — sheltering income. Rental losses are passive: they offset passive income freely, and up to $25,000/yr can offset ordinary (W-2) income if you actively participate and your MAGI is under $100k (phasing out to $0 by $150k); unused losses carry forward. On sale, claimed depreciation is recaptured at up to 25%, and gains may owe capital-gains tax (a 1031 exchange can defer both). Figures are a year-1 estimate at your 24.0% rate — not tax advice; consult a CPA.
Schools (NCES district)
- District
- Midfield City
- NCES district ID
- 0102350
- Math proficiency
- 2% ▼ -18.00%
- Reading proficiency
- 14% ▼ -5.00%
- Median HH income
- $39,267
- Composite
- 6.89/100
- National rank
- #9978
- State rank
- #126 of 129 in AL
Livability — Midfield
- Score
- 64/100
- State rank
- #164
- US rank
- #14536
Category grades
Schools grade is shown separately in the Schools card above.
Census & demographics
- Census place
- Midfield, AL
- County
- Jefferson County · 527,445 people
- City population
- 10,216
- Metro
- Birmingham-Hoover, AL
- Population (ZIP)
- 10,216
- Household income
- $50,815
- Rent vs Own
- Severe rent burden
- 456.0
Population outlook (Jefferson County) Hauer SSP2
- Today (2025)
- 669,185 people
- By 2030
- 669,694 · +0.1%
- By 2040
- 661,388 · -1.2%
- By 2050
- 643,086 · -3.9%
- By 2075
- 577,267 · -13.7%
- By 2100
- 474,758 · -29.1%
Race, ethnicity, and origin ACS 2023
- Neighborhood character
- Predominantly Black (89%)
- Race & ethnicity
- Black 89% Hispanic / Latino 5% Two or more races 5% White 5%
- Foreign-born
- 2% · Canada
- Languages at home
- 95% English-only · Spanish 5%
Political lean MEDSL · Jefferson
- 2024 margin
- D (+10.4) · D 54.6% · R 44.2% · Other 1.2%
- 2008→2024 swing
- +5.4pp toward D · 2008: 5.1pp · 2024: 10.4pp
- All cycles
- 2024: D+10.4 2020: D+13.2 2016: D+7.2 2012: D+6.0 2008: D+5.1
Not yet ingested
- Civics
- —
Market trends
- HPI YoY
- ▼ -4.84%
- Current HPI
- 134.8633
- Rent YoY
- ▼ -1.47%
- Metro
- Birmingham-Hoover, AL
- State GDP YoY
- ▲ 2.94%
- F500 in state
- 4
Industry mix (Fortune 500 HQ in AL)
| Industry | F500 HQs | Revenue |
|---|---|---|
| Financial Services | 1 | $8B |
|
||
| Healthcare | 1 | $5B |
|
||
Price history
+485.4% since first listed21 events — show timeline
- 2026-04-30 Price Changed $115,900 Greater Alabama MLS
- 2026-04-10 Price Changed $122,000 Greater Alabama MLS
- 2026-03-18 Price Changed $127,000 Greater Alabama MLS
- 2026-02-19 Price Changed $132,000 Greater Alabama MLS
- 2026-01-12 Listed $137,000 Greater Alabama MLS
- 2025-11-08 Rental Removed $1,250 TENANTTURNER2
- 2025-09-04 Listed for Rent $1,250 TENANTTURNER2
- 2025-09-04 Rental Removed $1,250 APPFOLIO
- 2025-02-06 Listed for Rent $1,250 APPFOLIO
- 2024-12-30 Sold (MLS) $92,000 Greater Alabama MLS
- 2024-11-25 Contingent — Greater Alabama MLS
- 2024-11-15 Price Changed $98,888 Greater Alabama MLS
- 2024-10-23 Listed $110,000 Greater Alabama MLS
- 2023-09-22 Rental Removed $800 APPFOLIO
- 2023-09-16 Price Changed $800 APPFOLIO
- 2023-09-15 Listed for Rent $850 APPFOLIO
- 2022-06-16 Sold (Public Records) $106,800 Public Records
- 2017-12-29 Sold (MLS) $18,000 Greater Alabama MLS
- 2017-11-06 Relisted — Greater Alabama MLS
- 2017-10-19 Contingent — Greater Alabama MLS
- 2017-10-10 Listed $19,800 Greater Alabama MLS
Property tax history
+2.0%/yrLatest (2025): $1,026 · -13.4% YoY. Source: county tax records.
Cash-flow waterfall
monthlySold comps — $/sqft
last 12 mo · ≤1 miLoading sold comps…