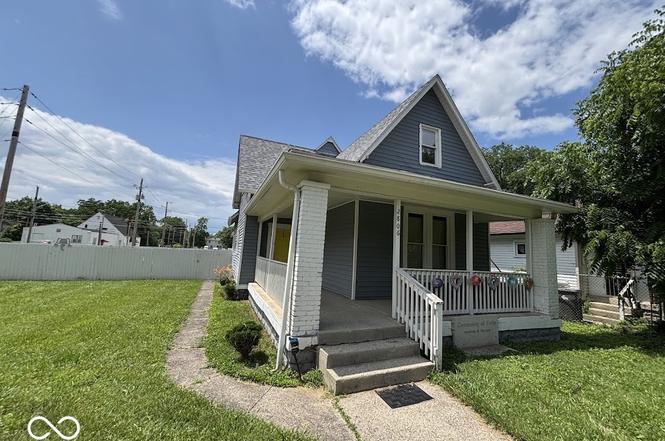
2806 N Denny St · Indianapolis city (balance), IN
Flood risk 1/10 · Minimal
- FEMA flood zone
- X (unshaded)
- Chance of flooding over 30 yrs
- 0.0%
- Est. flood insurance / yr
- $473 – $860
Fire risk 1/10 · Minimal
- Est. fire insurance / yr
- $717 – $1,331
Heat risk 3/10 · Minor
- Hot days now (above 102°F)
- 7 days/yr
- Hot days in 30 yrs
- 18 days/yr
Wind risk 2/10 · Minimal
- Chance of severe wind over 30 yrs
- 0.0%
Air-quality risk 4/10 · Minor
- Unhealthy air days now
- 5 days/yr
- Unhealthy air days in 30 yrs
- 7 days/yr
Risk factors via First Street. Map © Google.
Why this score? — see what drove the B- grade
The composite is a weighted blend of 9 inputs, each scored 0–100. Each bar is that input's sub-score; the figure is the points it added to the 100-point composite (weight × sub-score).
- Cash flow +30.0/30.0
- DSCR +10.0/10.0
- 1% rule +9.4/10.0
- ARV discount +9.2/15.0
- Rent growth +2.7/5.0
- Livability +2.5/5.0
- Condition / age +2.5/5.0
- Schools +1.4/10.0
- Appreciation +0.0/10.0
$110,900
🖨 Deal sheet (PDF) 📄 Offer letter ✓ Due diligence
Listing remarks
Excellent investment opportunity with this home to make it yours however you wish. This amazing opportunity is sold AS-IS.
Key facts
- 0.33 acre lot
- Built 1910
- Listed 208 days
Neighborhood map
What this means for you Summary
Snapshot
- This is a 4-bed/1.0-bath single-family listed at $111k.
Deal economics
- At list price, monthly cash flow is $492 ($6k/yr) — positive.
- The deal already cash-flows at list — no discount required.
- Meets the 1% rule at list price ($2k rent vs $111k).
- Recommended offer: $98k (12.0% below list) — sets the bar for market timing.
- Cap rate 11.6% vs local median 4.4% in Indianapolis city (balance) — top-decile yield for the area; either an underpriced asset or a hidden risk that comps aren't pricing in. Stress-test before assuming the spread holds.
Location & tenants
- Location reads: area grade B — affects rentability + tenant quality, not the cash-flow math above.
- Indianapolis Public Schools (urban): math 14% / reading 20% proficiency, ranked #286 of 301 in IN (top 95%) — low school quality limits family demand, transient renter base, plan for 1-2y turnover; 77% free/reduced lunch — lower-income household profile, screen leases tightly.
- Market conditions: Rents flat; 336 active listings in the ZIP; 3 comparable units currently listed for rent nearby; rentals at typical pace (median 25d on market — plan ~3-4 weeks tenant-placement turnaround); lower-income renter base — watch delinquency; 1,906 units permitted in Marion County in 2024 (621 in 5+ unit buildings).
- At $1,592/mo this rent would consume 50% of the median local household income ($38k/yr) (locally 2340% of renters already pay >50% of income on rent) — very limited rent-growth headroom before tenants either downsize or default.
Forward outlook
- Local home prices are declining (-3.0%/yr); year-one equity from $767 of loan paydown is wiped out by about $3k of value loss. Plan a longer hold.
- Marion County population projected at +18% by 2050 — long-run rental-demand tailwind backs the buy-and-hold thesis.
- At projected returns (-3.0% appreciation + 0.8% rent growth), your $31k cash investment doubles in ~8 years — after that, you're playing with house money.
Negotiation context
- It's been on market 208 days — a 12% lower offer ($98k) is reasonable based on typical stale-listing flexibility.
- 4 sale attempts; this cycle's ask has dropped $59k (35%) from the opening price — seller is motivated, your offer sets the floor, not the list.
Risks & watch-outs
- Watch-outs: built in 1910 — expect roof / HVAC / electrical / plumbing capex.
Questions for the listing agent
- It's been on market 208 days. Have you received any prior offers? Is the seller open to a 12% concession, seller financing, or rate buy-down credit?
- Built in 1910 — when were the roof, HVAC, electrical panel, plumbing, and water heater last replaced?
- Why hasn't it sold? Are there any deal-killer items the seller is aware of (foundation, flood, title, zoning, code violations)?
- Is there a deadline driving the sale (1031 exchange, divorce, estate, relocation)? That informs how much negotiation room exists.
- What's the average days-on-market for RENTAL listings here right now (not sales)? A rising rental-DOM trend means longer vacancies and softer asking-rent achievability than the comps imply.
- What's the recent tenant-quality profile in this submarket — average credit score on applications, eviction rate, late-payment / NSF rate, and stable-employment percentage? A property-management company in the area should have these aggregated.
- How much new for-sale + rental construction is in the pipeline within 1–3 miles? Heavy new supply typically softens prices + rents 12–24 months out; constrained supply supports both.
Investment metrics
- 1% rule
- 1.44% ✓
- Cap rate
- 11.61%
- Cash-on-cash
- 19.00%
- DSCR
- 1.85
- GRM
- 5.8
CMA / ARV
- ARV (on-the-fly)
- $115,244
- Comps found
- 12
Show comp detail 12 sales within ~0.75 mi
| Address | Dist | Beds/Ba | Sqft | Sold | Price | $/sf | Match |
|---|---|---|---|---|---|---|---|
| 2806 N Denny St | 0.00mi | 4/1.5 | 2,454 (+0%) | 1mo | $115,900 | $47 | 97 |
| 2717 Station St | 0.17mi | 5/2.0 (+1) | 2,356 (-4%) | 4mo | $94,900 | $40 | 74 |
| 2429 Adams St | 0.50mi | 4/2.0 | 2,470 (+1%) | 5mo | $80,000 | $32 | 68 |
| 2955 N Olney St | 0.38mi | 3/1.0 (-1) | 2,550 (+4%) | 5mo | $75,000 | $29 | 67 |
| 2950 N Gale St | 0.33mi | 3/2.0 (-1) | 2,368 (-3%) | 7mo | $174,000 | $73 | 64 |
| 2701 N Gale St | 0.26mi | 4/2.0 | 2,745 (+12%) | 3mo | $95,000 | $35 | 61 |
| 2835 N Gale St | 0.24mi | 3/1.0 (-1) | 2,184 (-11%) | 9mo | $101,000 | $46 | 58 |
| 2962 Station St | 0.29mi | 3/1.5 (-1) | 2,216 (-10%) | 13mo | $174,000 | $79 | 52 |
| 2430 Stuart St | 0.48mi | 4/3.0 | 2,676 (+9%) | 4mo | $220,000 | $82 | 51 |
| 3235 Adams St | 0.69mi | 3/2.0 (-1) | 2,152 (-12%) | 2mo | $223,000 | $104 | 37 |
| 2438 N Gale St | 0.37mi | 3/2.0 (-1) | 2,808 (+14%) | 17mo | $204,100 | $73 | 35 |
| 2229 Station St | 0.53mi | 3/2.0 (-1) | 2,172 (-11%) | 16mo | $100,000 | $46 | 34 |
Match score weights: distance 35% · size 25% · config 20% · recency 20%. Top-matched comps best support the ARV.
Projected returns pro-forma
-3.0% appreciation · 0.81% rent growth · sell at horizon
- IRR
- 8.4%
- Equity multiple
- 1.32×
- Total profit
- $9,932
- Equity at exit
- $16,536
- IRR
- 15.7%
- Equity multiple
- 2.15×
- Total profit
- $35,580
- Equity at exit
- $9,589
Cash invested: $31,052 (down + closing). Projections, not guarantees.
Landlord ↔ Tenant lean methodology
- Overall (STATE)
- 90 Strongly Landlord-Friendly
- State Indiana
- 90 Strongly Landlord-Friendly · R+11
- County
- — inherits STATE
- City
- — inherits STATE
ZIP-level market 46218
- Home prices YoY
- -17.1%
- Rents YoY
- 0.8%
- Active inventory
- 336
- Price-to-rent
- 5.8×
Monthly cashflow live
- Estimated rent
- $1,592 medium interval (Pro) →
- Mortgage (P&I)
- −$582
- Tax est. 1.5%
- −$139 /mo · $1,664/yr
- Insurance
- −$46
- HOA
- −$0
- Vacancy / Maint / Mgmt
- −$334
- Net cashflow
- $492
Break-even live
Sensitivity live
| Price | -10% $568 | -5% $530 | +0% $492 | +5% $453 | +10% $415 |
|---|---|---|---|---|---|
| Rent | -10% $366 | -5% $429 | +0% $492 | +5% $555 | +10% $617 |
| Rate | -1.0pp $547 | -0.5pp $520 | base $492 | +0.5pp $463 | +1.0pp $434 |
UW: 25.0% down · 7.5% · 30yr · 1.5% tax · 5.0% vac · 8.0% maint · 8.0% mgmt
Financing live
Cash to close
- Down payment
- $27,725
- Closing costs
- $3,327
- Reserves months
- —
- Total cash needed
- —
Loan-product check · same deal, 3 products live
Conventional
25% down · 7.5% · 30yr
- Down + closing
- —
- Monthly P&I
- —
- Monthly cashflow
- —
- DSCR
- —
- Eligible?
- —
Personal DTI + credit; lowest rate.
DSCR
20% down · 8.5% · 30yr
- Down + closing
- —
- Monthly P&I
- —
- Monthly cashflow
- —
- DSCR
- —
- Eligible?
- —
No personal income docs; deal must DSCR.
Hard money
10% down · 12.0% · 12mo
- Down + closing
- —
- Monthly P&I
- —
- Monthly cashflow
- —
- DSCR
- —
- Eligible?
- —
Short-term bridge; refi at stabilization.
Rent comps 3 comps
| Address | Beds | Baths | Sqft | Rent | $/sqft | DOM | Units | Dist |
|---|---|---|---|---|---|---|---|---|
| 1927 N Dearborn St Indianapolis, IN | 3.0 | 1.0 | 2182 | $1,495 | $0.69 | 45d | 1 | 1.10mi |
| 3615 Sherman Forest Dr Indianapolis, IN | 4.0 | 1.0–2.5 | 1057 | $1,800 | $1.70 | 5d | 1 | 1.37mi |
| 3707 N Riley Ave Indianapolis, IN | 3.0 | 1.5 | 2016 | $1,500 | $0.74 | 24d | 1 | 1.41mi |
Listing history 17 events
-
2026-04-16status Pending
-
2026-04-07price $110,900
-
2026-03-17price $115,900
-
2026-03-12status Active
-
2026-03-04historical
-
2026-02-26price $121,900
-
2026-02-10price $126,900
-
2026-01-22price $133,500
-
2026-01-05price $140,500
-
2025-12-11status Active
-
2025-12-03status Pending
-
2025-11-19price $148,000
-
2025-10-29price $155,900
-
2025-09-16price $162,900
-
2025-09-04$169,900 Active
-
2025-06-24historical
-
2025-04-27$145,000 Active
ⓘ Source: listings_history table (triggers on properties + properties_extension) + one-shot
backfill from property_details.listing_events for pre-trigger history.
Climate risk First Street
- Flood 1/10 Low FEMA zone X (unshaded) · 0% chance over 30 yrs
- Wildfire 1/10 Low
- Heat 3/10 Moderate 7 d/yr ≥102°F today · 18 d/yr by 30 yrs out
- Wind 2/10 Low 0% chance of damaging wind over 30 yrs
- Air quality 4/10 Moderate 5 unhealthy d/yr today · 7 by 30 yrs out
Nearby sold comps map
Loading sold comps map…
Walkable amenities ~0.75 mi
Loading nearby amenities…
Taxation est. · year 1
- Rental income
- $19,109
- − Mortgage interest
- −$6,212
- − Property taxes
- −$1,664
- − Insurance
- −$554
- − Repairs & maintenance
- −$1,529
- − Management
- −$1,529
- − Depreciation
- −$3,226
- Taxable income
- $4,396
- Est. tax owed @ 24.0%
- −$1,055
- After-tax cash flow
- $4,845/yr
For passive investors: Depreciation is non-cash, so a rental often shows a tax loss while cash-flowing — sheltering income. Rental losses are passive: they offset passive income freely, and up to $25,000/yr can offset ordinary (W-2) income if you actively participate and your MAGI is under $100k (phasing out to $0 by $150k); unused losses carry forward. On sale, claimed depreciation is recaptured at up to 25%, and gains may owe capital-gains tax (a 1031 exchange can defer both). Figures are a year-1 estimate at your 24.0% rate — not tax advice; consult a CPA.
Schools (NCES district)
- District
- Indianapolis Public Schools
- NCES district ID
- 1804770
- Math proficiency
- 14% ▼ -7.00%
- Reading proficiency
- 20% ▼ -3.00%
- Median HH income
- $32,034
- Composite
- 13.69/100
- National rank
- #9499
- State rank
- #286 of 301 in IN
Livability — Indianapolis city (balance)
No livability data for this city. (Only ~50 U.S. cities are tracked.)
Census & demographics
- Census place
- Indianapolis city (balance), IN
- County
- Marion County · 998,460 people
- City population
- 881,119
- Metro
- Indianapolis-Carmel-Anderson, IN
- Population (ZIP)
- 29,360
- Household income
- $38,063
- Rent vs Own
- Severe rent burden
- 2340.0
Population outlook (Marion County) Hauer SSP2
- Today (2025)
- 1,025,572 people
- By 2030
- 1,065,727 · +3.9%
- By 2040
- 1,141,577 · +11.3%
- By 2050
- 1,208,920 · +17.9%
- By 2075
- 1,367,288 · +33.3%
- By 2100
- 1,438,201 · +40.2%
Race, ethnicity, and origin ACS 2023
- Neighborhood character
- Predominantly Black (68%)
- Race & ethnicity
- Black 68% White 18% Hispanic / Latino 9% Two or more races 6%
- Hispanic origin (detail)
- Mexican 6%
- Common ancestry
- Romanian 1%
- Foreign-born
- 5% · Canada, Philippines
- Languages at home
- 92% English-only · Spanish 7%
Political lean MEDSL · Marion
- 2024 margin
- Strong D (+27.7) · D 63.0% · R 35.3% · Other 1.7%
- 2008→2024 swing
- -0.7pp no change · 2008: 28.4pp · 2024: 27.7pp
- All cycles
- 2024: D+27.7 2020: D+29.1 2016: D+22.8 2012: D+22.2 2008: D+28.4
Not yet ingested
- Civics
- —
Market trends
- HPI YoY
- ▼ -81.57%
- Current HPI
- 395.7071
- Rent YoY
- ▲ 0.81%
- Metro
- Indianapolis-Carmel-Anderson, IN
- State GDP YoY
- ▲ 2.90%
- F500 in state
- 18
Industry mix (Fortune 500 HQ in IN)
| Industry | F500 HQs | Revenue |
|---|---|---|
| Industrial Machinery | 2 | $37B |
|
||
| Healthcare | 1 | $177B |
|
||
| Pharmaceuticals | 1 | $45B |
|
||
| Metals / Steel | 1 | $18B |
|
||
| Agriculture | 1 | $17B |
|
||
| Packaging | 1 | $12B |
|
||
Price history
-23.5% since first listed17 events — show timeline
- 2026-04-16 Pending — MIBOR as Distributed by MLS Grid
- 2026-04-07 Price Changed $110,900 MIBOR as Distributed by MLS Grid
- 2026-03-17 Price Changed $115,900 MIBOR as Distributed by MLS Grid
- 2026-03-12 Relisted — MIBOR as Distributed by MLS Grid
- 2026-03-04 Listing Removed — MIBOR as Distributed by MLS Grid
- 2026-02-26 Price Changed $121,900 MIBOR as Distributed by MLS Grid
- 2026-02-10 Price Changed $126,900 MIBOR as Distributed by MLS Grid
- 2026-01-22 Price Changed $133,500 MIBOR as Distributed by MLS Grid
- 2026-01-05 Price Changed $140,500 MIBOR as Distributed by MLS Grid
- 2025-12-11 Relisted — MIBOR as Distributed by MLS Grid
- 2025-12-03 Pending — MIBOR as Distributed by MLS Grid
- 2025-11-19 Price Changed $148,000 MIBOR as Distributed by MLS Grid
- 2025-10-29 Price Changed $155,900 MIBOR as Distributed by MLS Grid
- 2025-09-16 Price Changed $162,900 MIBOR as Distributed by MLS Grid
- 2025-09-04 Listed $169,900 MIBOR as Distributed by MLS Grid
- 2025-06-24 Listing Removed — MIBOR as Distributed by MLS Grid
- 2025-04-27 Listed $145,000 MIBOR as Distributed by MLS Grid
Property tax history
-3.9%/yrLatest (2025): $111 · +2.2% YoY. Source: county tax records.
Cash-flow waterfall
monthlySold comps — $/sqft
last 12 mo · ≤1 miLoading sold comps…