7202 Mansions Dr Unit A-1 (P-1) · Corpus Christi, TX
Flood risk 3/10 · Minor
- FEMA flood zone
- X (unshaded)
- Chance of flooding over 30 yrs
- 0.12%
- Est. flood insurance / yr
- $507 – $1,088
Fire risk 4/10 · Minor
- Est. fire insurance / yr
- $1,222 – $2,270
Heat risk 10/10 · Severe
- Hot days now (above 107°F)
- 7 days/yr
- Hot days in 30 yrs
- 27 days/yr
Wind risk 9/10 · Severe
- Chance of severe wind over 30 yrs
- 99.0%
Air-quality risk 1/10 · Minimal
- Unhealthy air days now
- 0 days/yr
- Unhealthy air days in 30 yrs
- 0 days/yr
Risk factors via First Street. Map © Google.
Why this score? — see what drove the C grade
The composite is a weighted blend of 9 inputs, each scored 0–100. Each bar is that input's sub-score; the figure is the points it added to the 100-point composite (weight × sub-score).
- Cash flow +18.6/30.0
- ARV discount +13.3/15.0
- 1% rule +8.4/10.0
- DSCR +5.9/10.0
- Livability +3.9/5.0
- Condition / age +3.8/5.0
- Rent growth +3.0/5.0
- Schools +2.8/10.0
- Appreciation +0.0/10.0
$115,000
🖨 Deal sheet 📄 Offer letter ✓ Due diligence
Listing remarks MLS
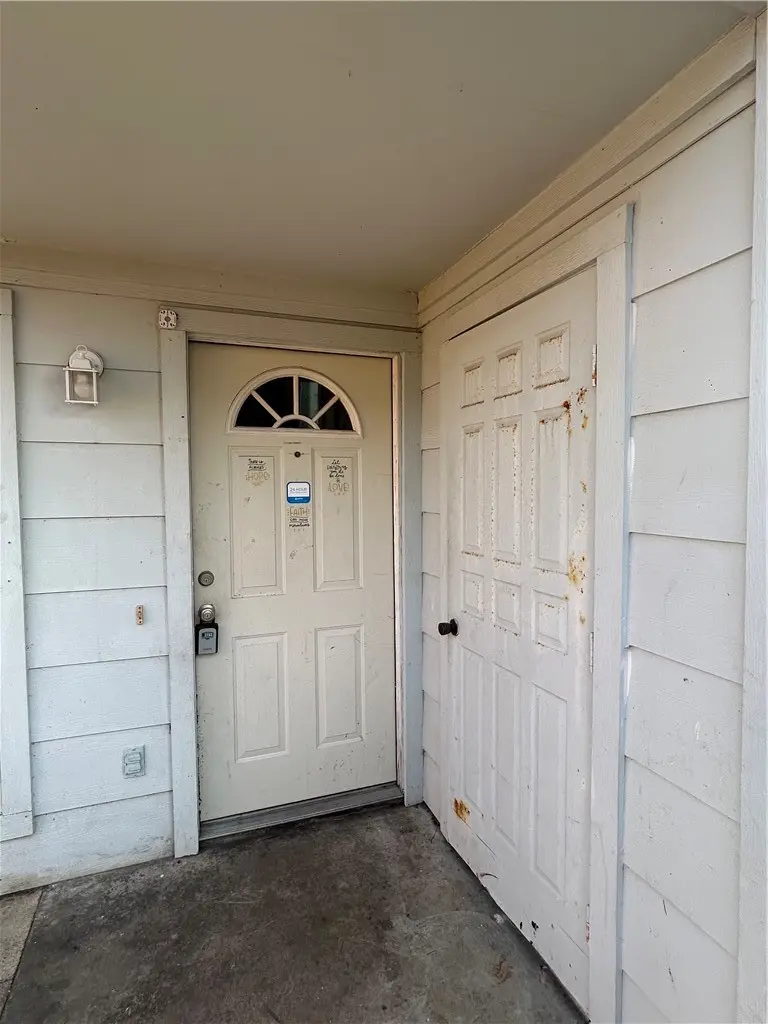
Welcome to 7202 Mansions A-1 (P-1) , a charming 2-bedroom, 1-bath townhome offering 840 square feet of comfortable living space. Whether you’re looking for a smart rental property or a place to call home, this property checks all the boxes. Its efficient layout makes great use of space, providing cozy yet functional living areas. Priced competitively, this townhome presents an excellent opportunity for both investors and owner-occupants alike. Don’t miss your chance to own a versatile property in a desirable location.
Key facts
- $315 HOA
- 2 parking spots
- Built 1984
Neighborhood map
What this means for you Summary
Snapshot
- This is a 2-bed/1.0-bath townhouse listed at $115k. Condition is rated good.
Deal economics
- At list price, monthly cash flow is $112 ($1k/yr) — positive.
- The deal already cash-flows at list — no discount required.
- Meets the 1% rule at list price ($2k rent vs $115k).
- Recommended offer: $101k (12.0% below list) — sets the bar for market timing.
- Cap rate 7.5% vs local median 3.6% in Corpus Christi — top-decile yield for the area; either an underpriced asset or a hidden risk that comps aren't pricing in. Stress-test before assuming the spread holds.
Location & tenants
- Location reads 78/100 on livability (#66 in TX, #2,404 nationally) — a middle-class / working-renter tenant base. Strengths: commute A+, cost of living A+, housing A+; Watch: crime F.
- Corpus Christi ISD (urban): math 31% / reading 35% proficiency, ranked #562 of 826 in TX (top 68%) — families likely to look elsewhere, expect single-tenant / working-renter base with shorter leases; 63% free/reduced lunch — lower-income household profile, screen leases tightly.
- Market conditions: Rents rising (+1.9%/yr); 610 active listings in the ZIP; 17 comparable units currently listed for rent nearby; rentals at typical pace (median 21d on market — plan ~3-4 weeks tenant-placement turnaround); 47% of comp listings sitting > 30 days — soft ceiling on asking rent; solid renter incomes; 1,397 units permitted in Nueces County in 2024 (47 in 5+ unit buildings).
Forward outlook
- Local home prices are declining (-3.0%/yr); year-one equity from $795 of loan paydown is wiped out by about $3k of value loss. Plan a longer hold.
- Nueces County population projected at +36% by 2050 — long-run rental-demand tailwind backs the buy-and-hold thesis.
Negotiation context
- It's been on market 157 days — a 12% lower offer ($101k) is reasonable based on typical stale-listing flexibility.
- 2 sale attempts since 3y ago with the ask held roughly flat each time — persistent listings suggest the price (not the market) is what's stuck; bring a comps-based counter.
Risks & watch-outs
- Watch-outs: HOA is 20% of rent.
- Climate carrying-cost: severe wind risk, 99% chance of damaging wind over 30y; extreme-heat days projected 7→27/yr by 2055 (HVAC capex compounding) — expect insurance premiums to compound above CPI over the hold.
Questions for the listing agent
- It's been on market 157 days. Have you received any prior offers? Is the seller open to a 12% concession, seller financing, or rate buy-down credit?
- What does the HOA fee cover, when was the last increase, and are there any pending special assessments or reserve-fund shortfalls?
- Why hasn't it sold? Are there any deal-killer items the seller is aware of (foundation, flood, title, zoning, code violations)?
- Is there a deadline driving the sale (1031 exchange, divorce, estate, relocation)? That informs how much negotiation room exists.
- Crime grade is F in this area — have there been break-ins, vandalism, or insurance claims at this property in the last 3 years? What carrier currently insures it and at what premium?
- What's the average days-on-market for RENTAL listings here right now (not sales)? A rising rental-DOM trend means longer vacancies and softer asking-rent achievability than the comps imply.
- What's the recent tenant-quality profile in this submarket — average credit score on applications, eviction rate, late-payment / NSF rate, and stable-employment percentage? A property-management company in the area should have these aggregated.
- How much new for-sale + rental construction is in the pipeline within 1–3 miles? Heavy new supply typically softens prices + rents 12–24 months out; constrained supply supports both.
Investment metrics
- 1% rule
- 1.34% ✓
- Cap rate
- 7.46%
- Cash-on-cash
- 4.17%
- DSCR
- 1.19
- GRM
- 6.2
CMA / ARV
- ARV (median comp)
- $132,109
- List price
- $115,000
- Delta
- -12.95%
- Verdict
- UNDERPRICED
- Comps
- 20 within 1.0 mi
Show comp detail 4 sales within ~0.75 mi
| Address | Dist | Beds/Ba | Sqft | Sold | Price | $/sf | Match |
|---|---|---|---|---|---|---|---|
| 7252 The Mansions Dr Unit B-1 | 0.10mi | 2/1.0 | 840 (0%) | 3mo | $99,500 | $118 | 93 |
| 7202 Mansions Dr Unit K3 | 0.10mi | 2/1.0 | 840 (0%) | 9mo | $139,000 | $165 | 88 |
| 7252 The Mansions Dr Unit A3 | 0.10mi | 2/1.0 | 772 (-8%) | 11mo | $131,000 | $170 | 73 |
| 7122 Premont Dr Unit J 202 | 0.40mi | 1/1.0 (-1) | 839 (-0%) | 8mo | $99,900 | $119 | 70 |
Match score weights: distance 35% · size 25% · config 20% · recency 20%. Top-matched comps best support the ARV.
Projected returns pro-forma
-3.0% appreciation · 1.94% rent growth · sell at horizon
- IRR
- -11.2%
- Equity multiple
- 0.60×
- Total profit
- $-12,930
- Equity at exit
- $17,147
- IRR
- -3.8%
- Equity multiple
- 0.76×
- Total profit
- $-7,765
- Equity at exit
- $9,943
Cash invested: $32,200 (down + closing). Projections, not guarantees.
Landlord ↔ Tenant lean methodology
- Overall (STATE)
- 87 Strongly Landlord-Friendly
- State Texas
- 87 Strongly Landlord-Friendly · R+5
- County
- — inherits STATE
- City
- — inherits STATE
ZIP-level market 78414
- Home prices YoY
- -18.1%
- Rents YoY
- 1.9%
- Active inventory
- 610
- Price-to-rent
- 6.2×
Monthly cashflow live
- Estimated rent
- $1,546 high interval (Pro) →
- Mortgage (P&I)
- −$603
- Tax est. 1.5%
- −$144 /mo · $1,725/yr
- Insurance
- −$48
- HOA
- −$315
- Vacancy / Maint / Mgmt
- −$325
- Net cashflow
- $112
Break-even live
UW: 25.0% down · 7.5% · 30yr · 1.5% tax · 5.0% vac · 8.0% maint · 8.0% mgmt
Financing live
Cash to close
- Down payment
- $28,750
- Closing costs
- $3,450
- Reserves months
- —
- Total cash needed
- —
Loan-product check · same deal, 3 products live
Conventional
25% down · 7.5% · 30yr
- Down + closing
- —
- Monthly P&I
- —
- Monthly cashflow
- —
- DSCR
- —
- Eligible?
- —
Personal DTI + credit; lowest rate.
DSCR
20% down · 8.5% · 30yr
- Down + closing
- —
- Monthly P&I
- —
- Monthly cashflow
- —
- DSCR
- —
- Eligible?
- —
No personal income docs; deal must DSCR.
Hard money
10% down · 12.0% · 12mo
- Down + closing
- —
- Monthly P&I
- —
- Monthly cashflow
- —
- DSCR
- —
- Eligible?
- —
Short-term bridge; refi at stabilization.
Rent comps 17 comps
| Address | Beds | Baths | Sqft | Rent | $/sqft | DOM | Units | Dist |
|---|---|---|---|---|---|---|---|---|
| 7252 Mansions Dr Unit D3 Corpus Christi, TX | 2.0 | 2.0 | 1057 | $1,600 | $1.51 | 43d | 1 | 0.05mi |
| 7202 Mansions Dr Unit J3 1 Corpus Christi, TX | 2.0 | 2.0 | 1057 | $1,695 | $1.60 | 43d | 1 | 0.11mi |
| 6901 Saratoga Blvd Corpus Christi, TX | 1.0 | 1.0 | 856 | $1,209 | $1.41 | 13d | 1 | 0.46mi |
| 3310 Rodd Field Rd Corpus Christi, TX | 1.0–2.0 | 1.0–2.0 | 847 | $1,629 | $1.92 | 13d | 35 | 0.49mi |
| 7510 Wooldridge Rd Corpus Christi, TX | 1.0–3.0 | 1.0–2.0 | 1148 | $1,830 | $1.59 | 43d | 1 | 0.67mi |
| 2921 Airline Rd Corpus Christi, TX | 1.0–2.0 | 1.0–2.0 | 982 | $1,664 | $1.69 | 43d | 1 | 0.78mi |
| 7001 Lipes Blvd Apt 507 Corpus Christi, TX | 2.0 | 2.0 | 1040 | $1,200 | $1.15 | 43d | 1 | 0.98mi |
| 7001 Lipes Blvd Unit 2211 Corpus Christi, TX | 1.0 | 1.0 | 900 | $1,000 | $1.11 | 43d | 1 | 0.98mi |
| 7001 Lipes Blvd Unit 1009 Corpus Christi, TX | 2.0 | 2.0 | 1040 | $1,000 | $0.96 | 43d | 1 | 1.03mi |
| 6225 Saratoga Blvd Corpus Christi, TX | 1.0–3.0 | 1.0–2.0 | 962 | $1,516 | $1.58 | 21d | 27 | 1.21mi |
| 6225 Saratoga Blvd Corpus Christi, TX | 1.0–3.0 | 1.0–2.0 | 962 | $1,534 | $1.59 | 13d | 27 | 1.22mi |
| 6685 Lipes Blvd Corpus Christi, TX | 1.0–3.0 | 1.0–2.0 | 1140 | $1,804 | $1.58 | 13d | 1 | 1.32mi |
| 1901 Rodd Field Rd Unit 126 Corpus Christi, TX | 1.0 | 1.0 | 588 | $850 | $1.45 | 21d | 1 | 1.34mi |
| 1901 Rodd Field Rd Unit 144 Corpus Christi, TX | 2.0 | 1.0 | 813 | $999 | $1.23 | 43d | 1 | 1.34mi |
| 6706 Rhonda Dr Corpus Christi, TX | 2.0 | 1.0 | 1002 | $1,375 | $1.37 | 21d | 1 | 1.44mi |
| 3701 Cimarron Blvd Corpus Christi, TX | 1.0–3.0 | 1.0–2.0 | 992 | $1,309 | $1.32 | 13d | 19 | 1.47mi |
| 6162 Misty Meadow Rd Corpus Christi, TX | 1.0–2.0 | 1.0–2.0 | 729 | $1,185 | $1.62 | 21d | 5 | 1.48mi |
HOA detail
- Monthly dues
- $315 · $3,780/yr
Listing history 21 events
-
2026-06-18days on market $115,000 Active 157 DOM
-
2026-06-17days on market $115,000 Active 156 DOM
-
2026-06-16days on market $115,000 Active 155 DOM
-
2026-06-15days on market $115,000 Active 154 DOM
-
2026-06-14days on market $115,000 Active 152 DOM
-
2026-06-10days on market $115,000 Active 149 DOM
-
2026-06-09days on market $115,000 Active 148 DOM
-
2026-06-08days on market $115,000 Active 147 DOM
-
2026-06-07days on market $115,000 Active 146 DOM
-
2026-06-05days on market $115,000 Active 143 DOM
-
2026-06-03days on market $115,000 Active 142 DOM
-
2026-06-02days on market $115,000 Active 141 DOM
-
2026-06-01days on market $115,000 Active 140 DOM
-
2026-05-31days on market $115,000 Active 139 DOM
-
2026-05-30days on market $115,000 Active 138 DOM
-
2026-04-10price $115,000 535-char remark
Show marketing remark (535 chars)
Welcome to 7202 Mansions A-1 (P-1) , a charming 2-bedroom, 1-bath townhome offering 840 square feet of comfortable living space. Whether you’re looking for a smart rental property or a place to call home, this property checks all the boxes. Its efficient layout makes great use of space, providing cozy yet functional living areas. Priced competitively, this townhome presents an excellent opportunity for both investors and owner-occupants alike. Don’t miss your chance to own a versatile property in a desirable location.
-
2026-02-24price $117,500 535-char remark
Show marketing remark (535 chars)
Welcome to 7202 Mansions A-1 (P-1) , a charming 2-bedroom, 1-bath townhome offering 840 square feet of comfortable living space. Whether you’re looking for a smart rental property or a place to call home, this property checks all the boxes. Its efficient layout makes great use of space, providing cozy yet functional living areas. Priced competitively, this townhome presents an excellent opportunity for both investors and owner-occupants alike. Don’t miss your chance to own a versatile property in a desirable location.
-
2026-01-12$119,900 Active 535-char remark
Show marketing remark (535 chars)
Welcome to 7202 Mansions A-1 (P-1) , a charming 2-bedroom, 1-bath townhome offering 840 square feet of comfortable living space. Whether you’re looking for a smart rental property or a place to call home, this property checks all the boxes. Its efficient layout makes great use of space, providing cozy yet functional living areas. Priced competitively, this townhome presents an excellent opportunity for both investors and owner-occupants alike. Don’t miss your chance to own a versatile property in a desirable location.
-
2023-11-30price $106,000
-
2023-10-31price $110,000
-
2023-10-12$115,000 Active
ⓘ Source: listings_history table (triggers on properties + properties_extension) + one-shot
backfill from property_details.listing_events for pre-trigger history.
Climate risk First Street
- Flood 3/10 Moderate FEMA zone X (unshaded) · 12% chance over 30 yrs
- Wildfire 4/10 Moderate
- Heat 10/10 Extreme 7 d/yr ≥107°F today · 27 d/yr by 30 yrs out
- Wind 9/10 Extreme 99% chance of damaging wind over 30 yrs
- Air quality 1/10 Low 0 unhealthy d/yr today · 0 by 30 yrs out
Nearby sold comps map
Loading sold comps map…
Walkable amenities ~0.75 mi
Loading nearby amenities…
Taxation est. · year 1
- Rental income
- $18,555
- − Mortgage interest
- −$6,442
- − Property taxes
- −$1,725
- − Insurance
- −$575
- − Repairs & maintenance
- −$1,484
- − Management
- −$1,484
- − HOA
- −$3,780
- − Depreciation
- −$3,345
- Taxable loss
- −$281
- Est. tax savings @ 24.0%
- +$67
- After-tax cash flow
- $1,409/yr
For passive investors: Depreciation is non-cash, so a rental often shows a tax loss while cash-flowing — sheltering income. Rental losses are passive: they offset passive income freely, and up to $25,000/yr can offset ordinary (W-2) income if you actively participate and your MAGI is under $100k (phasing out to $0 by $150k); unused losses carry forward. On sale, claimed depreciation is recaptured at up to 25%, and gains may owe capital-gains tax (a 1031 exchange can defer both). Figures are a year-1 estimate at your 24.0% rate — not tax advice; consult a CPA.
Condition & rehab AI · 11 photos
This 2-bedroom, 1-bath townhome is in good condition with minimal repairs needed. It offers a good return on investment with updates that can significantly increase its value.
Value-add opportunities
- Both Paint exterior trim — Enhances curb appeal and value
- Both Clean gutters — Improves drainage and property value
Renovation cost estimate screening
Value-add ROI direction
- Both Paint exterior trim — Enhances curb appeal and value ↑
- Both Clean gutters — Improves drainage and property value ↑
ⓘ Cost ranges are severity-bucket heuristics (US national rule-of-thumb). Get contractor quotes + a written scope before underwriting a rehab budget.
Schools (NCES district)
- District
- Corpus Christi ISD
- NCES district ID
- 4815270
- Math proficiency
- 31% ▼ -18.00%
- Reading proficiency
- 35% ▼ -7.00%
- Median HH income
- $45,672
- Composite
- 28.27/100
- National rank
- #6793
- State rank
- #562 of 826 in TX
Livability — Corpus Christi
- Score
- 78/100
- State rank
- #66
- US rank
- #2404
Category grades
Schools grade is shown separately in the Schools card above.
Census & demographics
- Census place
- Corpus Christi, TX
- County
- Nueces County · 296,836 people
- City population
- 296,836
- Metro
- Corpus Christi, TX
- Population (ZIP)
- 54,263
- Household income
- $98,771
- Rent vs Own
- Severe rent burden
- 1167.0
Population outlook (Nueces County) Hauer SSP2
- Today (2025)
- 418,037 people
- By 2030
- 447,123 · +7.0%
- By 2040
- 505,911 · +21.0%
- By 2050
- 567,522 · +35.8%
- By 2075
- 729,686 · +74.6%
- By 2100
- 847,087 · +102.6%
Race, ethnicity, and origin ACS 2023
- Neighborhood character
- Diverse neighborhood (Simpson 0.60)
- Race & ethnicity
- Hispanic / Latino 52% White 35% Two or more races 33% Asian 6% Black 3%
- Hispanic origin (detail)
- Mexican 46% Puerto Rican 1%
- Common ancestry
- Lithuanian 1% Slovak 1% Romanian 1%
- Foreign-born
- 9% · Canada, China, South Korea
- Languages at home
- 70% English-only · Spanish 24% Other Indo-European 2% Chinese 1%
Political lean MEDSL · Nueces
- 2024 margin
- R (+11.5) · D 43.8% · R 55.3%
- 2008→2024 swing
- -7.1pp toward R · 2008: -4.4pp · 2024: -11.5pp
- All cycles
- 2024: R+11.5 2020: R+2.9 2016: R+1.5 2012: R+3.2 2008: R+4.4
Not yet ingested
- Civics
- —
Market trends
- HPI YoY
- ▼ -40.16%
- Current HPI
- 182.3229
- Rent YoY
- ▲ 1.94%
- Metro
- Corpus Christi, TX
- State GDP YoY
- ▲ 3.95%
- F500 in state
- 110
Industry mix (Fortune 500 HQ in TX)
| Industry | F500 HQs | Revenue |
|---|---|---|
| Energy | 16 | $1,198B |
|
||
| Technology | 5 | $198B |
|
||
| Engineering / Construction | 4 | $72B |
|
||
| Energy Services | 3 | $60B |
|
||
| Utilities | 3 | $41B |
|
||
| Healthcare | 2 | $330B |
|
||
Price history
+0.0% since first listed6 events — show timeline
- 2026-04-10 Price Changed $115,000 CBMLS
- 2026-02-24 Price Changed $117,500 CBMLS
- 2026-01-12 Listed $119,900 CBMLS
- 2023-11-30 Price Changed $106,000 CBMLS
- 2023-10-31 Price Changed $110,000 CBMLS
- 2023-10-12 Listed $115,000 CBMLS
Cash-flow waterfall
monthlySold comps — $/sqft
last 12 mo · ≤1 miLoading sold comps…