103 E 11th St · Belle Rive, IL
Flood risk 1/10 · Minimal
- FEMA flood zone
- X (unshaded)
- Chance of flooding over 30 yrs
- 0.0%
- Est. flood insurance / yr
- $473 – $860
Fire risk 1/10 · Minimal
- Est. fire insurance / yr
- $804 – $1,492
Heat risk 4/10 · Minor
- Hot days now (above 106°F)
- 7 days/yr
- Hot days in 30 yrs
- 20 days/yr
Wind risk 2/10 · Minimal
- Chance of severe wind over 30 yrs
- 3.0%
Air-quality risk 2/10 · Minimal
- Unhealthy air days now
- 0 days/yr
- Unhealthy air days in 30 yrs
- 1 days/yr
Risk factors via First Street. Map © Google.
Why this score? — see what drove the C+ grade
The composite is a weighted blend of 9 inputs, each scored 0–100. Each bar is that input's sub-score; the figure is the points it added to the 100-point composite (weight × sub-score).
- Cash flow +27.8/30.0
- DSCR +9.8/10.0
- 1% rule +7.6/10.0
- Appreciation +5.0/10.0
- ARV discount +4.2/15.0
- Livability +2.9/5.0
- Rent growth +2.5/5.0
- Condition / age +2.5/5.0
- Schools +1.2/10.0
$85,000
🖨 Deal sheet 📄 Offer letter ✓ Due diligence
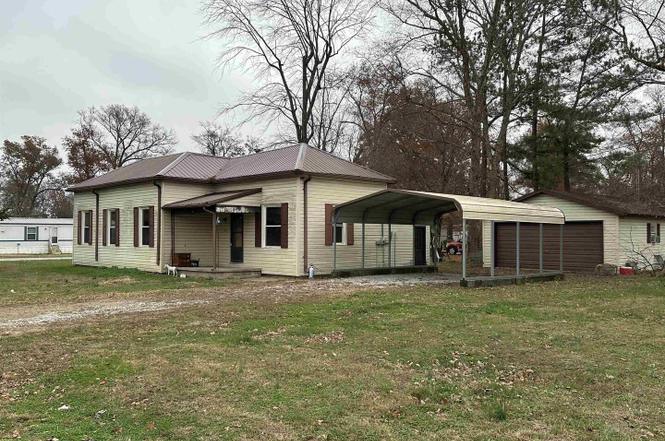
Listing remarks
Check out this solid 3 bedroom, 1 full bath home featuring 9-foot ceilings and large rooms, ready for your personal touch! WITH many major upgrades already completed, this property just needs some cosmetic updates to truly shine. Key Features:3 Bedrooms | 1 Full Bath-9 ft ceilings and spacious room sizes-2-car garage plus additional carport added in 2021.All new windows (2021) Metal roof installed in (2022)All new plumbing completed in (2025) There is also another utility shed on the property. The home sits on a huge corner lot in the middle of town. Located in an area with great schoolsConvenient Location: -10 minutes from Continental Tire-5 minutes from the interstate. With so much alread
Key facts
- Metal roof
- New plumbing
- Large rooms
Tags
Neighborhood map
What this means for you Summary
Snapshot
- This is a 3-bed/1.0-bath single-family listed at $85k.
Deal economics
- At list price, monthly cash flow is $258 ($3k/yr) — positive.
- The deal already cash-flows at list — no discount required.
- Meets the 1% rule at list price ($1k rent vs $85k).
- Recommended offer: $84k (1.5% below list) — sets the bar for market timing.
Location & tenants
- Location reads 58/100 on livability (#1,136 in IL) — a working-class tenant base; expect higher turnover. Strengths: cost of living A+, housing A; Watch: crime D, schools F, amenities F.
- Mt Vernon Twp Hsd 201 (town): math 13% / reading 16% proficiency, ranked #532 of 620 in IL (top 86%) — low school quality limits family demand, transient renter base, plan for 1-2y turnover.
- Market conditions: 2 active listings in the ZIP; 6 units permitted in Jefferson County in 2024 (0 in 5+ unit buildings).
Forward outlook
- In year one you build about $3k of equity ($588 loan paydown + $3k appreciation (3.0% local appreciation)).
- Jefferson County population projected at -14% by 2050 — secular population decline; favor cash flow + early exit over multi-decade hold.
- At projected returns (3.0% appreciation + 3.0% rent growth), your $24k cash investment doubles in ~4 years — after that, you're playing with house money.
- By year 10, paydown + projected appreciation supports a ~$30k cash-out refi (75% LTV) — recoverable capital for the next deal without selling this one.
Negotiation context
- It's been on market 28 days — a 2% lower offer ($84k) is reasonable based on typical stale-listing flexibility.
- Current owner paid $72k; 18% above their basis — modest negotiation headroom, anchor on the comps not their cost.
Risks & watch-outs
- Watch-outs: built in 1920 — expect roof / HVAC / electrical / plumbing capex.
Questions for the listing agent
- Built in 1920 — when were the roof, HVAC, electrical panel, plumbing, and water heater last replaced?
- Is there a deadline driving the sale (1031 exchange, divorce, estate, relocation)? That informs how much negotiation room exists.
- Schools are F-rated, which usually means shorter tenancies and higher turnover. Who's the typical renter profile here, and what's been the actual vacancy rate?
- Crime grade is D in this area — have there been break-ins, vandalism, or insurance claims at this property in the last 3 years? What carrier currently insures it and at what premium?
- What's the average days-on-market for RENTAL listings here right now (not sales)? A rising rental-DOM trend means longer vacancies and softer asking-rent achievability than the comps imply.
- What's the recent tenant-quality profile in this submarket — average credit score on applications, eviction rate, late-payment / NSF rate, and stable-employment percentage? A property-management company in the area should have these aggregated.
- How much new for-sale + rental construction is in the pipeline within 1–3 miles? Heavy new supply typically softens prices + rents 12–24 months out; constrained supply supports both.
Investment metrics
- 1% rule
- 1.26% ✓
- Cap rate
- 9.94%
- Cash-on-cash
- 13.02%
- DSCR
- 1.58
- GRM
- 6.6
CMA / ARV
- ARV (on-the-fly)
- $79,200
- Comps found
- 3
Show comp detail 3 sales within ~0.75 mi
| Address | Dist | Beds/Ba | Sqft | Sold | Price | $/sf | Match |
|---|---|---|---|---|---|---|---|
| 103 E 11th St | 0.00mi | 3/1.0 | 1,200 (0%) | 5mo | $72,000 | $60 | 96 |
| 601 S Forest St | 0.16mi | 3/1.0 | 1,248 (+4%) | 4mo | $147,000 | $118 | 83 |
| 703 S Gum St | 0.24mi | 3/1.0 | 1,269 (+6%) | 23mo | $83,500 | $66 | 60 |
Match score weights: distance 35% · size 25% · config 20% · recency 20%. Top-matched comps best support the ARV.
Projected returns pro-forma
3.0% appreciation · 3.0% rent growth · sell at horizon
- IRR
- 19.7%
- Equity multiple
- 2.12×
- Total profit
- $26,709
- Equity at exit
- $38,220
- IRR
- 20.9%
- Equity multiple
- 4.03×
- Total profit
- $72,057
- Equity at exit
- $58,901
Cash invested: $23,800 (down + closing). Projections, not guarantees.
Landlord ↔ Tenant lean methodology
- Overall (STATE)
- 43 Moderately Tenant-Leaning
- State Illinois
- 43 Moderately Tenant-Leaning · D+7
- County
- — inherits STATE
- City
- — inherits STATE
ZIP-level market 62810
- Active inventory
- 2
- Price-to-rent
- 6.6×
Monthly cashflow live
- Estimated rent
- $1,071 medium interval (Pro) →
- Mortgage (P&I)
- −$446
- Tax est. 1.5%
- −$106 /mo · $1,275/yr
- Insurance
- −$35
- HOA
- −$0
- Vacancy / Maint / Mgmt
- −$225
- Net cashflow
- $258
Break-even live
UW: 25.0% down · 7.5% · 30yr · 1.5% tax · 5.0% vac · 8.0% maint · 8.0% mgmt
Financing live
Cash to close
- Down payment
- $21,250
- Closing costs
- $2,550
- Reserves months
- —
- Total cash needed
- —
Loan-product check · same deal, 3 products live
Conventional
25% down · 7.5% · 30yr
- Down + closing
- —
- Monthly P&I
- —
- Monthly cashflow
- —
- DSCR
- —
- Eligible?
- —
Personal DTI + credit; lowest rate.
DSCR
20% down · 8.5% · 30yr
- Down + closing
- —
- Monthly P&I
- —
- Monthly cashflow
- —
- DSCR
- —
- Eligible?
- —
No personal income docs; deal must DSCR.
Hard money
10% down · 12.0% · 12mo
- Down + closing
- —
- Monthly P&I
- —
- Monthly cashflow
- —
- DSCR
- —
- Eligible?
- —
Short-term bridge; refi at stabilization.
Listing history 12 events
-
2026-05-24status Pending
-
2026-05-24status Pending
-
2026-05-22status Pending
-
2026-02-02soldstatus $72,000 Closed
-
2026-02-02soldstatus $72,000 Closed
-
2026-02-02soldstatus $72,000 Closed
-
2026-02-02soldstatus $72,000 Closed
-
2026-01-14status Pending
-
2026-01-06historical
-
2025-12-05price
-
2025-11-24Active
-
2025-03-06historical
ⓘ Source: listings_history table (triggers on properties + properties_extension) + one-shot
backfill from property_details.listing_events for pre-trigger history.
Climate risk First Street
- Flood 1/10 Low FEMA zone X (unshaded) · 0% chance over 30 yrs
- Wildfire 1/10 Low
- Heat 4/10 Moderate 7 d/yr ≥106°F today · 20 d/yr by 30 yrs out
- Wind 2/10 Low 3% chance of damaging wind over 30 yrs
- Air quality 2/10 Low 0 unhealthy d/yr today · 1 by 30 yrs out
Nearby sold comps map
Loading sold comps map…
Walkable amenities ~0.75 mi
Loading nearby amenities…
Taxation est. · year 1
- Rental income
- $12,847
- − Mortgage interest
- −$4,761
- − Property taxes
- −$1,275
- − Insurance
- −$425
- − Repairs & maintenance
- −$1,028
- − Management
- −$1,028
- − Depreciation
- −$2,473
- Taxable income
- $1,857
- Est. tax owed @ 24.0%
- −$446
- After-tax cash flow
- $2,654/yr
For passive investors: Depreciation is non-cash, so a rental often shows a tax loss while cash-flowing — sheltering income. Rental losses are passive: they offset passive income freely, and up to $25,000/yr can offset ordinary (W-2) income if you actively participate and your MAGI is under $100k (phasing out to $0 by $150k); unused losses carry forward. On sale, claimed depreciation is recaptured at up to 25%, and gains may owe capital-gains tax (a 1031 exchange can defer both). Figures are a year-1 estimate at your 24.0% rate — not tax advice; consult a CPA.
Schools (NCES district)
- District
- Mt Vernon Twp Hsd 201
- NCES district ID
- 1727360
- Math proficiency
- 13% ▼ -8.00%
- Reading proficiency
- 16% ▼ -8.00%
- Median HH income
- $38,188
- Composite
- 12.22/100
- National rank
- #9648
- State rank
- #532 of 620 in IL
Livability — Belle Rive
- Score
- 58/100
- State rank
- #1136
- US rank
- #21485
Category grades
Schools grade is shown separately in the Schools card above.
Census & demographics
- Census place
- Belle Rive, IL
- Population (ZIP)
- 1,218
Population outlook (Jefferson County) Hauer SSP2
- Today (2025)
- 36,818 people
- By 2030
- 35,764 · -2.9%
- By 2040
- 33,649 · -8.6%
- By 2050
- 31,557 · -14.3%
- By 2075
- 26,055 · -29.2%
- By 2100
- 19,237 · -47.8%
Race, ethnicity, and origin ACS 2023
- Neighborhood character
- Predominantly White (91%)
- Race & ethnicity
- White 91% Two or more races 8% Hispanic / Latino 4%
- Common ancestry
- Italian 5% Scottish 2% Lithuanian 1%
- Foreign-born
- 1%
- Languages at home
- 80% English-only · German/W. Germanic 18% Other Asian/Pacific 1%
Political lean MEDSL · Jefferson
- 2024 margin
- Solid R (+47.8) · D 25.5% · R 73.3% · Other 1.3%
- 2008→2024 swing
- -37.0pp toward R · 2008: -10.7pp · 2024: -47.8pp
- All cycles
- 2024: R+47.8 2020: R+45.1 2016: R+43.2 2012: R+22.9 2008: R+10.7
Not yet ingested
- Civics
- —
Market trends
- HPI YoY
- —
- Current HPI
- —
- Rent YoY
- —
- Metro
- —
- State GDP YoY
- ▲ 1.59%
- F500 in state
- 60
Industry mix (Fortune 500 HQ in IL)
| Industry | F500 HQs | Revenue |
|---|---|---|
| Insurance | 4 | $201B |
|
||
| Consumer Goods | 4 | $87B |
|
||
| Industrial Machinery | 3 | $64B |
|
||
| Healthcare | 2 | $55B |
|
||
| Retail / Pharmacy | 1 | $148B |
|
||
| Agriculture / Food | 1 | $86B |
|
||
Price history
+0.0% since first listed12 events — show timeline
- 2026-05-24 Pending — MRED as Distributed by MLS Grid
- 2026-05-24 Pending — MRED as Distributed by MLS Grid
- 2026-05-22 Pending — MRED as Distributed by MLS Grid
- 2026-02-02 Sold (MLS) $72,000 MRED as Distributed by MLS Grid
- 2026-02-02 Sold (MLS) $72,000 MRED as Distributed by MLS Grid
- 2026-02-02 Sold (MLS) $72,000 MRED as Distributed by MLS Grid
- 2026-02-02 Sold (MLS) $72,000 MRED as Distributed by MLS Grid
- 2026-01-14 Pending — MRED as Distributed by MLS Grid
- 2026-01-06 Listing Removed — RMLSA as Distributed by MLS Grid
- 2025-12-05 Price Changed — RMLSA as Distributed by MLS Grid
- 2025-11-24 Listed — RMLSA as Distributed by MLS Grid
- 2025-03-06 Listing Removed — MRED as Distributed by MLS Grid
Cash-flow waterfall
monthlySold comps — $/sqft
last 12 mo · ≤1 miLoading sold comps…