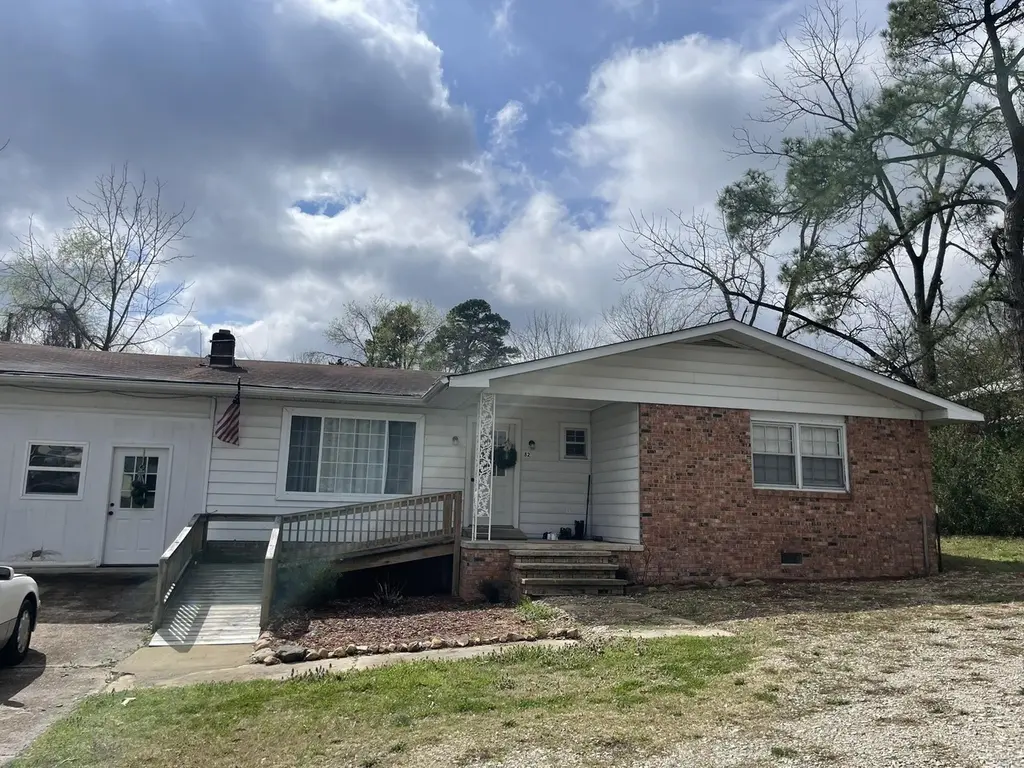
82 W Main St · Melbourne, AR
Flood risk No data
- FEMA flood zone
- —
- Chance of flooding over 30 yrs
- —
- Est. flood insurance / yr
- —
Fire risk No data
- Est. fire insurance / yr
- —
Heat risk No data
- Hot days now (above threshold)
- —
- Hot days in 30 yrs
- —
Wind risk No data
- Chance of severe wind over 30 yrs
- —
Air-quality risk No data
- Unhealthy air days now
- —
- Unhealthy air days in 30 yrs
- —
Risk factors via First Street. Map © Google.
Why this score? — see what drove the C grade
The composite is a weighted blend of 9 inputs, each scored 0–100. Each bar is that input's sub-score; the figure is the points it added to the 100-point composite (weight × sub-score).
- Cash flow +17.0/30.0
- ARV discount +14.3/15.0
- Appreciation +6.1/10.0
- DSCR +5.3/10.0
- 1% rule +4.6/10.0
- Schools +4.1/10.0
- Livability +3.3/5.0
- Rent growth +2.5/5.0
- Condition / age +2.5/5.0
$124,900
🖨 Deal sheet 📄 Offer letter ✓ Due diligence
Listing remarks MLS
Conveniently located near the junction of Highway 9 and Main Street in Melbourne, Arkansas, this 3-bedroom, 2-bathroom home is situated on approximately 0.33 acres. Enjoy the ease of commuting to local amenities, with parks, grocery stores, and schools all within walking distance or just a short drive away. The property features an additional room, ideal for a den, as well as a generous backyard—perfect for outdoor relaxation or entertainment. In addition, all furniture and appliances will stay with the property! Whether you’re looking for your next home or an investment opportunity, this Melbourne property is listed for only $124,900.
Key facts
- Additional room
- Generous backyard
- 0.33 acre lot
Tags
Neighborhood map
What this means for you Summary
Snapshot
- This is a 3-bed/1.5-bath single-family listed at $125k.
Deal economics
- At list price, monthly cash flow is $85 ($1k/yr) — positive.
- The deal already cash-flows at list — no discount required.
- To meet the 1% rule (rent ≥ 1% of price), the offer needs to be $120k (3.9% below list).
- Recommended offer: $110k (12.0% below list) — sets the bar for market timing.
- Cap rate 7.1% vs local median 3.1% in Melbourne — top-decile yield for the area; either an underpriced asset or a hidden risk that comps aren't pricing in. Stress-test before assuming the spread holds.
Location & tenants
- Location reads 66/100 on livability (#127 in AR) — a middle-class / working-renter tenant base. Strengths: cost of living A+, health & safety A, crime B+; Watch: amenities F, commute F, employment F.
- Melbourne School District (rural): math 48% / reading 51% proficiency, ranked #22 of 238 in AR (top 9%) — families likely to look elsewhere, expect single-tenant / working-renter base with shorter leases.
- Market conditions: 66 active listings in the ZIP; 6 units permitted in Izard County in 2024 (0 in 5+ unit buildings).
Forward outlook
- In year one you build about $4k of equity ($864 loan paydown + $3k appreciation (2.2% local appreciation)).
- Izard County population projected to shrink 8% by 2050 — rents likely to lag national; underwrite the cash flow, not the appreciation.
- At projected returns (2.2% appreciation + 3.0% rent growth), your $35k cash investment doubles in ~7 years — after that, you're playing with house money.
- By year 9, paydown + projected appreciation supports a ~$31k cash-out refi (75% LTV) — recoverable capital for the next deal without selling this one.
Negotiation context
- It's been on market 168 days — a 12% lower offer ($110k) is reasonable based on typical stale-listing flexibility.
- Current owner paid $80k; list at $125k implies a 56% gain — meaningful room to come down on a strong offer.
Questions for the listing agent
- It's been on market 168 days. Have you received any prior offers? Is the seller open to a 12% concession, seller financing, or rate buy-down credit?
- Why hasn't it sold? Are there any deal-killer items the seller is aware of (foundation, flood, title, zoning, code violations)?
- Is there a deadline driving the sale (1031 exchange, divorce, estate, relocation)? That informs how much negotiation room exists.
- What's the average days-on-market for RENTAL listings here right now (not sales)? A rising rental-DOM trend means longer vacancies and softer asking-rent achievability than the comps imply.
- What's the recent tenant-quality profile in this submarket — average credit score on applications, eviction rate, late-payment / NSF rate, and stable-employment percentage? A property-management company in the area should have these aggregated.
- How much new for-sale + rental construction is in the pipeline within 1–3 miles? Heavy new supply typically softens prices + rents 12–24 months out; constrained supply supports both.
Investment metrics
- 1% rule
- 0.96% ✗
- Cap rate
- 7.11%
- Cash-on-cash
- 2.91%
- DSCR
- 1.13
- GRM
- 8.7
CMA / ARV
- ARV (median comp)
- $147,093
- List price
- $124,900
- Delta
- -15.09%
- Verdict
- UNDERPRICED
- Comps
- 20 within 1.0 mi
Show comp detail 7 sales within ~0.75 mi
| Address | Dist | Beds/Ba | Sqft | Sold | Price | $/sf | Match |
|---|---|---|---|---|---|---|---|
| 137 Sharp St | 0.71mi | 3/2.0 | 1,580 (-1%) | 4mo | $199,500 | $126 | 60 |
| 38 Harris St | 0.12mi | 3/2.0 | 1,382 (-14%) | 14mo | $178,000 | $129 | 58 |
| 106 W Court St | 0.06mi | 2/2.0 (-1) | 1,392 (-13%) | 14mo | $20,000 | $14 | 56 |
| 151 Jay St | 0.38mi | 4/2.0 (+1) | 1,456 (-9%) | 12mo | $114,000 | $78 | 51 |
| 39 Simpson St | 0.66mi | 4/2.5 (+1) | 1,576 (-2%) | 13mo | $152,000 | $96 | 47 |
| 615 Ripplin Shls | 0.71mi | 4/3.0 (+1) | 1,658 (+4%) | 5mo | $345,000 | $208 | 46 |
| 145 Arnold Springs Rd | 0.67mi | 3/2.0 | 1,512 (-6%) | 20mo | $149,900 | $99 | 41 |
Match score weights: distance 35% · size 25% · config 20% · recency 20%. Top-matched comps best support the ARV.
Projected returns pro-forma
2.23% appreciation · 3.0% rent growth · sell at horizon
- IRR
- 8.1%
- Equity multiple
- 1.44×
- Total profit
- $15,423
- Equity at exit
- $50,797
- IRR
- 11.1%
- Equity multiple
- 2.54×
- Total profit
- $53,855
- Equity at exit
- $74,344
Cash invested: $34,972 (down + closing). Projections, not guarantees.
Landlord ↔ Tenant lean methodology
- Overall (STATE)
- 92 Strongly Landlord-Friendly
- State Arkansas
- 92 Strongly Landlord-Friendly · R+14
- County
- — inherits STATE
- City
- — inherits STATE
ZIP-level market 72556
- Home prices YoY
- 1.3%
- Active inventory
- 66
- Price-to-rent
- 8.7×
Monthly cashflow live
- Estimated rent
- $1,200 medium interval (Pro) →
- Mortgage (P&I)
- −$655
- Tax est. 1.5%
- −$156 /mo · $1,874/yr
- Insurance
- −$52
- HOA
- −$0
- Vacancy / Maint / Mgmt
- −$252
- Net cashflow
- $85
Break-even live
UW: 25.0% down · 7.5% · 30yr · 1.5% tax · 5.0% vac · 8.0% maint · 8.0% mgmt
Financing live
Cash to close
- Down payment
- $31,225
- Closing costs
- $3,747
- Reserves months
- —
- Total cash needed
- —
Loan-product check · same deal, 3 products live
Conventional
25% down · 7.5% · 30yr
- Down + closing
- —
- Monthly P&I
- —
- Monthly cashflow
- —
- DSCR
- —
- Eligible?
- —
Personal DTI + credit; lowest rate.
DSCR
20% down · 8.5% · 30yr
- Down + closing
- —
- Monthly P&I
- —
- Monthly cashflow
- —
- DSCR
- —
- Eligible?
- —
No personal income docs; deal must DSCR.
Hard money
10% down · 12.0% · 12mo
- Down + closing
- —
- Monthly P&I
- —
- Monthly cashflow
- —
- DSCR
- —
- Eligible?
- —
Short-term bridge; refi at stabilization.
Listing history 3 events
-
2025-11-29$124,900 New Listing 655-char remark
Show marketing remark (655 chars)
Conveniently located near the junction of Highway 9 and Main Street in Melbourne, Arkansas, this 3-bedroom, 2-bathroom home is situated on approximately 0.33 acres. Enjoy the ease of commuting to local amenities, with parks, grocery stores, and schools all within walking distance or just a short drive away. The property features an additional room, ideal for a den, as well as a generous backyard—perfect for outdoor relaxation or entertainment. In addition, all furniture and appliances will stay with the property! Whether you’re looking for your next home or an investment opportunity, this Melbourne property is listed for only $124,900.
-
2023-06-20soldstatus $80,000
-
1999-03-11soldstatus $38,000
ⓘ Source: listings_history table (triggers on properties + properties_extension) + one-shot
backfill from property_details.listing_events for pre-trigger history.
Nearby sold comps map
Loading sold comps map…
Walkable amenities ~0.75 mi
Loading nearby amenities…
Taxation est. · year 1
- Rental income
- $14,399
- − Mortgage interest
- −$6,996
- − Property taxes
- −$1,874
- − Insurance
- −$624
- − Repairs & maintenance
- −$1,152
- − Management
- −$1,152
- − Depreciation
- −$3,633
- Taxable loss
- −$1,032
- Est. tax savings @ 24.0%
- +$248
- After-tax cash flow
- $1,265/yr
For passive investors: Depreciation is non-cash, so a rental often shows a tax loss while cash-flowing — sheltering income. Rental losses are passive: they offset passive income freely, and up to $25,000/yr can offset ordinary (W-2) income if you actively participate and your MAGI is under $100k (phasing out to $0 by $150k); unused losses carry forward. On sale, claimed depreciation is recaptured at up to 25%, and gains may owe capital-gains tax (a 1031 exchange can defer both). Figures are a year-1 estimate at your 24.0% rate — not tax advice; consult a CPA.
Schools (NCES district)
- District
- Melbourne School District
- NCES district ID
- 0509720
- Math proficiency
- 48% ▼ -13.00%
- Reading proficiency
- 51% ▼ -7.00%
- Median HH income
- $37,534
- Composite
- 41.18/100
- National rank
- #3548
- State rank
- #22 of 238 in AR
Livability — Melbourne
- Score
- 66/100
- State rank
- #127
- US rank
- #11858
Category grades
Schools grade is shown separately in the Schools card above.
Census & demographics
- Census place
- Melbourne, AR
- Population (ZIP)
- 3,846
Population outlook (Izard County) Hauer SSP2
- Today (2025)
- 13,018 people
- By 2030
- 12,761 · -2.0%
- By 2040
- 12,331 · -5.3%
- By 2050
- 12,041 · -7.5%
- By 2075
- 11,516 · -11.5%
- By 2100
- 10,549 · -19.0%
Race, ethnicity, and origin ACS 2023
- Neighborhood character
- Predominantly White (94%)
- Race & ethnicity
- White 94% Two or more races 5% Hispanic / Latino 3%
- Common ancestry
- Slovak 2% Scotch-Irish 2% Lithuanian 2%
- Foreign-born
- 0%
- Languages at home
- 97% English-only · Spanish 2% Chinese 1%
Political lean MEDSL · Izard
- 2024 margin
- Solid R (+65.9) · D 16.0% · R 81.9% · Other 2.1%
- 2008→2024 swing
- -39.1pp toward R · 2008: -26.9pp · 2024: -65.9pp
- All cycles
- 2024: R+65.9 2020: R+62.1 2016: R+54.3 2012: R+37.8 2008: R+26.9
Not yet ingested
- Civics
- —
Market trends
- HPI YoY
- ▲ 2.23%
- Current HPI
- 173.362
- Rent YoY
- —
- Metro
- —
- State GDP YoY
- ▲ 3.80%
- F500 in state
- 10
Industry mix (Fortune 500 HQ in AR)
| Industry | F500 HQs | Revenue |
|---|---|---|
| Retail | 1 | $681B |
|
||
| Food / Agriculture | 1 | $53B |
|
||
| Retail / Energy | 1 | $22B |
|
||
| Transportation / Logistics | 1 | $12B |
|
||
| Energy | 1 | $4B |
|
||
Price history
+228.7% since first listed3 events — show timeline
- 2025-11-29 Listed $124,900 CARMLS
- 2023-06-20 Sold (Public Records) $80,000 Public Records
- 1999-03-11 Sold (Public Records) $38,000 Public Records
Property tax history
+1.4%/yrLatest (2024): $61 · -89.2% YoY. Source: county tax records.
Cash-flow waterfall
monthlySold comps — $/sqft
last 12 mo · ≤1 miLoading sold comps…