 Duplex
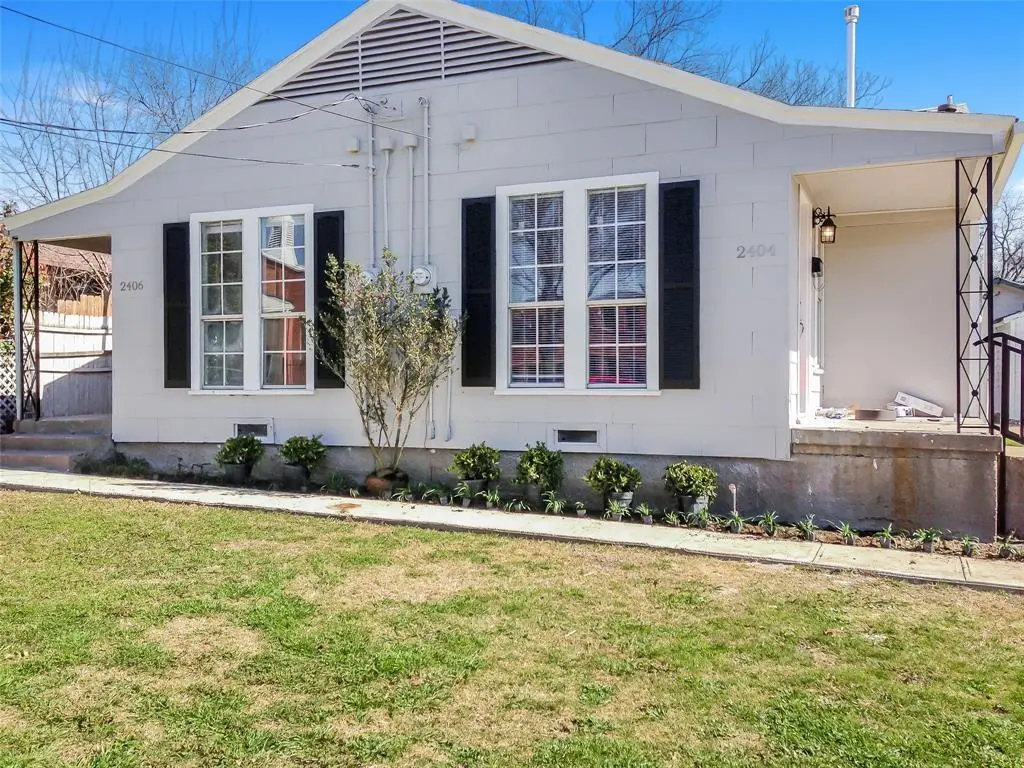
2404-2406 Colony Ct · Dallas, TX
Flood risk 1/10 · Minimal
- FEMA flood zone
- X (unshaded)
- Chance of flooding over 30 yrs
- 0.0%
- Est. flood insurance / yr
- $507 – $1,088
Fire risk 1/10 · Minimal
- Est. fire insurance / yr
- $1,222 – $2,270
Heat risk 7/10 · Major
- Hot days now (above 110°F)
- 7 days/yr
- Hot days in 30 yrs
- 23 days/yr
Wind risk 6/10 · Moderate
- Chance of severe wind over 30 yrs
- 27.0%
Air-quality risk 3/10 · Minor
- Unhealthy air days now
- 3 days/yr
- Unhealthy air days in 30 yrs
- 4 days/yr
Risk factors via First Street. Map © Google.
Why this score? — see what drove the F grade
The composite is a weighted blend of 9 inputs, each scored 0–100. Each bar is that input's sub-score; the figure is the points it added to the 100-point composite (weight × sub-score).
- Cash flow +10.5/30.0
- ARV discount +4.7/15.0
- Livability +4.0/5.0
- DSCR +3.0/10.0
- Schools +2.8/10.0
- 1% rule +2.6/10.0
- Condition / age +2.5/5.0
- Rent growth +2.3/5.0
- Appreciation +0.0/10.0
$340,000
🖨 Deal sheet (PDF) 📄 Offer letter ✓ Due diligence
Multi-family units
County records classify this as Multi-Family (2-4 Unit). Listing-text estimate: 2 units. confirmed
Listing remarks
OPEN HOUSE SATURDAY JUNE 13TH 12-2PM. Charming income-producing duplex in a prime Dallas location near Dallas Love Field and the Dallas Medical District. This versatile property features two spacious 2-bedroom, 1-bath units, making it ideal for owner-occupants, investors, or house hackers seeking strong rental potential. Each unit offers functional layouts, updated appliances, beautiful hardwood floors, and separate entrances for added privacy. Central air was installed in all units in 2025, adding modern comfort and efficiency. One unit is currently vacant and the other is tenant occupied. Both floorplans are the exact same. Positioned in a high-demand rental corridor with convenient acces
Key facts
- Updated appliances
- Separate entrances
- Central air
Tags
Property features AI
Finance
- Other: Two buildings, two total units
- Financial info: Treated as clear loan type; No second mortgage; Capitalization rate: 12.36; Gross annual income: 40,800; Gross annual expenses: 5,000; Insurance expense: 14,000; Net operating income: 40,800
- HOA & community: No association
Exterior
- Parking: 2 parking spaces; Additional parking; Attached carport; On-street parking
- Utilities: City sewer; Electricity available; Individual gas meter; No municipal utility district
- Home design: Duplex (residential income); One level; Built in 1947; Smart home features
- Construction: Vinyl siding; Siding exterior; Shingle roof; Slab foundation
- Exterior features: Private yard; Back yard fencing
Interior
- Kitchen: Gas oven; Microwave; Refrigerator
- Bedrooms: 4 bedrooms
- Flooring: Hardwood
- Bathrooms: 2 full bathrooms
- Heating & cooling: Central heating; Central air conditioning
- Interior features: Eat-in kitchen; Granite counters; Open floorplan; Walk-in closet(s)
- Laundry & utility: Washer; Dryer
Neighborhood map
What this means for you Summary
Snapshot
- This is a 2 × 2-bed/1-bath units multifamily listed at $340k.
Deal economics
- At list price, monthly cash flow is $-175 ($-2k/yr) — negative. Per door: $-88/mo.
- To cash-flow at today's rent, offer at most $309k (9.1% below list).
- To meet the 1% rule (rent ≥ 1% of price), the offer needs to be $258k (24.2% below list).
- Recommended offer: $258k (24.2% below list) — sets the bar for 1% rule.
- Cap rate 5.7% vs local median 2.3% in Dallas — top-decile yield for the area; either an underpriced asset or a hidden risk that comps aren't pricing in. Stress-test before assuming the spread holds.
Location & tenants
- Location reads 81/100 on livability (#24 in TX, #1,380 nationally) — a professional / high-income tenant draw. Strengths: amenities A+, commute A+, housing A+; Watch: crime F.
- Dallas ISD (urban): math 31% / reading 36% proficiency, ranked #559 of 826 in TX (top 68%) — families likely to look elsewhere, expect single-tenant / working-renter base with shorter leases; 83% free/reduced lunch — lower-income household profile, screen leases tightly.
- Zoned schools: Obadiah Knight El (math 42% / reading 37%, grade F, #1,545 of 4,322 statewide, top 38%, 317 students, 94% FRL).
- Market conditions: Rents soft (-0.7%/yr); 85 active listings in the ZIP; 33 comparable units currently listed for rent nearby; rentals at typical pace (median 21d on market — plan ~3-4 weeks tenant-placement turnaround); 12,577 units permitted in Dallas County in 2024 (6,829 in 5+ unit buildings).
- At $2,576/mo this rent would consume 49% of the median local household income ($63k/yr) (locally 1427% of renters already pay >50% of income on rent) — very limited rent-growth headroom before tenants either downsize or default.
Forward outlook
- Local home prices are declining (-3.0%/yr); year-one equity from $2k of loan paydown is wiped out by about $10k of value loss. Plan a longer hold.
- Dallas County population projected at +35% by 2050 — long-run rental-demand tailwind backs the buy-and-hold thesis.
Negotiation context
- It's been on market 21 days — a 2% lower offer ($335k) is reasonable based on typical stale-listing flexibility.
- 2 sale attempts; this cycle's ask is 3% above the opening price — seller raised mid-cycle; expect resistance to lowballs.
Risks & watch-outs
- Watch-outs: built in 1947 — expect roof / HVAC / electrical / plumbing capex.
- Climate carrying-cost: major wind risk, 27% chance of damaging wind over 30y; extreme-heat days projected 7→23/yr by 2055 (HVAC capex compounding) — expect insurance premiums to compound above CPI over the hold.
Questions for the listing agent
- What do current leases actually rent for vs. the listed asking? Can we see a recent rent roll and the last 12 months of T-12 income?
- Can we see the unit-by-unit rent roll, current vacancy, and any below-market leases? What's the average tenancy length?
- What capital expenditures (roof, boiler, parking lot, exteriors) have been made in the last 5 years, and what's planned in the next 2?
- Built in 1947 — when were the roof, HVAC, electrical panel, plumbing, and water heater last replaced?
- Is there a deadline driving the sale (1031 exchange, divorce, estate, relocation)? That informs how much negotiation room exists.
- Crime grade is F in this area — have there been break-ins, vandalism, or insurance claims at this property in the last 3 years? What carrier currently insures it and at what premium?
- The area grade is low — what's the realistic commute time and amenity access for the typical tenant pool here? Any planned neighborhood developments (good or bad) we should know about?
- What's the average days-on-market for RENTAL listings here right now (not sales)? A rising rental-DOM trend means longer vacancies and softer asking-rent achievability than the comps imply.
- What's the recent tenant-quality profile in this submarket — average credit score on applications, eviction rate, late-payment / NSF rate, and stable-employment percentage? A property-management company in the area should have these aggregated.
- How much new apartment / multifamily construction is in the pipeline within 1–3 miles? Heavy new supply (>2% of stock underway) typically softens rents 12–24 months out; light construction supports rent growth.
Investment metrics
- 1% rule
- 0.76% ✗
- Cap rate
- 5.67%
- Cash-on-cash
- -2.21%
- DSCR
- 0.90
- GRM
- 11.0
CMA / ARV
- ARV (median comp)
- $320,137
- List price
- $340,000
- Delta
- 6.20%
- Verdict
- FAIR
- Comps
- 3 within 1.0 mi
Projected returns pro-forma
-3.0% appreciation · 0.0% rent growth · sell at horizon
- IRR
- -23.2%
- Equity multiple
- 0.22×
- Total profit
- $-73,852
- Equity at exit
- $50,695
- IRR
- -27.6%
- Equity multiple
- -0.13×
- Total profit
- $-108,045
- Equity at exit
- $29,397
Cash invested: $95,200 (down + closing). Projections, not guarantees.
Landlord ↔ Tenant lean methodology
- Overall (STATE)
- 87 Strongly Landlord-Friendly
- State Texas
- 87 Strongly Landlord-Friendly · R+5
- County
- — inherits STATE
- City
- — inherits STATE
ZIP-level market 75235
- Home prices YoY
- -25.5%
- Rents YoY
- -0.7%
- Active inventory
- 85
- Price-to-rent
- 22.0×
Monthly cashflow live
- Estimated rent
- $2,576 medium interval (Pro) →
- Mortgage (P&I)
- −$1,783
- Tax from tax record
- −$286 /mo · $3,427/yr
- Insurance
- −$142
- HOA
- −$0
- Vacancy / Maint / Mgmt
- −$541
- Net cashflow
- $-175
Break-even live
Sensitivity live
| Price | -10% $17 | -5% $-79 | +0% $-175 | +5% $-271 | +10% $-368 |
|---|---|---|---|---|---|
| Rent | -10% $-379 | -5% $-277 | +0% $-175 | +5% $-73 | +10% $28 |
| Rate | -1.0pp $-4 | -0.5pp $-89 | base $-175 | +0.5pp $-263 | +1.0pp $-353 |
2-unit breakdown (identical units grouped — click to expand)
| Units | Beds | Baths | Est. rent |
|---|---|---|---|
| 2× units | 2 | 1 | $2,576 |
| #1 | 2 | 1 | $1,288 |
| #2 | 2 | 1 | $1,288 |
| Total (2 units) | $2,576 | ||
UW: 25.0% down · 7.5% · 30yr · 1.5% tax · 5.0% vac · 8.0% maint · 8.0% mgmt
Financing live
Cash to close
- Down payment
- $85,000
- Closing costs
- $10,200
- Reserves months
- —
- Total cash needed
- —
Loan-product check · same deal, 3 products live
Conventional
25% down · 7.5% · 30yr
- Down + closing
- —
- Monthly P&I
- —
- Monthly cashflow
- —
- DSCR
- —
- Eligible?
- —
Personal DTI + credit; lowest rate.
DSCR
20% down · 8.5% · 30yr
- Down + closing
- —
- Monthly P&I
- —
- Monthly cashflow
- —
- DSCR
- —
- Eligible?
- —
No personal income docs; deal must DSCR.
Hard money
10% down · 12.0% · 12mo
- Down + closing
- —
- Monthly P&I
- —
- Monthly cashflow
- —
- DSCR
- —
- Eligible?
- —
Short-term bridge; refi at stabilization.
Rent comps 33 comps
| Address | Beds | Baths | Sqft | Rent | $/sqft | DOM | Units | Dist |
|---|---|---|---|---|---|---|---|---|
| 7911 Wanebe Dr Dallas, TX | 1.0 | 1.0 | 612 | $1,400 | $2.29 | 44d | 1 | 0.08mi |
| 2317 Gilford St Unit B Dallas, TX | 3.0 | 2.0 | 1025 | $1,849 | $1.80 | 24d | 1 | 0.13mi |
| 2315 Gilford St Unit B Dallas, TX | 2.0 | 1.5 | 1050 | $1,625 | $1.55 | 3d | 1 | 0.13mi |
| 2515 Roanoke Ave Dallas, TX | 3.0 | 2.0 | 1123 | $2,800 | $2.49 | 24d | 1 | 0.16mi |
| 2205 Empire Central Dr Dallas, TX | 2.0 | 1.0 | 536 | $1,500 | $2.80 | 14d | 27 | 0.51mi |
| 2232 Empire Central Dallas, TX | 2.0 | 1.0–2.0 | 914 | $2,425 | $2.65 | 11d | 14 | 0.55mi |
| 2025 Empire Central Dr Unit 101 Dallas, TX | 2.0 | 2.5 | 1068 | $2,250 | $2.11 | 44d | 1 | 0.61mi |
| 2275 Hawes Ave Dallas, TX | 2.0 | 1.0–2.0 | 941 | $2,978 | $3.16 | 1d | 35 | 0.64mi |
| 2275 Hawes Ave Dallas, TX | 3.0 | 1.0–2.0 | 1079 | $2,620 | $2.43 | 17d | 37 | 0.64mi |
| 2293 Hawes Ave Dallas, TX | 2.0 | 1.0–2.5 | 1008 | $2,584 | $2.56 | 2d | 46 | 0.65mi |
| 2223 Hawes Ave Dallas, TX | 3.0 | 1.0–2.0 | 1055 | $2,333 | $2.21 | 2d | 35 | 0.67mi |
| 9777 Cedar Springs Rd Unit 9777A Dallas, TX | 1.0 | 1.0 | 1055 | $2,938 | $2.78 | 44d | 1 | 0.72mi |
| 2229 Hawes Ave Dallas, TX | 1.0 | 1.0 | 649 | $1,445 | $2.23 | 44d | 1 | 0.74mi |
| 2229 Hawes Ave Dallas, TX | 1.0 | 1.0 | 649 | $1,445 | $2.23 | 22d | 1 | 0.74mi |
| 2345 W Mockingbird Ln Dallas, TX | 1.0 | 1.0 | 649 | $1,157 | $1.78 | 44d | 1 | 0.74mi |
| 6418 Maple Ave Dallas, TX | 2.0 | 2.0 | 1108 | $1,992 | $1.80 | 1d | 4 | 0.91mi |
| 1853 W Mockingbird Ln Dallas, TX | 2.0 | 1.0 | 999 | $1,404 | $1.41 | 3d | 1 | 0.92mi |
| 6162 Maple Ave Dallas, TX | 1.0–2.0 | 1.0–2.0 | 838 | $1,799 | $2.15 | 2d | 19 | 1.15mi |
| 6014 Maple Ave Dallas, TX | 1.0 | 1.0 | 825 | $1,576 | $1.91 | 44d | 1 | 1.19mi |
| 6003 Maple Ave Dallas, TX | 1.0 | 1.0 | 711 | $1,048 | $1.47 | 44d | 1 | 1.20mi |
| 6008 Maple Ave Dallas, TX | 2.0 | 1.0–2.0 | 976 | $2,220 | $2.27 | 2d | 21 | 1.22mi |
| 5946 Forest Park Rd Dallas, TX | 2.0 | 2.0 | 1110 | $2,355 | $2.12 | 44d | 1 | 1.26mi |
| 5940 Forest Park Rd Dallas, TX | 2.0 | 1.0–2.0 | 837 | $2,720 | $3.25 | 5d | 29 | 1.27mi |
| 5959 Maple Ave Dallas, TX | 2.0 | 1.0–2.0 | 841 | $2,275 | $2.71 | 2d | 21 | 1.27mi |
| 8180 Lemmon Ave #102 Dallas, TX | 1.0 | 1.0 | 600 | $1,075 | $1.79 | 44d | 1 | 1.36mi |
| 8001 N Stemmons Fwy Unit 4231 Dallas, TX | 1.0 | 1.0 | 675 | $1,580 | $2.34 | 44d | 1 | 1.37mi |
| 5726 Forest Park Rd Dallas, TX | 2.0 | 2.0 | 944 | $1,760 | $1.86 | 44d | 1 | 1.37mi |
| 5706 Pickfair Cir Dallas, TX | 2.0 | 1.0 | 643 | $1,650 | $2.57 | 44d | 1 | 1.38mi |
| 8001 N Stemmons Fwy Dallas, TX | 2.0 | 1.0–2.0 | 945 | $2,995 | $3.17 | 3d | 31 | 1.38mi |
| 5720 Forest Park Rd Dallas, TX | 2.0 | 1.0–2.0 | 878 | $1,905 | $2.17 | 4d | 16 | 1.40mi |
| 5753 Sadler Cir Dallas, TX | 1.0 | 1.0 | 687 | $1,500 | $2.18 | 20d | 1 | 1.41mi |
| 2929 Inwood Rd Dallas, TX | 1.0 | 1.0 | 648 | $1,039 | $1.60 | 44d | 1 | 1.44mi |
| 2727 Inwood Rd Dallas, TX | 2.0 | 1.0–2.0 | 894 | $2,075 | $2.32 | 1d | 39 | 1.49mi |
Listing history 12 events
-
2026-06-18days on market $340,000 Active 21 DOM
-
2026-06-17days on market $340,000 Active 20 DOM
-
2026-06-16days on market $340,000 Active 19 DOM
-
2026-06-15days on market $340,000 Active 18 DOM
-
2026-06-13pricedays on market $340,000 Active 16 DOM
-
2026-06-09days on market $330,000 Active 12 DOM
-
2026-06-08days on market $330,000 Active 11 DOM
-
2026-06-07days on market $330,000 Active 10 DOM
-
2026-06-04remarks 699-char remark
-
2026-06-04statusdays on market $330,000 Active 7 DOM
-
2026-04-27$330,000 Active
-
2012-12-03soldstatus
ⓘ Source: listings_history table (triggers on properties + properties_extension) + one-shot
backfill from property_details.listing_events for pre-trigger history.
Tax reassessment forecast TX · Resets to sale price
- Current annual tax
- $3,427 · $286/mo
- Projected year-2 tax
- $6,222 · $518/mo
- Expected delta
- +$2,795/yr (+$233/mo · 81.5%)
ⓘ Screening estimate from a state-policy table — verify with the county assessor before closing.
Climate risk First Street
- Flood 1/10 Low FEMA zone X (unshaded) · 0% chance over 30 yrs
- Wildfire 1/10 Low
- Heat 7/10 Severe 7 d/yr ≥110°F today · 23 d/yr by 30 yrs out
- Wind 6/10 Major 27% chance of damaging wind over 30 yrs
- Air quality 3/10 Moderate 3 unhealthy d/yr today · 4 by 30 yrs out
Nearby sold comps map
Loading sold comps map…
Walkable amenities ~0.75 mi
Loading nearby amenities…
Taxation est. · year 1
- Rental income
- $30,912
- − Mortgage interest
- −$19,045
- − Property taxes
- −$3,427
- − Insurance
- −$1,700
- − Repairs & maintenance
- −$2,473
- − Management
- −$2,473
- − Depreciation
- −$9,891
- Taxable loss
- −$8,097
- Est. tax savings @ 24.0%
- +$1,943
- After-tax cash flow
- $-159/yr
For passive investors: Depreciation is non-cash, so a rental often shows a tax loss while cash-flowing — sheltering income. Rental losses are passive: they offset passive income freely, and up to $25,000/yr can offset ordinary (W-2) income if you actively participate and your MAGI is under $100k (phasing out to $0 by $150k); unused losses carry forward. On sale, claimed depreciation is recaptured at up to 25%, and gains may owe capital-gains tax (a 1031 exchange can defer both). Figures are a year-1 estimate at your 24.0% rate — not tax advice; consult a CPA.
Schools (NCES district)
- District
- Dallas ISD
- NCES district ID
- 4816230
- Math proficiency
- 31% ▼ -16.00%
- Reading proficiency
- 36% ▼ -4.00%
- Median HH income
- $42,881
- Composite
- 28.41/100
- National rank
- #6763
- State rank
- #559 of 826 in TX
Livability — Dallas
- Score
- 81/100
- State rank
- #24
- US rank
- #1380
Category grades
Schools grade is shown separately in the Schools card above.
Census & demographics
- Census place
- Dallas, TX
- County
- Dallas County · 2,612,404 people
- City population
- 1,168,437
- Metro
- Dallas-Fort Worth-Arlington, TX
- Population (ZIP)
- 19,637
- Household income
- $63,393
- Rent vs Own
- Severe rent burden
- 1427.0
Population outlook (Dallas County) Hauer SSP2
- Today (2025)
- 2,979,839 people
- By 2030
- 3,191,823 · +7.1%
- By 2040
- 3,619,611 · +21.5%
- By 2050
- 4,026,915 · +35.1%
- By 2075
- 4,957,073 · +66.4%
- By 2100
- 5,508,725 · +84.9%
Race, ethnicity, and origin ACS 2023
- Neighborhood character
- Diverse neighborhood (Simpson 0.68)
- Race & ethnicity
- Hispanic / Latino 48% White 24% Black 15% Two or more races 13% Asian 10% Native American 2%
- Hispanic origin (detail)
- Mexican 41% Puerto Rican 1%
- Common ancestry
- Italian 1% Slovak 1% Iranian 1%
- Foreign-born
- 28% · Canada, China, South Korea
- Languages at home
- 52% English-only · Spanish 39% Chinese 3% Tagalog/Filipino 2%
Political lean MEDSL · Dallas
- 2024 margin
- Strong D (+22.2) · D 60.2% · R 38.0% · Other 1.8%
- 2008→2024 swing
- +6.9pp toward D · 2008: 15.3pp · 2024: 22.2pp
- All cycles
- 2024: D+22.2 2020: D+31.6 2016: D+26.2 2012: D+15.4 2008: D+15.3
Not yet ingested
- Civics
- —
Market trends
- HPI YoY
- ▼ -106.47%
- Current HPI
- 310.5719
- Rent YoY
- ▼ -0.73%
- Metro
- Dallas-Fort Worth-Arlington, TX
- State GDP YoY
- ▲ 3.95%
- F500 in state
- 110
Industry mix (Fortune 500 HQ in TX)
| Industry | F500 HQs | Revenue |
|---|---|---|
| Energy | 16 | $1,198B |
|
||
| Technology | 5 | $198B |
|
||
| Engineering / Construction | 4 | $72B |
|
||
| Energy Services | 3 | $60B |
|
||
| Utilities | 3 | $41B |
|
||
| Healthcare | 2 | $330B |
|
||
Price history
+3.0% since first listed4 events — show timeline
- 2026-06-11 Price Changed $340,000 NTREIS
- 2026-06-04 Relisted — NTREIS
- 2026-04-27 Listed $330,000 NTREIS
- 2012-12-03 Sold (Public Records) — Public Records
Property tax history
+7.1%/yrLatest (2025): $3,427 · +0.6% YoY. Source: county tax records.
Cash-flow waterfall
monthlySold comps — $/sqft
last 12 mo · ≤1 miLoading sold comps…