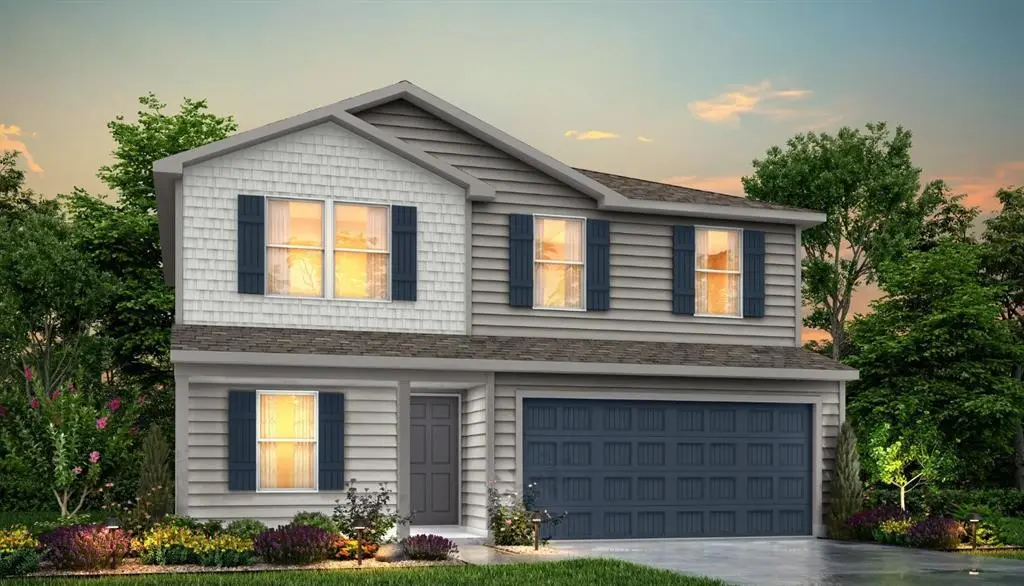
3534 Water Ridge Ct · Abilene, TX
Flood risk No data
- FEMA flood zone
- —
- Chance of flooding over 30 yrs
- —
- Est. flood insurance / yr
- —
Fire risk No data
- Est. fire insurance / yr
- —
Heat risk No data
- Hot days now (above threshold)
- —
- Hot days in 30 yrs
- —
Wind risk No data
- Chance of severe wind over 30 yrs
- —
Air-quality risk No data
- Unhealthy air days now
- —
- Unhealthy air days in 30 yrs
- —
Risk factors via First Street. Map © Google.
Why this score? — see what drove the C grade
The composite is a weighted blend of 9 inputs, each scored 0–100. Each bar is that input's sub-score; the figure is the points it added to the 100-point composite (weight × sub-score).
- Cash flow +20.6/30.0
- ARV discount +7.5/15.0
- DSCR +6.5/10.0
- 1% rule +5.4/10.0
- Rent growth +5.0/5.0
- Condition / age +5.0/5.0
- Schools +4.0/10.0
- Livability +3.8/5.0
- Appreciation +0.0/10.0
$254,990
🖨 Deal sheet 📄 Offer letter ✓ Due diligence
Listing remarks
MLS# 21237580 - Built by NHC - Aug 2026 completion! ~ Model 1804-2 B1 - Madison The Madison Plan from our Liberty Series combines style and functionality in a layout that maximizes space for your family’s needs. This 2-story home features 5 bedrooms, 3 bathrooms, a 2-car garage, and 1,804 square feet of well-designed living space. As you step inside, you’ll find a main-level bedroom and a full bathroom, offering a convenient option for guests or a home office. Beyond that, the home opens to a bright and airy living area, where the family room, dining area, and open kitchen with a central island come together seamlessly to create a welcoming space for entertainment and everyday
Key facts
- 6,534 sq ft lot
- 2 garage spots
- Built 2026
Neighborhood map
What this means for you Summary
Snapshot
- This is a 5-bed/3.0-bath single-family listed at $255k. Condition is rated excellent.
Deal economics
- At list price, monthly cash flow is $340 ($4k/yr) — positive.
- The deal already cash-flows at list — no discount required.
- Meets the 1% rule at list price ($3k rent vs $255k).
Location & tenants
- Location reads 75/100 on livability (#142 in TX, #4,037 nationally) — a middle-class / working-renter tenant base. Strengths: cost of living A+, housing A+, health & safety A+; Watch: schools D+, crime D, commute F.
- Eula ISD (rural): math 44% / reading 50% proficiency, ranked #239 of 826 in TX (top 29%) — families likely to look elsewhere, expect single-tenant / working-renter base with shorter leases.
- Market conditions: Rents rising fast (+33.5%/yr); 370 active listings in the ZIP; solid renter incomes; 11 units permitted in Callahan County in 2024 (0 in 5+ unit buildings).
- This rent runs 36% of the median local income ($90k/yr) — at the standard rent-burdened threshold; future hikes will face affordability resistance.
Forward outlook
- Local home prices are declining (-3.0%/yr); year-one equity from $2k of loan paydown is wiped out by about $8k of value loss. Plan a longer hold.
- Callahan County population projected to shrink 5% by 2050 — rents likely to lag national; underwrite the cash flow, not the appreciation.
- At projected returns (-3.0% appreciation + 8.0% rent growth), your $71k cash investment doubles in ~9 years — after that, you're playing with house money.
Negotiation context
- Only 8 days on market — expect competitive offers; lowballing is unlikely to land.
Questions for the listing agent
- Is there a deadline driving the sale (1031 exchange, divorce, estate, relocation)? That informs how much negotiation room exists.
- Schools are D-rated, which usually means shorter tenancies and higher turnover. Who's the typical renter profile here, and what's been the actual vacancy rate?
- Crime grade is D in this area — have there been break-ins, vandalism, or insurance claims at this property in the last 3 years? What carrier currently insures it and at what premium?
- What's the average days-on-market for RENTAL listings here right now (not sales)? A rising rental-DOM trend means longer vacancies and softer asking-rent achievability than the comps imply.
- What's the recent tenant-quality profile in this submarket — average credit score on applications, eviction rate, late-payment / NSF rate, and stable-employment percentage? A property-management company in the area should have these aggregated.
- How much new for-sale + rental construction is in the pipeline within 1–3 miles? Heavy new supply typically softens prices + rents 12–24 months out; constrained supply supports both.
Investment metrics
- 1% rule
- 1.04% ✓
- Cap rate
- 7.89%
- Cash-on-cash
- 5.72%
- DSCR
- 1.25
- GRM
- 8.0
CMA / ARV
No comps found within radius.
Projected returns pro-forma
-3.0% appreciation · 8.0% rent growth · sell at horizon
- IRR
- -2.0%
- Equity multiple
- 0.92×
- Total profit
- $-5,551
- Equity at exit
- $38,020
- IRR
- 12.5%
- Equity multiple
- 2.22×
- Total profit
- $87,235
- Equity at exit
- $22,047
Cash invested: $71,397 (down + closing). Projections, not guarantees.
Landlord ↔ Tenant lean methodology
- Overall (STATE)
- 87 Strongly Landlord-Friendly
- State Texas
- 87 Strongly Landlord-Friendly · R+5
- County
- — inherits STATE
- City
- — inherits STATE
ZIP-level market 79602
- Home prices YoY
- -19.6%
- Rents YoY
- 33.5%
- Active inventory
- 370
- Price-to-rent
- 8.0×
Monthly cashflow live
- Estimated rent
- $2,661 medium interval (Pro) →
- Mortgage (P&I)
- −$1,337
- Tax est. 1.5%
- −$319 /mo · $3,825/yr
- Insurance
- −$106
- HOA
- −$0
- Vacancy / Maint / Mgmt
- −$559
- Net cashflow
- $340
Break-even live
UW: 25.0% down · 7.5% · 30yr · 1.5% tax · 5.0% vac · 8.0% maint · 8.0% mgmt
Financing live
Cash to close
- Down payment
- $63,748
- Closing costs
- $7,650
- Reserves months
- —
- Total cash needed
- —
Loan-product check · same deal, 3 products live
Conventional
25% down · 7.5% · 30yr
- Down + closing
- —
- Monthly P&I
- —
- Monthly cashflow
- —
- DSCR
- —
- Eligible?
- —
Personal DTI + credit; lowest rate.
DSCR
20% down · 8.5% · 30yr
- Down + closing
- —
- Monthly P&I
- —
- Monthly cashflow
- —
- DSCR
- —
- Eligible?
- —
No personal income docs; deal must DSCR.
Hard money
10% down · 12.0% · 12mo
- Down + closing
- —
- Monthly P&I
- —
- Monthly cashflow
- —
- DSCR
- —
- Eligible?
- —
Short-term bridge; refi at stabilization.
Listing history 3 events
-
2026-04-21status Pending
-
2026-04-13price $254,990
-
2026-04-13$252,990 Active
ⓘ Source: listings_history table (triggers on properties + properties_extension) + one-shot
backfill from property_details.listing_events for pre-trigger history.
Nearby sold comps map
Loading sold comps map…
Walkable amenities ~0.75 mi
Loading nearby amenities…
Taxation est. · year 1
- Rental income
- $31,934
- − Mortgage interest
- −$14,283
- − Property taxes
- −$3,825
- − Insurance
- −$1,275
- − Repairs & maintenance
- −$2,555
- − Management
- −$2,555
- − Depreciation
- −$7,418
- Taxable income
- $23
- Est. tax owed @ 24.0%
- −$6
- After-tax cash flow
- $4,076/yr
For passive investors: Depreciation is non-cash, so a rental often shows a tax loss while cash-flowing — sheltering income. Rental losses are passive: they offset passive income freely, and up to $25,000/yr can offset ordinary (W-2) income if you actively participate and your MAGI is under $100k (phasing out to $0 by $150k); unused losses carry forward. On sale, claimed depreciation is recaptured at up to 25%, and gains may owe capital-gains tax (a 1031 exchange can defer both). Figures are a year-1 estimate at your 24.0% rate — not tax advice; consult a CPA.
Condition & rehab AI · 5 photos
This home is in excellent condition with no visible repairs or maintenance needed. It offers a modern and well-maintained living space with potential for minor updates to enhance its curb appeal and value.
Value-add opportunities
- Both Painting the exterior and interior walls — Fresh paint can enhance curb appeal and interior aesthetics
- Both Landscaping improvements — Enhanced landscaping can improve curb appeal and attract potential buyers
- Resale Upgrading the kitchen appliances — Modern appliances can increase the home's appeal to potential buyers
- Both Adding smart home features — Smart home features can increase convenience and appeal to potential buyers
Renovation cost estimate screening
Value-add ROI direction
- Both Painting the exterior and interior walls — Fresh paint can enhance curb appeal and interior aesthetics ↑
- Both Landscaping improvements — Enhanced landscaping can improve curb appeal and attract potential buyers ↑
- Resale Upgrading the kitchen appliances — Modern appliances can increase the home's appeal to potential buyers ↑
- Both Adding smart home features — Smart home features can increase convenience and appeal to potential buyers ↑
ⓘ Cost ranges are severity-bucket heuristics (US national rule-of-thumb). Get contractor quotes + a written scope before underwriting a rehab budget.
Schools (NCES district)
- District
- Eula ISD
- NCES district ID
- 4818690
- Math proficiency
- 44% ▼ -12.00%
- Reading proficiency
- 50% ▼ -6.00%
- Median HH income
- $46,825
- Composite
- 39.98/100
- National rank
- #3835
- State rank
- #239 of 826 in TX
Livability — Abilene
- Score
- 75/100
- State rank
- #142
- US rank
- #4037
Category grades
Schools grade is shown separately in the Schools card above.
Census & demographics
- County
- Taylor County · 136,672 people
- City population
- 136,672
- Metro
- Abilene, TX
- Population (ZIP)
- 27,425
- Household income
- $89,551
- Rent vs Own
- Severe rent burden
- 338.0
Population outlook (Callahan County) Hauer SSP2
- Today (2025)
- 13,664 people
- By 2030
- 13,578 · -0.6%
- By 2040
- 13,283 · -2.8%
- By 2050
- 13,008 · -4.8%
- By 2075
- 12,354 · -9.6%
- By 2100
- 11,326 · -17.1%
Race, ethnicity, and origin ACS 2023
- Neighborhood character
- Majority White (64%)
- Race & ethnicity
- White 64% Hispanic / Latino 22% Two or more races 12% Black 10% Asian 2%
- Hispanic origin (detail)
- Mexican 19%
- Common ancestry
- Romanian 2% Italian 2% Portuguese 2%
- Foreign-born
- 6% · Canada, Vietnam, Jamaica
- Languages at home
- 87% English-only · Spanish 9% Other Asian/Pacific 1% French/Haitian/Cajun 1%
Political lean MEDSL · Callahan
- 2024 margin
- Solid R (+77.6) · D 10.9% · R 88.5%
- 2008→2024 swing
- -15.9pp toward R · 2008: -61.7pp · 2024: -77.6pp
- All cycles
- 2024: R+77.6 2020: R+77.3 2016: R+77.2 2012: R+69.8 2008: R+61.7
Not yet ingested
- Civics
- —
Market trends
- HPI YoY
- ▼ -46.04%
- Current HPI
- 189.3098
- Rent YoY
- ▲ 33.46%
- Metro
- Abilene, TX
- State GDP YoY
- ▲ 3.95%
- F500 in state
- 110
Industry mix (Fortune 500 HQ in TX)
| Industry | F500 HQs | Revenue |
|---|---|---|
| Energy | 16 | $1,198B |
|
||
| Technology | 5 | $198B |
|
||
| Engineering / Construction | 4 | $72B |
|
||
| Energy Services | 3 | $60B |
|
||
| Utilities | 3 | $41B |
|
||
| Healthcare | 2 | $330B |
|
||
Price history
+0.8% since first listed3 events — show timeline
- 2026-04-21 Pending — NTREIS
- 2026-04-13 Price Changed $254,990 NTREIS
- 2026-04-13 Listed $252,990 NTREIS
Cash-flow waterfall
monthlySold comps — $/sqft
last 12 mo · ≤1 miLoading sold comps…