24405 Highway 80 · Danville, AR
Flood risk 1/10 · Minimal
- FEMA flood zone
- X (unshaded)
- Chance of flooding over 30 yrs
- 0.0%
- Est. flood insurance / yr
- $507 – $1,088
Fire risk 5/10 · Moderate
- Est. fire insurance / yr
- $1,499 – $2,785
Heat risk 6/10 · Moderate
- Hot days now (above 113°F)
- 7 days/yr
- Hot days in 30 yrs
- 21 days/yr
Wind risk 2/10 · Minimal
- Chance of severe wind over 30 yrs
- 4.0%
Air-quality risk 1/10 · Minimal
- Unhealthy air days now
- 0 days/yr
- Unhealthy air days in 30 yrs
- 0 days/yr
Risk factors via First Street. Map © Google.
Why this score? — see what drove the F grade
The composite is a weighted blend of 9 inputs, each scored 0–100. Each bar is that input's sub-score; the figure is the points it added to the 100-point composite (weight × sub-score).
- ARV discount +7.5/15.0
- Cash flow +6.8/30.0
- Appreciation +5.0/10.0
- Livability +3.8/5.0
- Schools +3.7/10.0
- Rent growth +2.5/5.0
- Condition / age +2.5/5.0
- 1% rule +1.8/10.0
- DSCR +1.0/10.0
$149,500
🖨 Deal sheet (PDF) 📄 Offer letter ✓ Due diligence
Listing remarks
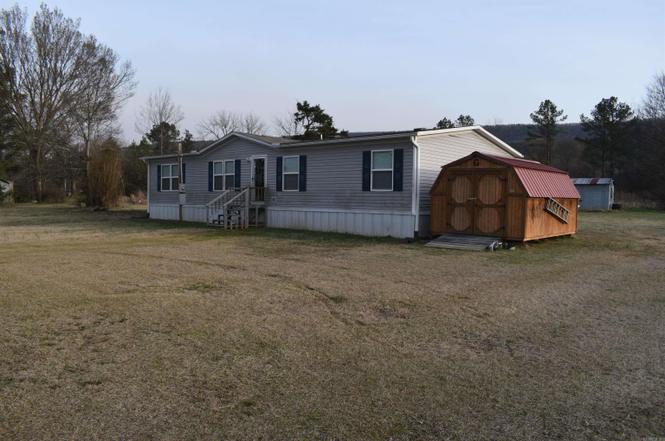
If you’ve been looking for a quiet country home with a few acres, you don’t want to miss this great Yell County Property! Located fifteen minutes west of Danville on Highway 80, this 1680 +/- square foot mobile home sits on 3 +/- acres. The three bed two bath home has a spacious kitchen along with two large living areas. The home has its own well, and is wired with high speed fiberoptic internet. There is a storage building nearby the home that conveys with the property as well. If you’re looking for acreage to grow a garden, raise a few animals, or just space to enjoy the beautiful Ouachita Mountain Range, you’re sure to love the land that this property has to offer
Key facts
- Storage building
- Abundant shade trees
- Three acres
Tags
Neighborhood map
What this means for you Summary
Snapshot
- This is a 3-bed/2.0-bath manufactured listed at $150k.
Deal economics
- At list price, monthly cash flow is $-234 ($-3k/yr) — negative.
- To cash-flow at today's rent, offer at most $116k (22.6% below list).
- To meet the 1% rule (rent ≥ 1% of price), the offer needs to be $101k (32.3% below list).
- Recommended offer: $101k (32.3% below list) — sets the bar for 1% rule.
Location & tenants
- Location reads 75/100 on livability (#14 in AR, #4,201 nationally) — a middle-class / working-renter tenant base. Strengths: cost of living A+, housing A+, health & safety A+; Watch: amenities F, commute F.
- Danville School District (rural): math 43% / reading 44% proficiency, ranked #46 of 238 in AR (top 19%) — families likely to look elsewhere, expect single-tenant / working-renter base with shorter leases; 67% free/reduced lunch — lower-income household profile, screen leases tightly.
- Zoned schools: S.C. Tucker Elementary School (math 62% / reading 42%, grade C-, #77 of 454 statewide, top 19%, 331 students, 76% FRL); Danville Middle School (math 41% / reading 41%, grade F, #83 of 201 statewide, top 44%, 211 students, 80% FRL); Danville High School (math 27% / reading 47%, grade F, #64 of 292 statewide, top 26%, 245 students, 71% FRL).
- Market conditions: 28 active listings in the ZIP; 10 units permitted in Yell County in 2024 (0 in 5+ unit buildings).
Forward outlook
- In year one you build about $6k of equity ($1k loan paydown + $4k appreciation (3.0% local appreciation)).
- Yell County population projected at -24% by 2050 — secular population decline; favor cash flow + early exit over multi-decade hold.
- By year 7, paydown + projected appreciation supports a ~$35k cash-out refi (75% LTV) — recoverable capital for the next deal without selling this one.
Negotiation context
- It's been on market 32 days — a 3% lower offer ($145k) is reasonable based on typical stale-listing flexibility.
Risks & watch-outs
- Climate carrying-cost: moderate wildfire risk; extreme-heat days projected 7→21/yr by 2055 (HVAC capex compounding) — expect insurance premiums to compound above CPI over the hold.
Questions for the listing agent
- What do current leases actually rent for vs. the listed asking? Can we see a recent rent roll and the last 12 months of T-12 income?
- It's been on market 32 days. Have you received any prior offers? Is the seller open to a 32% concession, seller financing, or rate buy-down credit?
- Is there a deadline driving the sale (1031 exchange, divorce, estate, relocation)? That informs how much negotiation room exists.
- The area grade is low — what's the realistic commute time and amenity access for the typical tenant pool here? Any planned neighborhood developments (good or bad) we should know about?
- What's the average days-on-market for RENTAL listings here right now (not sales)? A rising rental-DOM trend means longer vacancies and softer asking-rent achievability than the comps imply.
- What's the recent tenant-quality profile in this submarket — average credit score on applications, eviction rate, late-payment / NSF rate, and stable-employment percentage? A property-management company in the area should have these aggregated.
- How much new for-sale + rental construction is in the pipeline within 1–3 miles? Heavy new supply typically softens prices + rents 12–24 months out; constrained supply supports both.
Investment metrics
- 1% rule
- 0.68% ✗
- Cap rate
- 4.42%
- Cash-on-cash
- -6.70%
- DSCR
- 0.70
- GRM
- 12.3
CMA / ARV
No comps found within radius.
Projected returns pro-forma
3.0% appreciation · 3.0% rent growth · sell at horizon
- IRR
- 1.3%
- Equity multiple
- 1.08×
- Total profit
- $3,149
- Equity at exit
- $67,222
- IRR
- 5.0%
- Equity multiple
- 1.77×
- Total profit
- $32,101
- Equity at exit
- $103,597
Cash invested: $41,860 (down + closing). Projections, not guarantees.
Landlord ↔ Tenant lean methodology
- Overall (STATE)
- 92 Strongly Landlord-Friendly
- State Arkansas
- 92 Strongly Landlord-Friendly · R+14
- County
- — inherits STATE
- City
- — inherits STATE
ZIP-level market 72833
- Active inventory
- 28
- Price-to-rent
- 12.3×
Monthly cashflow live
- Estimated rent
- $1,012 medium interval (Pro) →
- Mortgage (P&I)
- −$784
- Tax est. 1.5%
- −$187 /mo · $2,242/yr
- Insurance
- −$62
- HOA
- −$0
- Vacancy / Maint / Mgmt
- −$213
- Net cashflow
- $-234
Break-even live
Sensitivity live
| Price | -10% $-130 | -5% $-182 | +0% $-234 | +5% $-285 | +10% $-337 |
|---|---|---|---|---|---|
| Rent | -10% $-314 | -5% $-274 | +0% $-234 | +5% $-194 | +10% $-154 |
| Rate | -1.0pp $-158 | -0.5pp $-196 | base $-234 | +0.5pp $-272 | +1.0pp $-312 |
UW: 25.0% down · 7.5% · 30yr · 1.5% tax · 5.0% vac · 8.0% maint · 8.0% mgmt
Financing live
Cash to close
- Down payment
- $37,375
- Closing costs
- $4,485
- Reserves months
- —
- Total cash needed
- —
Loan-product check · same deal, 3 products live
Conventional
25% down · 7.5% · 30yr
- Down + closing
- —
- Monthly P&I
- —
- Monthly cashflow
- —
- DSCR
- —
- Eligible?
- —
Personal DTI + credit; lowest rate.
DSCR
20% down · 8.5% · 30yr
- Down + closing
- —
- Monthly P&I
- —
- Monthly cashflow
- —
- DSCR
- —
- Eligible?
- —
No personal income docs; deal must DSCR.
Hard money
10% down · 12.0% · 12mo
- Down + closing
- —
- Monthly P&I
- —
- Monthly cashflow
- —
- DSCR
- —
- Eligible?
- —
Short-term bridge; refi at stabilization.
Listing history 2 events
-
2026-04-06status Under Contract
-
2026-03-05$149,500 New Listing
ⓘ Source: listings_history table (triggers on properties + properties_extension) + one-shot
backfill from property_details.listing_events for pre-trigger history.
Climate risk First Street
- Flood 1/10 Low FEMA zone X (unshaded) · 0% chance over 30 yrs
- Wildfire 5/10 Major
- Heat 6/10 Major 7 d/yr ≥113°F today · 21 d/yr by 30 yrs out
- Wind 2/10 Low 4% chance of damaging wind over 30 yrs
- Air quality 1/10 Low 0 unhealthy d/yr today · 0 by 30 yrs out
Nearby sold comps map
Loading sold comps map…
Walkable amenities ~0.75 mi
Loading nearby amenities…
Taxation est. · year 1
- Rental income
- $12,146
- − Mortgage interest
- −$8,374
- − Property taxes
- −$2,242
- − Insurance
- −$748
- − Repairs & maintenance
- −$972
- − Management
- −$972
- − Depreciation
- −$4,349
- Taxable loss
- −$5,511
- Est. tax savings @ 24.0%
- +$1,323
- After-tax cash flow
- $-1,480/yr
For passive investors: Depreciation is non-cash, so a rental often shows a tax loss while cash-flowing — sheltering income. Rental losses are passive: they offset passive income freely, and up to $25,000/yr can offset ordinary (W-2) income if you actively participate and your MAGI is under $100k (phasing out to $0 by $150k); unused losses carry forward. On sale, claimed depreciation is recaptured at up to 25%, and gains may owe capital-gains tax (a 1031 exchange can defer both). Figures are a year-1 estimate at your 24.0% rate — not tax advice; consult a CPA.
Schools (NCES district)
- District
- Danville School District
- NCES district ID
- 0504890
- Math proficiency
- 43% ▼ -8.00%
- Reading proficiency
- 44% ▼ -7.00%
- Median HH income
- $41,295
- Composite
- 36.57/100
- National rank
- #4634
- State rank
- #46 of 238 in AR
Livability — Danville
- Score
- 75/100
- State rank
- #14
- US rank
- #4201
Category grades
Schools grade is shown separately in the Schools card above.
Census & demographics
- Population (ZIP)
- 3,432
Population outlook (Yell County) Hauer SSP2
- Today (2025)
- 20,438 people
- By 2030
- 19,561 · -4.3%
- By 2040
- 17,654 · -13.6%
- By 2050
- 15,569 · -23.8%
- By 2075
- 10,746 · -47.4%
- By 2100
- 6,907 · -66.2%
Race, ethnicity, and origin ACS 2023
- Neighborhood character
- Majority White (58%)
- Race & ethnicity
- White 58% Hispanic / Latino 40% Two or more races 8% Native American 2%
- Hispanic origin (detail)
- Mexican 25% Puerto Rican 12%
- Common ancestry
- Slovak 1% Iranian 1% Serbian 1%
- Foreign-born
- 15% · Canada
- Languages at home
- 66% English-only · Spanish 34%
Political lean MEDSL · Yell
- 2024 margin
- Solid R (+60.7) · D 18.7% · R 79.5% · Other 1.8%
- 2008→2024 swing
- -30.8pp toward R · 2008: -29.9pp · 2024: -60.7pp
- All cycles
- 2024: R+60.7 2020: R+58.5 2016: R+49.0 2012: R+38.9 2008: R+29.9
Not yet ingested
- Civics
- —
Market trends
- HPI YoY
- —
- Current HPI
- —
- Rent YoY
- —
- Metro
- —
- State GDP YoY
- ▲ 3.80%
- F500 in state
- 10
Industry mix (Fortune 500 HQ in AR)
| Industry | F500 HQs | Revenue |
|---|---|---|
| Retail | 1 | $681B |
|
||
| Food / Agriculture | 1 | $53B |
|
||
| Retail / Energy | 1 | $22B |
|
||
| Transportation / Logistics | 1 | $12B |
|
||
| Energy | 1 | $4B |
|
||
Price history
2 events — show timeline
- 2026-04-06 Pending — CARMLS
- 2026-03-05 Listed $149,500 CARMLS
Property tax history
-1.4%/yrLatest (2016): $66 · -11.8% YoY. Source: county tax records.
Cash-flow waterfall
monthlySold comps — $/sqft
last 12 mo · ≤1 miLoading sold comps…