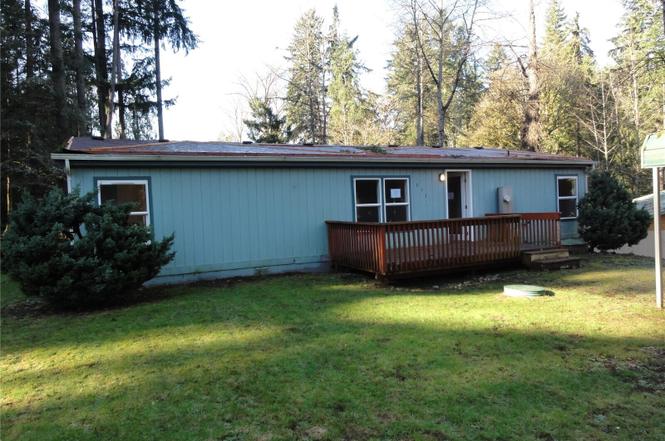
8331 Daphne Ct SE · North Yelm, WA
Flood risk 6/10 · Moderate
- FEMA flood zone
- X (unshaded)
- Chance of flooding over 30 yrs
- 0.71%
- Est. flood insurance / yr
- $507 – $1,088
Fire risk 4/10 · Minor
- Est. fire insurance / yr
- $604 – $1,122
Heat risk 3/10 · Minor
- Hot days now (above 87°F)
- 7 days/yr
- Hot days in 30 yrs
- 14 days/yr
Wind risk 1/10 · Minimal
- Chance of severe wind over 30 yrs
- —
Air-quality risk 6/10 · Moderate
- Unhealthy air days now
- 7 days/yr
- Unhealthy air days in 30 yrs
- 9 days/yr
Risk factors via First Street. Map © Google.
Why this score? — see what drove the B- grade
The composite is a weighted blend of 9 inputs, each scored 0–100. Each bar is that input's sub-score; the figure is the points it added to the 100-point composite (weight × sub-score).
- Cash flow +22.6/30.0
- ARV discount +15.0/15.0
- DSCR +7.3/10.0
- 1% rule +5.7/10.0
- Schools +4.8/10.0
- Rent growth +3.9/5.0
- Livability +3.4/5.0
- Condition / age +2.5/5.0
- Appreciation +0.0/10.0
$265,000
🖨 Deal sheet 📄 Offer letter ✓ Due diligence
Listing remarks
Wow! Great opportunity. Manufactured double-wide home offering approximately 1,296 sq ft with 3 bedrooms and 2 baths, located in the established Nisqually Pines community. The well-designed and functional floor plan features a private primary bedroom on one side of the home, while two additional bedrooms and bathroom are located on the opposite side, providing ideal separation for living, guests, or home office space. Spacious living and dining areas create a comfortable and inviting setting for everyday living and gatherings. The kitchen and bathrooms have recently been updated. A covered two-car carport offers convenient parking and added storage options. Nisqually Pines HOA amenities inc
Key facts
- Community pool
- Updated bathrooms
- Updated kitchen
Tags
Property features AI
Finance
- Financial info: Listing terms: Cash
- HOA & community: HOA: Nisqually Pines; $87 monthly HOA fee; HOA covers common area maintenance, road maintenance and water
Exterior
- Parking: Detached carport; 2 covered spaces; 2 uncovered spaces
- Utilities: Electric service; Community water; Septic tank sewer
- Home design: Manufactured double-wide home on land; One story; South-facing
- Construction: Wood construction; Composition (shingle) roof; Tie-down foundation; Effective year built 2023
- Exterior features: Wood products siding; Located on a cul-de-sac
Interior
- Kitchen: Kitchen with eating space
- Bedrooms: 3 bedrooms (all on the main level); Primary bedroom on the main level
- Flooring: Laminate; Vinyl; Carpet
- Bathrooms: 2 full bathrooms (both on the main level); Each full bathroom includes a tub and a shower
- Heating & cooling: Forced air heating; No cooling system
- Interior features: Ceiling fans; Vaulted ceilings; Walk-in closets
- Laundry & utility: Utility room on the main level
Neighborhood map
What this means for you Summary
Snapshot
- This is a 3-bed/2.0-bath manufactured listed at $265k.
Deal economics
- At list price, monthly cash flow is $452 ($5k/yr) — positive.
- The deal already cash-flows at list — no discount required.
- Meets the 1% rule at list price ($3k rent vs $265k).
- Recommended offer: $241k (9.0% below list) — sets the bar for market timing.
- Cap rate 8.3% vs local median 4.4% in North Yelm — top-decile yield for the area; either an underpriced asset or a hidden risk that comps aren't pricing in. Stress-test before assuming the spread holds.
Location & tenants
- Location reads 68/100 on livability (#277 in WA) — a middle-class / working-renter tenant base. Strengths: housing A+, cost of living A, crime B; Watch: health & safety C-, commute D+, schools F.
- Yelm School District (rural): math 48% / reading 59% proficiency, ranked #108 of 291 in WA (top 37%) — acceptable for families but not a draw, mixed tenant base, ~2y average lease.
- Market conditions: Rents rising fast (+5.8%/yr); 431 active listings in the ZIP; 2 comparable units currently listed for rent nearby; solid renter incomes; 1,222 units permitted in Thurston County in 2024 (508 in 5+ unit buildings).
- This rent runs 37% of the median local income ($92k/yr) — at the standard rent-burdened threshold; future hikes will face affordability resistance.
Forward outlook
- Local home prices are declining (-3.0%/yr); year-one equity from $2k of loan paydown is wiped out by about $8k of value loss. Plan a longer hold.
- Thurston County population projected at +27% by 2050 — long-run rental-demand tailwind backs the buy-and-hold thesis.
- At projected returns (-3.0% appreciation + 5.8% rent growth), your $74k cash investment doubles in ~10 years — after that, you're playing with house money.
Negotiation context
- It's been on market 98 days — a 9% lower offer ($241k) is reasonable based on typical stale-listing flexibility.
- 5 sale attempts since 4y ago; this cycle's ask has dropped $25k (9%) from the opening price — seller is motivated, your offer sets the floor, not the list.
Risks & watch-outs
- Climate carrying-cost: major flood risk — expect insurance premiums to compound above CPI over the hold.
Questions for the listing agent
- It's been on market 98 days. Have you received any prior offers? Is the seller open to a 9% concession, seller financing, or rate buy-down credit?
- What does the HOA fee cover, when was the last increase, and are there any pending special assessments or reserve-fund shortfalls?
- Why hasn't it sold? Are there any deal-killer items the seller is aware of (foundation, flood, title, zoning, code violations)?
- Is there a deadline driving the sale (1031 exchange, divorce, estate, relocation)? That informs how much negotiation room exists.
- Schools are F-rated, which usually means shorter tenancies and higher turnover. Who's the typical renter profile here, and what's been the actual vacancy rate?
- What's the average days-on-market for RENTAL listings here right now (not sales)? A rising rental-DOM trend means longer vacancies and softer asking-rent achievability than the comps imply.
- What's the recent tenant-quality profile in this submarket — average credit score on applications, eviction rate, late-payment / NSF rate, and stable-employment percentage? A property-management company in the area should have these aggregated.
- How much new for-sale + rental construction is in the pipeline within 1–3 miles? Heavy new supply typically softens prices + rents 12–24 months out; constrained supply supports both.
Investment metrics
- 1% rule
- 1.07% ✓
- Cap rate
- 8.34%
- Cash-on-cash
- 7.32%
- DSCR
- 1.33
- GRM
- 7.8
CMA / ARV
- ARV (on-the-fly)
- $386,208
- Comps found
- 12
Show comp detail 12 sales within ~0.75 mi
| Address | Dist | Beds/Ba | Sqft | Sold | Price | $/sf | Match |
|---|---|---|---|---|---|---|---|
| 8331 Daphne Ct SE | 0.00mi | 3/2.0 | 1,296 (0%) | 0mo | $258,000 | $199 | 100 |
| 17148 Heather Ln SE | 0.12mi | 3/2.0 | 1,288 (-1%) | 11mo | $366,000 | $284 | 84 |
| 8517 Thuja Ave SE | 0.35mi | 3/2.0 | 1,344 (+4%) | 2mo | $363,000 | $270 | 76 |
| 8924 Mulberry Ct SE | 0.61mi | 3/2.0 | 1,296 (0%) | 1mo | $439,950 | $339 | 71 |
| 8439 Pepperidge Ln SE | 0.35mi | 3/2.0 | 1,404 (+8%) | 2mo | $339,900 | $242 | 68 |
| 8628 Thuja Ave SE | 0.45mi | 3/2.0 | 1,232 (-5%) | 9mo | $367,500 | $298 | 63 |
| 16831 Cornus Ct SE | 0.40mi | 2/2.0 (-1) | 1,344 (+4%) | 10mo | $390,000 | $290 | 62 |
| 17242 Heather Ln SE | 0.31mi | 3/2.0 | 1,120 (-14%) | 2mo | $243,000 | $217 | 61 |
| 8918 Mulberry Ct SE | 0.62mi | 3/2.0 | 1,176 (-9%) | 4mo | $412,000 | $350 | 53 |
| 8725 Pepperidge Ln SE | 0.61mi | 2/2.0 (-1) | 1,161 (-10%) | 1mo | $357,000 | $307 | 48 |
| 8517 Pepperidge Ln SE | 0.40mi | 2/2.0 (-1) | 1,116 (-14%) | 7mo | $336,500 | $302 | 48 |
| 8715 Whitewood Loop SE | 0.58mi | 3/2.0 | 1,152 (-11%) | 10mo | $360,000 | $313 | 46 |
Match score weights: distance 35% · size 25% · config 20% · recency 20%. Top-matched comps best support the ARV.
Projected returns pro-forma
-3.0% appreciation · 5.78% rent growth · sell at horizon
- IRR
- -2.1%
- Equity multiple
- 0.92×
- Total profit
- $-5,952
- Equity at exit
- $39,512
- IRR
- 10.4%
- Equity multiple
- 1.91×
- Total profit
- $67,423
- Equity at exit
- $22,912
Cash invested: $74,200 (down + closing). Projections, not guarantees.
Landlord ↔ Tenant lean methodology
- Overall (STATE)
- 28 Tenant-Leaning
- State Washington
- 28 Tenant-Leaning · D+8
- County
- — inherits STATE
- City
- — inherits STATE
ZIP-level market 98597
- Rents YoY
- 5.8%
- Active inventory
- 431
- Price-to-rent
- 7.8×
Monthly cashflow live
- Estimated rent
- $2,837 medium interval (Pro) →
- Mortgage (P&I)
- −$1,390
- Tax from tax record
- −$202 /mo · $2,419/yr
- Insurance
- −$110
- HOA
- −$87
- Vacancy / Maint / Mgmt
- −$596
- Net cashflow
- $452
Break-even live
UW: 25.0% down · 7.5% · 30yr · 1.5% tax · 5.0% vac · 8.0% maint · 8.0% mgmt
Financing live
Cash to close
- Down payment
- $66,250
- Closing costs
- $7,950
- Reserves months
- —
- Total cash needed
- —
Loan-product check · same deal, 3 products live
Conventional
25% down · 7.5% · 30yr
- Down + closing
- —
- Monthly P&I
- —
- Monthly cashflow
- —
- DSCR
- —
- Eligible?
- —
Personal DTI + credit; lowest rate.
DSCR
20% down · 8.5% · 30yr
- Down + closing
- —
- Monthly P&I
- —
- Monthly cashflow
- —
- DSCR
- —
- Eligible?
- —
No personal income docs; deal must DSCR.
Hard money
10% down · 12.0% · 12mo
- Down + closing
- —
- Monthly P&I
- —
- Monthly cashflow
- —
- DSCR
- —
- Eligible?
- —
Short-term bridge; refi at stabilization.
Rent comps 2 comps
| Address | Beds | Baths | Sqft | Rent | $/sqft | DOM | Units | Dist |
|---|---|---|---|---|---|---|---|---|
| 8740 Boxwood Ct SE Yelm, WA | 3.0 | 2.0 | 1200 | $2,600 | $2.17 | 12d | 1 | 0.36mi |
| 16207 83rd Ct SE Yelm, WA | 3.0 | 1.5 | 1534 | $2,400 | $1.56 | 20d | 1 | 0.71mi |
HOA detail
- Monthly dues
- $87 · $1,044/yr
Listing history 14 events
-
2026-05-04status Pending
-
2026-03-31price $265,000
-
2026-02-28price $276,000
-
2026-01-26$290,000 Active
-
2024-09-07historical $2,100
-
2024-08-14$2,100
-
2024-08-07historical $2,100
-
2024-08-01$2,100
-
2023-09-24historical $1,900
-
2023-09-15$1,900
-
2022-09-19soldstatus $340,000 Closed
-
2022-08-17status Pending
-
2022-08-14price $339,950
-
2022-08-05$359,950 Active
ⓘ Source: listings_history table (triggers on properties + properties_extension) + one-shot
backfill from property_details.listing_events for pre-trigger history.
Tax reassessment forecast WA · Resets to sale price
- Current annual tax
- $2,419 · $202/mo
- Projected year-2 tax
- $2,597 · $216/mo
- Expected delta
- +$178/yr (+$15/mo · 7.3%)
ⓘ Screening estimate from a state-policy table — verify with the county assessor before closing.
Climate risk First Street
- Flood 6/10 Major FEMA zone X (unshaded) · 71% chance over 30 yrs
- Wildfire 4/10 Moderate
- Heat 3/10 Moderate 7 d/yr ≥87°F today · 14 d/yr by 30 yrs out
- Wind 1/10 Low
- Air quality 6/10 Major 7 unhealthy d/yr today · 9 by 30 yrs out
Nearby sold comps map
Loading sold comps map…
Walkable amenities ~0.75 mi
Loading nearby amenities…
Taxation est. · year 1
- Rental income
- $34,043
- − Mortgage interest
- −$14,844
- − Property taxes
- −$2,419
- − Insurance
- −$1,325
- − Repairs & maintenance
- −$2,723
- − Management
- −$2,723
- − HOA
- −$1,044
- − Depreciation
- −$7,709
- Taxable income
- $1,255
- Est. tax owed @ 24.0%
- −$301
- After-tax cash flow
- $5,128/yr
For passive investors: Depreciation is non-cash, so a rental often shows a tax loss while cash-flowing — sheltering income. Rental losses are passive: they offset passive income freely, and up to $25,000/yr can offset ordinary (W-2) income if you actively participate and your MAGI is under $100k (phasing out to $0 by $150k); unused losses carry forward. On sale, claimed depreciation is recaptured at up to 25%, and gains may owe capital-gains tax (a 1031 exchange can defer both). Figures are a year-1 estimate at your 24.0% rate — not tax advice; consult a CPA.
Schools (NCES district)
- District
- Yelm School District
- NCES district ID
- 5310140
- Math proficiency
- 48% ▲ 1.00%
- Reading proficiency
- 59% ▲ 1.00%
- Median HH income
- $58,328
- Composite
- 48.34/100
- National rank
- #4685
- State rank
- #108 of 291 in WA
Livability — North Yelm
- Score
- 68/100
- State rank
- #277
- US rank
- #9538
Category grades
Schools grade is shown separately in the Schools card above.
Census & demographics
- Census place
- North Yelm, WA
- County
- Thurston County · 269,345 people
- Metro
- Olympia-Lacey-Tumwater, WA
- Population (ZIP)
- 26,669
- Household income
- $92,219
- Rent vs Own
- Severe rent burden
- 259.0
Population outlook (Thurston County) Hauer SSP2
- Today (2025)
- 308,239 people
- By 2030
- 326,483 · +5.9%
- By 2040
- 359,890 · +16.8%
- By 2050
- 391,800 · +27.1%
- By 2075
- 468,024 · +51.8%
- By 2100
- 519,890 · +68.7%
Race, ethnicity, and origin ACS 2023
- Neighborhood character
- Predominantly White (76%)
- Race & ethnicity
- White 76% Two or more races 10% Hispanic / Latino 10% Black 3% Pacific Islander 2% Asian 2%
- Hispanic origin (detail)
- Mexican 7% Puerto Rican 1%
- Common ancestry
- Portuguese 5% Romanian 4% Lithuanian 3%
- Foreign-born
- 7% · Canada, South Korea
- Languages at home
- 90% English-only · Spanish 6% German/W. Germanic 1% Other Asian/Pacific 1%
Political lean MEDSL · Thurston
- 2024 margin
- Strong D (+20.4) · D 58.5% · R 38.1% · Other 3.5%
- 2008→2024 swing
- -1.3pp toward R · 2008: 21.7pp · 2024: 20.4pp
- All cycles
- 2024: D+20.4 2020: D+18.6 2016: D+15.4 2012: D+19.0 2008: D+21.7
Not yet ingested
- Civics
- —
Market trends
- HPI YoY
- ▼ -192.07%
- Current HPI
- 326.4361
- Rent YoY
- ▲ 5.78%
- Metro
- Olympia-Lacey-Tumwater, WA
- State GDP YoY
- ▲ 4.65%
- F500 in state
- 22
Industry mix (Fortune 500 HQ in WA)
| Industry | F500 HQs | Revenue |
|---|---|---|
| Retail | 2 | $269B |
|
||
| Technology / Retail | 1 | $638B |
|
||
| Technology | 1 | $245B |
|
||
| Telecommunications | 1 | $38B |
|
||
| Food / Beverage | 1 | $36B |
|
||
| Automotive / Trucks | 1 | $34B |
|
||
Price history
-26.4% since first listed14 events — show timeline
- 2026-05-04 Pending — NWMLS as Distributed by MLS Grid
- 2026-03-31 Price Changed $265,000 NWMLS as Distributed by MLS Grid
- 2026-02-28 Price Changed $276,000 NWMLS as Distributed by MLS Grid
- 2026-01-26 Listed $290,000 NWMLS as Distributed by MLS Grid
- 2024-09-07 Rental Removed $2,100 APPFOLIO
- 2024-08-14 Listed for Rent $2,100 APPFOLIO
- 2024-08-07 Rental Removed $2,100 APPFOLIO
- 2024-08-01 Listed for Rent $2,100 APPFOLIO
- 2023-09-24 Rental Removed $1,900 APPFOLIO
- 2023-09-15 Listed for Rent $1,900 APPFOLIO
- 2022-09-19 Sold (MLS) $340,000 NWMLS as Distributed by MLS Grid
- 2022-08-17 Pending — NWMLS as Distributed by MLS Grid
- 2022-08-14 Price Changed $339,950 NWMLS as Distributed by MLS Grid
- 2022-08-05 Listed $359,950 NWMLS as Distributed by MLS Grid
Property tax history
+4.4%/yrLatest (2026): $2,419 · -13.8% YoY. Source: county tax records.
Cash-flow waterfall
monthlySold comps — $/sqft
last 12 mo · ≤1 miLoading sold comps…