21042 Holmes Dr · Central, LA
Flood risk 1/10 · Minimal
- FEMA flood zone
- AE
- Chance of flooding over 30 yrs
- 0.0%
- Est. flood insurance / yr
- $1,737 – $8,500
Fire risk 3/10 · Minor
- Est. fire insurance / yr
- $1,269 – $2,357
Heat risk 8/10 · Major
- Hot days now (above 108°F)
- 7 days/yr
- Hot days in 30 yrs
- 20 days/yr
Wind risk 9/10 · Severe
- Chance of severe wind over 30 yrs
- 99.0%
Air-quality risk 3/10 · Minor
- Unhealthy air days now
- 2 days/yr
- Unhealthy air days in 30 yrs
- 3 days/yr
Risk factors via First Street. Map © Google.
Why this score? — see what drove the C+ grade
The composite is a weighted blend of 9 inputs, each scored 0–100. Each bar is that input's sub-score; the figure is the points it added to the 100-point composite (weight × sub-score).
- Cash flow +30.0/30.0
- DSCR +10.0/10.0
- 1% rule +9.0/10.0
- Schools +4.6/10.0
- Livability +3.7/5.0
- Rent growth +3.5/5.0
- Condition / age +2.5/5.0
- ARV discount +0.0/15.0
- Appreciation +0.0/10.0
$123,000
🖨 Deal sheet 📄 Offer letter ✓ Due diligence
Listing remarks MLS
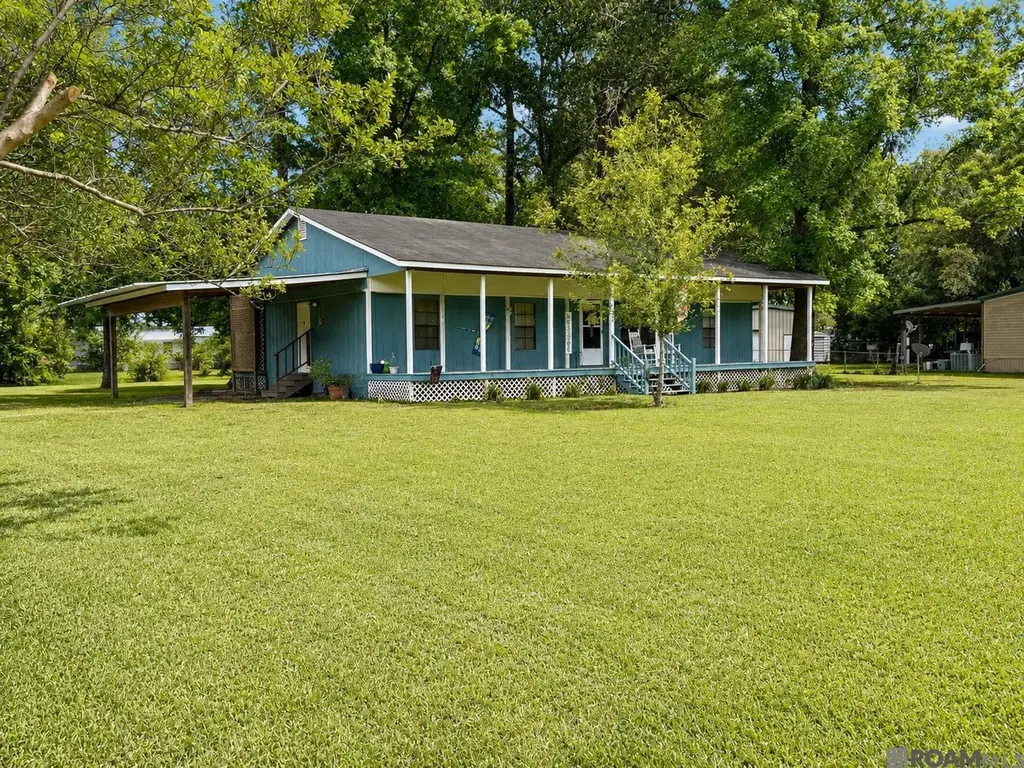
Tucked away off Blackwater Rd. in Central, this well-maintained home offers comfort, functionality, and recent updates on a spacious lot! Recent improvements include fresh interior paint, new flooring, a new range/oven, and a beautifully updated walk-in shower in the primary bath. A full exterior cover has been added over the home, providing extra protection and energy efficiency while extending over both the front and rear porches -- each spanning the entire length of the home, creating the perfect spaces to relax or entertain outdoors. A 2-car metal carport adds convenient covered parking and additional storage flexibility. Home is in the flood zone but DID NOT flood in 2016 or prior to 2016. If you're looking for an affordable, move-in ready property with outdoor living space and thoughtful updates, this one is worth a look!
Key facts
- Covered parking
- Outdoor living space
- Full exterior cover
Tags
Property features AI
Exterior
- Parking: 2 covered carport spaces; 2 total parking spaces
- Utilities: Public water; Public sewer
- Home design: Single-story manufactured home; Residential property
- Construction: Cement siding; 1 story
- Exterior features: Lot approximately 0.59 acres; Lot dimensions about 130' x 199'; Subdivision: Watson Farms
Interior
- Kitchen: Range; Oven; Dishwasher; Range hood
- Bathrooms: 2 full bathrooms
- Heating & cooling: Central heating; Central air conditioning
- Interior features: Range hood; Dishwasher; Range; Oven
Neighborhood map
What this means for you Summary
Snapshot
- This is a 3-bed/2.0-bath single-family listed at $123k.
Deal economics
- At list price, monthly cash flow is $189 ($2k/yr) — positive.
- The deal already cash-flows at list — no discount required.
- Meets the 1% rule at list price ($2k rent vs $123k).
- Recommended offer: $119k (3.0% below list) — sets the bar for market timing.
- Cap rate 12.3% vs local median 3.3% in Central — top-decile yield for the area; either an underpriced asset or a hidden risk that comps aren't pricing in. Stress-test before assuming the spread holds.
Location & tenants
- Location reads 74/100 on livability (#25 in LA, #4,761 nationally) — a middle-class / working-renter tenant base. Strengths: schools A+, employment A+, housing A+; Watch: amenities F, commute F.
- Central Community School District (suburban): math 50% / reading 54% proficiency, ranked #9 of 98 in LA (top 9%) — acceptable for families but not a draw, mixed tenant base, ~2y average lease.
- Market conditions: Rents rising fast (+4.2%/yr); 584 active listings in the ZIP; solid renter incomes; 2,252 units permitted in East Baton Rouge Parish in 2024 (440 in 5+ unit buildings).
Forward outlook
- Local home prices are declining (-3.0%/yr); year-one equity from $850 of loan paydown is wiped out by about $4k of value loss. Plan a longer hold.
- East Baton Rouge County population projected at +4% by 2050 — modest demand growth; plan on rents tracking national, not racing it.
Negotiation context
- It's been on market 40 days — a 3% lower offer ($119k) is reasonable based on typical stale-listing flexibility.
- 2 sale attempts with the ask held roughly flat each time — persistent listings suggest the price (not the market) is what's stuck; bring a comps-based counter.
Risks & watch-outs
- Watch-outs: flood insurance adds $427/mo.
- Climate carrying-cost: in FEMA flood zone AE (mandatory federal flood insurance); severe wind risk, 99% chance of damaging wind over 30y; extreme-heat days projected 7→20/yr by 2055 (HVAC capex compounding) — expect insurance premiums to compound above CPI over the hold.
Questions for the listing agent
- It's been on market 40 days. Have you received any prior offers? Is the seller open to a 3% concession, seller financing, or rate buy-down credit?
- What's the actual annual flood-insurance premium (NFIP or private), and is the property in a SFHA with mandatory coverage?
- Is there a deadline driving the sale (1031 exchange, divorce, estate, relocation)? That informs how much negotiation room exists.
- Schools are A-rated — typically a magnet for longer-tenancy family renters. What's the average tenant stay here, and is there a school-zone premium baked into asking?
- What's the average days-on-market for RENTAL listings here right now (not sales)? A rising rental-DOM trend means longer vacancies and softer asking-rent achievability than the comps imply.
- What's the recent tenant-quality profile in this submarket — average credit score on applications, eviction rate, late-payment / NSF rate, and stable-employment percentage? A property-management company in the area should have these aggregated.
- How much new for-sale + rental construction is in the pipeline within 1–3 miles? Heavy new supply typically softens prices + rents 12–24 months out; constrained supply supports both.
Investment metrics
- 1% rule
- 1.40% ✓
- Cap rate
- 12.30%
- Cash-on-cash
- 21.46%
- DSCR
- 1.95
- GRM
- 6.0
CMA / ARV
- ARV (median comp)
- $85,854
- List price
- $123,000
- Delta
- 43.27%
- Verdict
- OVERPRICED
- Comps
- 4 within 2.0 mi
Show comp detail 1 sale within ~0.75 mi
| Address | Dist | Beds/Ba | Sqft | Sold | Price | $/sf | Match |
|---|---|---|---|---|---|---|---|
| 9227 Arleen Ave | 0.35mi | 2/2.0 (-1) | 1,153 (+1%) | 16mo | $170,000 | $147 | 64 |
Match score weights: distance 35% · size 25% · config 20% · recency 20%. Top-matched comps best support the ARV.
Projected returns pro-forma
-3.0% appreciation · 4.18% rent growth · sell at horizon
- IRR
- -4.3%
- Equity multiple
- 0.84×
- Total profit
- $-5,588
- Equity at exit
- $18,340
- IRR
- 7.2%
- Equity multiple
- 1.59×
- Total profit
- $20,238
- Equity at exit
- $10,635
Cash invested: $34,440 (down + closing). Projections, not guarantees.
Landlord ↔ Tenant lean methodology
- Overall (STATE)
- 90 Strongly Landlord-Friendly
- State Louisiana
- 90 Strongly Landlord-Friendly · R+12
- County
- — inherits STATE
- City
- — inherits STATE
ZIP-level market 70791
- Home prices YoY
- -21.6%
- Rents YoY
- 4.2%
- Active inventory
- 584
- Price-to-rent
- 6.0×
Monthly cashflow live
- Estimated rent
- $1,719 medium interval (Pro) →
- Mortgage (P&I)
- −$645
- Tax from tax record
- −$46 /mo · $549/yr
- Insurance
- −$51
- Flood insurance flood zone
- −$427 /mo · $5,118/yr
- HOA
- −$0
- Vacancy / Maint / Mgmt
- −$361
- Net cashflow
- $189
Break-even live
UW: 25.0% down · 7.5% · 30yr · 1.5% tax · 5.0% vac · 8.0% maint · 8.0% mgmt
Financing live
Cash to close
- Down payment
- $30,750
- Closing costs
- $3,690
- Reserves months
- —
- Total cash needed
- —
Loan-product check · same deal, 3 products live
Conventional
25% down · 7.5% · 30yr
- Down + closing
- —
- Monthly P&I
- —
- Monthly cashflow
- —
- DSCR
- —
- Eligible?
- —
Personal DTI + credit; lowest rate.
DSCR
20% down · 8.5% · 30yr
- Down + closing
- —
- Monthly P&I
- —
- Monthly cashflow
- —
- DSCR
- —
- Eligible?
- —
No personal income docs; deal must DSCR.
Hard money
10% down · 12.0% · 12mo
- Down + closing
- —
- Monthly P&I
- —
- Monthly cashflow
- —
- DSCR
- —
- Eligible?
- —
Short-term bridge; refi at stabilization.
Listing history 18 events
-
2026-06-18days on market $123,000 Active 40 DOM
-
2026-06-17days on market $123,000 Active 39 DOM
-
2026-06-16days on market $123,000 Active 38 DOM
-
2026-06-15days on market $123,000 Active 37 DOM
-
2026-06-14days on market $123,000 Active 35 DOM
-
2026-06-10days on market $123,000 Active 32 DOM
-
2026-06-09days on market $123,000 Active 31 DOM
-
2026-06-08days on market $123,000 Active 30 DOM
-
2026-06-07days on market $123,000 Active 29 DOM
-
2026-06-05days on market $123,000 Active 26 DOM
-
2026-06-03days on market $123,000 Active 25 DOM
-
2026-06-02days on market $123,000 Active 24 DOM
-
2026-06-01days on market $123,000 Active 23 DOM
-
2026-05-31days on market $123,000 Active 22 DOM
-
2026-05-31days on market $123,000 Active 21 DOM
-
2026-05-09$123,000 Active 852-char remark
Show marketing remark (839 chars)
Tucked away off Blackwater Rd. in Central, this well-maintained home offers comfort, functionality, and recent updates on a spacious lot! Recent improvements include fresh interior paint, new flooring, a new range/oven, and a beautifully updated walk-in shower in the primary bath. A full exterior cover has been added over the home, providing extra protection and energy efficiency while extending over both the front and rear porches -- each spanning the entire length of the home, creating the perfect spaces to relax or entertain outdoors. A 2-car metal carport adds convenient covered parking and additional storage flexibility. Home is in the flood zone but DID NOT flood in 2016 or prior to 2016. If you're looking for an affordable, move-in ready property with outdoor living space and thoughtful updates, this one is worth a look!
-
2026-05-09$123,000 Active 839-char remark
Show marketing remark (839 chars)
Tucked away off Blackwater Rd. in Central, this well-maintained home offers comfort, functionality, and recent updates on a spacious lot! Recent improvements include fresh interior paint, new flooring, a new range/oven, and a beautifully updated walk-in shower in the primary bath. A full exterior cover has been added over the home, providing extra protection and energy efficiency while extending over both the front and rear porches -- each spanning the entire length of the home, creating the perfect spaces to relax or entertain outdoors. A 2-car metal carport adds convenient covered parking and additional storage flexibility. Home is in the flood zone but DID NOT flood in 2016 or prior to 2016. If you're looking for an affordable, move-in ready property with outdoor living space and thoughtful updates, this one is worth a look!
-
1993-04-12soldstatus
ⓘ Source: listings_history table (triggers on properties + properties_extension) + one-shot
backfill from property_details.listing_events for pre-trigger history.
Tax reassessment forecast LA · Resets to sale price
- Current annual tax
- $549 · $46/mo
- Projected year-2 tax
- $676 · $56/mo
- Expected delta
- +$128/yr (+$11/mo · 23.3%)
ⓘ Screening estimate from a state-policy table — verify with the county assessor before closing.
Climate risk First Street
- Flood 1/10 Low FEMA zone AE · 0% chance over 30 yrs
- Wildfire 3/10 Moderate
- Heat 8/10 Severe 7 d/yr ≥108°F today · 20 d/yr by 30 yrs out
- Wind 9/10 Extreme 99% chance of damaging wind over 30 yrs
- Air quality 3/10 Moderate 2 unhealthy d/yr today · 3 by 30 yrs out
Nearby sold comps map
Loading sold comps map…
Walkable amenities ~0.75 mi
Loading nearby amenities…
Taxation est. · year 1
- Rental income
- $20,626
- − Mortgage interest
- −$6,890
- − Property taxes
- −$549
- − Insurance
- −$5,734
- − Repairs & maintenance
- −$1,650
- − Management
- −$1,650
- − Depreciation
- −$3,578
- Taxable income
- $575
- Est. tax owed @ 24.0%
- −$138
- After-tax cash flow
- $2,134/yr
For passive investors: Depreciation is non-cash, so a rental often shows a tax loss while cash-flowing — sheltering income. Rental losses are passive: they offset passive income freely, and up to $25,000/yr can offset ordinary (W-2) income if you actively participate and your MAGI is under $100k (phasing out to $0 by $150k); unused losses carry forward. On sale, claimed depreciation is recaptured at up to 25%, and gains may owe capital-gains tax (a 1031 exchange can defer both). Figures are a year-1 estimate at your 24.0% rate — not tax advice; consult a CPA.
Schools (NCES district)
- District
- Central Community School District
- NCES district ID
- 2200125
- Math proficiency
- 50% ▼ -32.00%
- Reading proficiency
- 54% ▼ -31.00%
- Median HH income
- $66,584
- Composite
- 46.02/100
- National rank
- #2528
- State rank
- #9 of 98 in LA
Livability — Central
- Score
- 74/100
- State rank
- #25
- US rank
- #4761
Category grades
Schools grade is shown separately in the Schools card above.
Census & demographics
- Census place
- Central, LA
- County
- East Baton Rouge Parish · 399,686 people
- City population
- 10,403
- Metro
- Baton Rouge, LA
- Population (ZIP)
- 30,385
- Household income
- $78,263
- Rent vs Own
- Severe rent burden
- 718.0
Population outlook (East Baton Rouge County) Hauer SSP2
- Today (2025)
- 464,810 people
- By 2030
- 472,137 · +1.6%
- By 2040
- 480,243 · +3.3%
- By 2050
- 484,422 · +4.2%
- By 2075
- 492,069 · +5.9%
- By 2100
- 476,347 · +2.5%
Race, ethnicity, and origin ACS 2023
- Neighborhood character
- Diverse neighborhood (Simpson 0.55)
- Race & ethnicity
- White 53% Black 41% Two or more races 4% Hispanic / Latino 2% Asian 2%
- Common ancestry
- Lithuanian 6% Italian 2% Slovak 1%
- Foreign-born
- 2% · Canada
- Languages at home
- 96% English-only · Spanish 1% German/W. Germanic 1% French/Haitian/Cajun 1%
Political lean MEDSL · East Baton Rouge
- 2024 margin
- D (+11.1) · D 54.5% · R 43.4% · Other 2.1%
- 2008→2024 swing
- +8.9pp toward D · 2008: 2.2pp · 2024: 11.1pp
- All cycles
- 2024: D+11.1 2020: D+13.1 2016: D+9.2 2012: D+5.2 2008: D+2.2
Not yet ingested
- Civics
- —
Market trends
- HPI YoY
- ▼ -47.01%
- Current HPI
- 170.2143
- Rent YoY
- ▲ 4.18%
- Metro
- Baton Rouge, LA
- State GDP YoY
- ▲ 3.29%
- F500 in state
- 10
Industry mix (Fortune 500 HQ in LA)
| Industry | F500 HQs | Revenue |
|---|---|---|
| Telecommunications | 2 | $23B |
|
||
| Utilities | 1 | $12B |
|
||
| Wholesale / Distribution | 1 | $5B |
|
||
| Advertising | 1 | $2B |
|
||
Price history
+0.0% since first listed3 events — show timeline
- 2026-05-09 Listed $123,000 AcadianaMLS
- 2026-05-09 Listed $123,000 GBRMLS
- 1993-04-12 Sold (Public Records) — Public Records
Property tax history
+26.7%/yrLatest (2025): $549 · -0.3% YoY. Source: county tax records.
Cash-flow waterfall
monthlySold comps — $/sqft
last 12 mo · ≤1 miLoading sold comps…