 🏢 Co-op
138-11 Beach Channel Dr Unit c6 · New York, NY
Flood risk 10/10 · Severe
- FEMA flood zone
- X (shaded)
- Chance of flooding over 30 yrs
- 0.99%
- Est. flood insurance / yr
- $507 – $1,088
Fire risk 1/10 · Minimal
- Est. fire insurance / yr
- $691 – $1,283
Heat risk 6/10 · Moderate
- Hot days now (above 96°F)
- 7 days/yr
- Hot days in 30 yrs
- 14 days/yr
Wind risk 7/10 · Major
- Chance of severe wind over 30 yrs
- 78.0%
Air-quality risk 5/10 · Moderate
- Unhealthy air days now
- 6 days/yr
- Unhealthy air days in 30 yrs
- 8 days/yr
Risk factors via First Street. Map © Google.
Why this score? — see what drove the C grade
The composite is a weighted blend of 9 inputs, each scored 0–100. Each bar is that input's sub-score; the figure is the points it added to the 100-point composite (weight × sub-score).
- Cash flow +23.5/30.0
- DSCR +7.6/10.0
- ARV discount +7.5/15.0
- 1% rule +6.1/10.0
- Schools +5.0/10.0
- Livability +3.8/5.0
- Rent growth +2.5/5.0
- Condition / age +2.5/5.0
- Appreciation +0.0/10.0
$249,999
🖨 Deal sheet 📄 Offer letter ✓ Due diligence
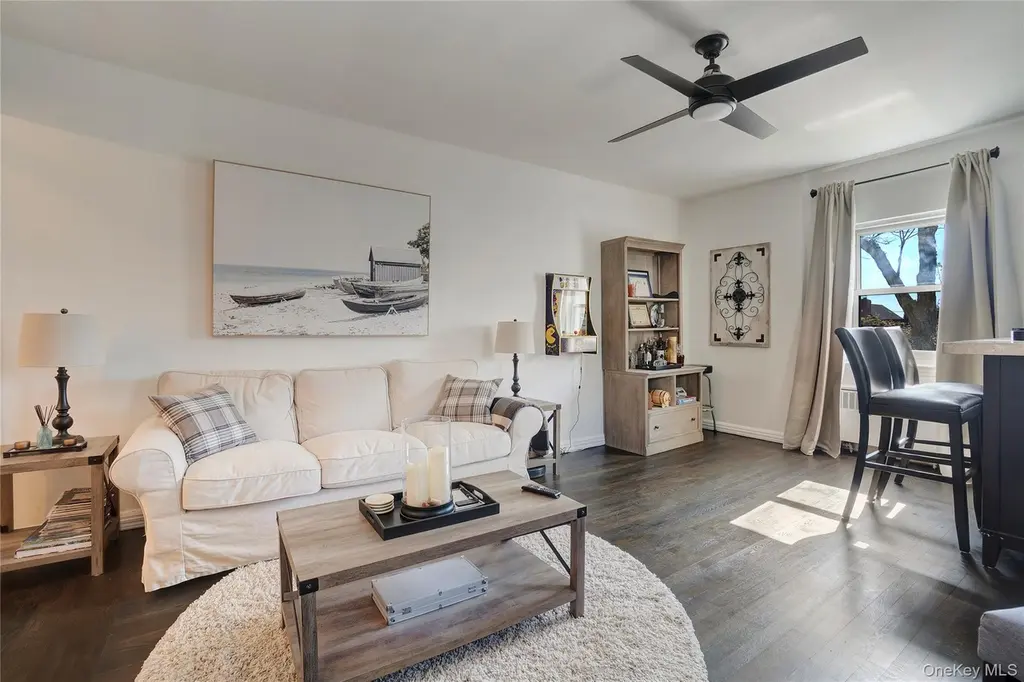
Listing remarks
OPEN HOUSE SATURDAY 9/20 BY APPOINTMENT ONLY! Fantastic 1 Bedroom Apartment available now in the heart of Belle Harbor. This modern unit is located within the quiet community Beach Channel Housing Co-op. This is also the only co-op building located in upper Belle Harbor. This apartment has been updated & is totally turn key ready for a new owner to call home. One of the largest lines in the building this unit has plenty of living space and storage. Parking can be made available for an additional monthly charge as well. The building also has a live in super that is always available & on call for emergencies. Large Laundry facility available within the co-op as well. Call today fo
Key facts
- Updated
- Turn key ready
- 1 bedroom apartment
Tags
Neighborhood map
What this means for you Summary
Snapshot
- This is a 1-bed/1.0-bath condo listed at $250k.
Deal economics
- At list price, monthly cash flow is $400 ($5k/yr) — positive.
- The deal already cash-flows at list — no discount required.
- Meets the 1% rule at list price ($3k rent vs $250k).
- Recommended offer: $220k (12.0% below list) — sets the bar for market timing.
- Cap rate 8.5% vs local median 2.6% in New York — top-decile yield for the area; either an underpriced asset or a hidden risk that comps aren't pricing in. Stress-test before assuming the spread holds.
Location & tenants
- Location reads 75/100 on livability (#268 in NY, #4,188 nationally) — a middle-class / working-renter tenant base. Strengths: amenities A+, commute A+, health & safety A; Watch: crime F, cost of living F.
- Market conditions: 89 active listings in the ZIP; 2 comparable units currently listed for rent nearby; 5,302 units permitted in Queens County in 2024 (4,918 in 5+ unit buildings).
Forward outlook
- Local home prices are declining (-3.0%/yr); year-one equity from $2k of loan paydown is wiped out by about $8k of value loss. Plan a longer hold.
- Queens County population projected at +16% by 2050 — long-run rental-demand tailwind backs the buy-and-hold thesis.
Negotiation context
- It's been on market 137 days — a 12% lower offer ($220k) is reasonable based on typical stale-listing flexibility.
- 17 sale attempts since 10y ago; this cycle's ask has dropped $29k (10%) from the opening price — seller is motivated, your offer sets the floor, not the list.
- Current owner paid $160k; list at $250k implies a 56% gain — meaningful room to come down on a strong offer.
Risks & watch-outs
- Watch-outs: flood insurance adds $66/mo; built in 1950 — expect roof / HVAC / electrical / plumbing capex.
- Climate carrying-cost: severe flood risk; major wind risk, 78% chance of damaging wind over 30y; extreme-heat days projected 7→14/yr by 2055 (HVAC capex compounding) — expect insurance premiums to compound above CPI over the hold.
Questions for the listing agent
- It's been on market 137 days. Have you received any prior offers? Is the seller open to a 12% concession, seller financing, or rate buy-down credit?
- Built in 1950 — when were the roof, HVAC, electrical panel, plumbing, and water heater last replaced?
- What's the actual annual flood-insurance premium (NFIP or private), and is the property in a SFHA with mandatory coverage?
- Any open or pending special assessments — roof, HVAC, plumbing, elevator, façade? What's the per-unit balance and payoff schedule, and is the seller paying it off at close or rolling it to the buyer?
- Why hasn't it sold? Are there any deal-killer items the seller is aware of (foundation, flood, title, zoning, code violations)?
- Is there a deadline driving the sale (1031 exchange, divorce, estate, relocation)? That informs how much negotiation room exists.
- Schools are B-rated — typically a magnet for longer-tenancy family renters. What's the average tenant stay here, and is there a school-zone premium baked into asking?
- Crime grade is F in this area — have there been break-ins, vandalism, or insurance claims at this property in the last 3 years? What carrier currently insures it and at what premium?
- What's the average days-on-market for RENTAL listings here right now (not sales)? A rising rental-DOM trend means longer vacancies and softer asking-rent achievability than the comps imply.
- What's the recent tenant-quality profile in this submarket — average credit score on applications, eviction rate, late-payment / NSF rate, and stable-employment percentage? A property-management company in the area should have these aggregated.
- How much new apartment / multifamily construction is in the pipeline within 1–3 miles? Heavy new supply (>2% of stock underway) typically softens rents 12–24 months out; light construction supports rent growth.
Investment metrics
- 1% rule
- 1.11% ✓
- Cap rate
- 8.53%
- Cash-on-cash
- 7.99%
- DSCR
- 1.36
- GRM
- 7.5
CMA / ARV
No comps found within radius.
Projected returns pro-forma
-3.0% appreciation · 3.0% rent growth · sell at horizon
- IRR
- -5.8%
- Equity multiple
- 0.79×
- Total profit
- $-14,975
- Equity at exit
- $37,276
- IRR
- 3.9%
- Equity multiple
- 1.29×
- Total profit
- $20,070
- Equity at exit
- $21,615
Cash invested: $70,000 (down + closing). Projections, not guarantees.
Landlord ↔ Tenant lean methodology
- Overall (CITY)
- 0 Strongly Tenant-Friendly
- State New York
- 15 Strongly Tenant-Friendly · D+10
- County
- — inherits STATE
- City New York
- 0 Strongly Tenant-Friendly · D+34
ZIP-level market 11694
- Home prices YoY
- -33.2%
- Active inventory
- 89
- Price-to-rent
- 7.5×
Monthly cashflow live
- Estimated rent
- $2,777 medium interval (Pro) →
- Mortgage (P&I)
- −$1,311
- Tax est. 1.5%
- −$312 /mo · $3,750/yr
- Insurance
- −$104
- Flood insurance flood zone
- −$66 /mo · $798/yr
- HOA
- −$0
- Vacancy / Maint / Mgmt
- −$583
- Net cashflow
- $400
Break-even live
UW: 25.0% down · 7.5% · 30yr · 1.5% tax · 5.0% vac · 8.0% maint · 8.0% mgmt
Financing live
Cash to close
- Down payment
- $62,500
- Closing costs
- $7,500
- Reserves months
- —
- Total cash needed
- —
Loan-product check · same deal, 3 products live
Conventional
25% down · 7.5% · 30yr
- Down + closing
- —
- Monthly P&I
- —
- Monthly cashflow
- —
- DSCR
- —
- Eligible?
- —
Personal DTI + credit; lowest rate.
DSCR
20% down · 8.5% · 30yr
- Down + closing
- —
- Monthly P&I
- —
- Monthly cashflow
- —
- DSCR
- —
- Eligible?
- —
No personal income docs; deal must DSCR.
Hard money
10% down · 12.0% · 12mo
- Down + closing
- —
- Monthly P&I
- —
- Monthly cashflow
- —
- DSCR
- —
- Eligible?
- —
Short-term bridge; refi at stabilization.
Rent comps 2 comps
| Address | Beds | Baths | Sqft | Rent | $/sqft | DOM | Units | Dist |
|---|---|---|---|---|---|---|---|---|
| 5-12 Beach 130th St Unit 2B Far Rockaway, NY | 2.0 | 1.0 | 650 | $3,000 | $4.62 | 24d | 1 | 0.39mi |
| 115-08 Rockaway Beach Blvd Unit FRONT Far Rockaway, NY | 1.0 | 1.0 | 450 | $1,850 | $4.11 | 24d | 1 | 1.13mi |
HOA detail condo
- Monthly dues
- $0 · $0/yr
- Assessments
- None detected in remarks — confirm with the listing agent.
Listing history 43 events
-
2026-01-06status Pending
-
2025-11-12status Active
-
2025-11-02historical
-
2025-09-17price $249,999
-
2025-08-13$279,000 Active
-
2025-08-12historical
-
2025-07-18price $279,000
-
2025-05-28price $280,000
-
2025-04-15$298,000 Active
-
2025-04-14historical
-
2025-03-14price $298,000
-
2025-02-14price $305,000
-
2025-01-08price $315,000
-
2024-10-13$325,000 Active
-
2021-10-26soldstatus $159,900 Closed
-
2021-06-14status Pending
-
2021-04-26price $159,900
-
2021-04-06status Active
-
2021-02-11status Pending
-
2020-12-08status Active
-
2020-06-26$134,900 Active
-
2020-04-02historical
-
2020-03-12price $134,900
-
2018-05-30historical
-
2018-05-23price $150,000
-
2018-05-22$150,000 New
-
2017-09-19$155,000 New
-
2017-09-18historical
-
2017-07-25$155,000 New
-
2017-07-22historical
-
2017-03-08$155,000 New
-
2017-03-07historical
-
2017-02-06status Listing Extended
-
2017-02-06historical
-
2016-12-06$155,000 New
-
2016-12-03historical
-
2016-10-04status Listing Extended
-
2016-10-04historical
-
2016-07-06$155,000 New
-
2016-07-04historical
-
2016-04-26$155,000
-
2016-04-22historical
-
2016-01-22$135,000
ⓘ Source: listings_history table (triggers on properties + properties_extension) + one-shot
backfill from property_details.listing_events for pre-trigger history.
Climate risk First Street
- Flood 10/10 Extreme FEMA zone X (shaded) · 99% chance over 30 yrs
- Wildfire 1/10 Low
- Heat 6/10 Major 7 d/yr ≥96°F today · 14 d/yr by 30 yrs out
- Wind 7/10 Severe 78% chance of damaging wind over 30 yrs
- Air quality 5/10 Major 6 unhealthy d/yr today · 8 by 30 yrs out
Nearby sold comps map
Loading sold comps map…
Walkable amenities ~0.75 mi
Loading nearby amenities…
Taxation est. · year 1
- Rental income
- $33,323
- − Mortgage interest
- −$14,004
- − Property taxes
- −$3,750
- − Insurance
- −$2,047
- − Repairs & maintenance
- −$2,666
- − Management
- −$2,666
- − Depreciation
- −$7,273
- Taxable income
- $917
- Est. tax owed @ 24.0%
- −$220
- After-tax cash flow
- $4,575/yr
For passive investors: Depreciation is non-cash, so a rental often shows a tax loss while cash-flowing — sheltering income. Rental losses are passive: they offset passive income freely, and up to $25,000/yr can offset ordinary (W-2) income if you actively participate and your MAGI is under $100k (phasing out to $0 by $150k); unused losses carry forward. On sale, claimed depreciation is recaptured at up to 25%, and gains may owe capital-gains tax (a 1031 exchange can defer both). Figures are a year-1 estimate at your 24.0% rate — not tax advice; consult a CPA.
Schools (NCES district)
No district data.
Livability — New York
- Score
- 75/100
- State rank
- #268
- US rank
- #4188
Category grades
Schools grade is shown separately in the Schools card above.
Census & demographics
- Census place
- New York, NY
- City population
- 7,731,280
- Population (ZIP)
- 21,430
Population outlook (Queens County) Hauer SSP2
- Today (2025)
- 2,546,320 people
- By 2030
- 2,643,059 · +3.8%
- By 2040
- 2,815,563 · +10.6%
- By 2050
- 2,944,423 · +15.6%
- By 2075
- 3,123,338 · +22.7%
- By 2100
- 3,098,688 · +21.7%
Race, ethnicity, and origin ACS 2023
- Neighborhood character
- Predominantly White (72%)
- Race & ethnicity
- White 72% Hispanic / Latino 17% Black 8% Two or more races 8% Asian 2%
- Hispanic origin (detail)
- Mexican 1% Puerto Rican 8% Dominican 2%
- Common ancestry
- Romanian 4% Italian 2% Scotch-Irish 1%
- Foreign-born
- 14% · Canada, China
- Languages at home
- 81% English-only · Spanish 7% Russian/Polish/Slavic 4% Arabic 3%
Political lean MEDSL · Queens
- 2024 margin
- Strong D (+24.6) · D 62.3% · R 37.7%
- 2008→2024 swing
- -26.2pp toward R · 2008: 50.8pp · 2024: 24.6pp
- All cycles
- 2024: D+24.6 2020: D+45.2 2016: D+53.4 2012: D+58.5 2008: D+50.8
Not yet ingested
- Civics
- —
Market trends
- HPI YoY
- ▼ -121.01%
- Current HPI
- 243.2048
- Rent YoY
- —
- Metro
- —
- State GDP YoY
- ▲ 2.60%
- F500 in state
- 92
Industry mix (Fortune 500 HQ in NY)
| Industry | F500 HQs | Revenue |
|---|---|---|
| Financial Services | 10 | $950B |
|
||
| Consumer Goods | 9 | $162B |
|
||
| Insurance | 4 | $225B |
|
||
| Telecommunications | 2 | $144B |
|
||
| Pharmaceuticals | 2 | $112B |
|
||
| Media / Entertainment | 2 | $69B |
|
||
Price history
+85.2% since first listed43 events — show timeline
- 2026-01-06 Pending — OneKey® MLS as Distributed by MLS Grid
- 2025-11-12 Relisted — OneKey® MLS as Distributed by MLS Grid
- 2025-11-02 Listing Removed — OneKey® MLS as Distributed by MLS Grid
- 2025-09-17 Price Changed $249,999 OneKey® MLS as Distributed by MLS Grid
- 2025-08-13 Listed $279,000 OneKey® MLS as Distributed by MLS Grid
- 2025-08-12 Listing Removed — OneKey® MLS as Distributed by MLS Grid
- 2025-07-18 Price Changed $279,000 OneKey® MLS as Distributed by MLS Grid
- 2025-05-28 Price Changed $280,000 OneKey® MLS as Distributed by MLS Grid
- 2025-04-15 Listed $298,000 OneKey® MLS as Distributed by MLS Grid
- 2025-04-14 Listing Removed — OneKey® MLS as Distributed by MLS Grid
- 2025-03-14 Price Changed $298,000 OneKey® MLS as Distributed by MLS Grid
- 2025-02-14 Price Changed $305,000 OneKey® MLS as Distributed by MLS Grid
- 2025-01-08 Price Changed $315,000 OneKey® MLS as Distributed by MLS Grid
- 2024-10-13 Listed $325,000 OneKey® MLS as Distributed by MLS Grid
- 2021-10-26 Sold (MLS) $159,900 OneKey® MLS as Distributed by MLS Grid
- 2021-06-14 Pending — OneKey® MLS as Distributed by MLS Grid
- 2021-04-26 Price Changed $159,900 OneKey® MLS as Distributed by MLS Grid
- 2021-04-06 Relisted — OneKey® MLS as Distributed by MLS Grid
- 2021-02-11 Pending — OneKey® MLS as Distributed by MLS Grid
- 2020-12-08 Relisted — OneKey® MLS as Distributed by MLS Grid
- 2020-06-26 Listed $134,900 OneKey® MLS as Distributed by MLS Grid
- 2020-04-02 Listing Removed — OneKey® MLS as Distributed by MLS Grid
- 2020-03-12 Price Changed $134,900 OneKey® MLS as Distributed by MLS Grid
- 2018-05-30 Listing Removed — OneKey® MLS as Distributed by MLS Grid
- 2018-05-23 Price Changed $150,000 OneKey® MLS as Distributed by MLS Grid
- 2018-05-22 Listed $150,000 OneKey® MLS as Distributed by MLS Grid
- 2017-09-19 Listed $155,000 OneKey® MLS as Distributed by MLS Grid
- 2017-09-18 Listing Removed — OneKey® MLS as Distributed by MLS Grid
- 2017-07-25 Listed $155,000 OneKey® MLS as Distributed by MLS Grid
- 2017-07-22 Listing Removed — OneKey® MLS as Distributed by MLS Grid
- 2017-03-08 Listed $155,000 OneKey® MLS as Distributed by MLS Grid
- 2017-03-07 Listing Removed — OneKey® MLS as Distributed by MLS Grid
- 2017-02-06 Relisted — OneKey® MLS as Distributed by MLS Grid
- 2017-02-06 Listing Removed — OneKey® MLS as Distributed by MLS Grid
- 2016-12-06 Listed $155,000 OneKey® MLS as Distributed by MLS Grid
- 2016-12-03 Listing Removed — OneKey® MLS as Distributed by MLS Grid
- 2016-10-04 Relisted — OneKey® MLS as Distributed by MLS Grid
- 2016-10-04 Listing Removed — OneKey® MLS as Distributed by MLS Grid
- 2016-07-06 Listed $155,000 OneKey® MLS as Distributed by MLS Grid
- 2016-07-04 Listing Removed — OneKey® MLS as Distributed by MLS Grid
- 2016-04-26 Listed $155,000 OneKey® MLS as Distributed by MLS Grid
- 2016-04-22 Listing Removed — OneKey® MLS as Distributed by MLS Grid
- 2016-01-22 Listed $135,000 OneKey® MLS as Distributed by MLS Grid
Cash-flow waterfall
monthlySold comps — $/sqft
last 12 mo · ≤1 miLoading sold comps…