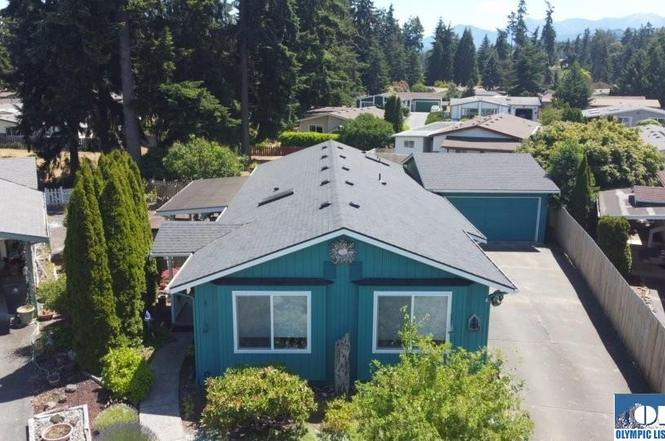
10 Danielle Ct · Carlsborg, WA
Flood risk No data
- FEMA flood zone
- —
- Chance of flooding over 30 yrs
- %
- Est. flood insurance / yr
- —
Fire risk No data
- Est. fire insurance / yr
- —
Heat risk No data
- Hot days now (above °F)
- days/yr
- Hot days in 30 yrs
- days/yr
Wind risk No data
- Chance of severe wind over 30 yrs
- %
Air-quality risk No data
- Unhealthy air days now
- days/yr
- Unhealthy air days in 30 yrs
- days/yr
Risk factors via First Street. Map © Google.
Why this score? — see what drove the C- grade
The composite is a weighted blend of 9 inputs, each scored 0–100. Each bar is that input's sub-score; the figure is the points it added to the 100-point composite (weight × sub-score).
- Cash flow +22.1/30.0
- DSCR +7.1/10.0
- 1% rule +5.8/10.0
- ARV discount +5.5/15.0
- Schools +5.3/10.0
- Livability +3.0/5.0
- Rent growth +2.5/5.0
- Condition / age +2.5/5.0
- Appreciation +0.0/10.0
$220,000
🖨 Deal sheet 📄 Offer letter ✓ Due diligence
Listing remarks
Lovely 3 bd. rm. 2 bath remodeled home. Energy efficient vinyl windows & heat pump system help keep the utility bill low. Skylights & large windows allow natural light to flow into the home for a light & airy atmosphere. Wonderful, covered patio with hot tub accessed from the family room by patio doors - a very pleasant/private back yard . A 2 car garage is a great feature. The Parkwood community is age restricted 55 plus community. Clubhouse amenities include Sauna, Library, Full kitchen, BIGSCREEN TV!!, Billiards, Table Tennis, Built-in BBQ and beautiful Clubhouse & Gardens. http://www. parkwoodcommunity.com/Check out their website for information . Walking trails
Key facts
- Hot tub
- Covered patio
- Clubhouse amenities
Tags
Neighborhood map
What this means for you Summary
Snapshot
- This is a 3-bed/2.0-bath manufactured listed at $220k.
Deal economics
- At list price, monthly cash flow is $354 ($4k/yr) — positive.
- The deal already cash-flows at list — no discount required.
- Meets the 1% rule at list price ($2k rent vs $220k).
- Cap rate 8.2% vs local median 2.4% in Carlsborg — top-decile yield for the area; either an underpriced asset or a hidden risk that comps aren't pricing in. Stress-test before assuming the spread holds.
Location & tenants
- Location reads 59/100 on livability (#493 in WA) — a working-class tenant base; expect higher turnover. Strengths: cost of living A+, housing A+; Watch: employment D, health & safety D, crime D-.
- Sequim School District (town): math 55% / reading 66% proficiency, ranked #64 of 291 in WA (top 22%) — acceptable for families but not a draw, mixed tenant base, ~2y average lease.
- Market conditions: 605 active listings in the ZIP; 166 units permitted in Clallam County in 2024 (0 in 5+ unit buildings).
- This rent runs 38% of the median local income ($74k/yr) — at the standard rent-burdened threshold; future hikes will face affordability resistance.
Forward outlook
- Local home prices are declining (-3.0%/yr); year-one equity from $2k of loan paydown is wiped out by about $7k of value loss. Plan a longer hold.
- Clallam County population projected at +5% by 2050 — modest demand growth; plan on rents tracking national, not racing it.
Negotiation context
- Only 1 days on market — expect competitive offers; lowballing is unlikely to land.
Questions for the listing agent
- Is there a deadline driving the sale (1031 exchange, divorce, estate, relocation)? That informs how much negotiation room exists.
- Schools are B-rated — typically a magnet for longer-tenancy family renters. What's the average tenant stay here, and is there a school-zone premium baked into asking?
- Crime grade is D in this area — have there been break-ins, vandalism, or insurance claims at this property in the last 3 years? What carrier currently insures it and at what premium?
- What's the average days-on-market for RENTAL listings here right now (not sales)? A rising rental-DOM trend means longer vacancies and softer asking-rent achievability than the comps imply.
- What's the recent tenant-quality profile in this submarket — average credit score on applications, eviction rate, late-payment / NSF rate, and stable-employment percentage? A property-management company in the area should have these aggregated.
- How much new for-sale + rental construction is in the pipeline within 1–3 miles? Heavy new supply typically softens prices + rents 12–24 months out; constrained supply supports both.
Investment metrics
- 1% rule
- 1.08% ✓
- Cap rate
- 8.22%
- Cash-on-cash
- 6.90%
- DSCR
- 1.31
- GRM
- 7.7
CMA / ARV
- ARV (on-the-fly)
- $210,528
- Comps found
- 12
Show comp detail 12 sales within ~0.75 mi
| Address | Dist | Beds/Ba | Sqft | Sold | Price | $/sf | Match |
|---|---|---|---|---|---|---|---|
| 20 Eds Pl | 0.08mi | 3/2.0 | 1,507 (-3%) | 1mo | $166,000 | $110 | 91 |
| 120 Fircrest Dr | 0.13mi | 3/2.0 | 1,616 (+4%) | 5mo | $186,500 | $115 | 83 |
| 391 Parkwood | 0.26mi | 2/2.0 (-1) | 1,558 (+1%) | 0mo | $235,000 | $151 | 82 |
| 42 Hayden Pl | 0.09mi | 3/2.0 | 1,436 (-7%) | 8mo | $167,500 | $117 | 77 |
| 200 Fircrest Dr | 0.23mi | 3/2.0 | 1,426 (-8%) | 0mo | $190,000 | $133 | 76 |
| 220 Carlsborg Rd | 0.46mi | 3/2.0 | 1,555 (+0%) | 6mo | $399,999 | $257 | 73 |
| 141 Lavender Ridge Ln | 0.54mi | 3/2.0 | 1,562 (+1%) | 2mo | $492,500 | $315 | 72 |
| 410 Parkwood Blvd | 0.23mi | 3/2.0 | 1,404 (-9%) | 9mo | $215,000 | $153 | 66 |
| 60 Erics Way | 0.22mi | 3/2.0 | 1,723 (+11%) | 6mo | $234,000 | $136 | 66 |
| 151 Parkwood Blvd | 0.09mi | 2/2.0 (-1) | 1,344 (-13%) | 6mo | $161,300 | $120 | 63 |
| 400 Gupster #2 | 0.44mi | 2/2.0 (-1) | 1,500 (-3%) | 10mo | $120,000 | $80 | 61 |
| 481 Parkwood Blvd | 0.31mi | 3/2.0 | 1,772 (+14%) | 9mo | $310,000 | $175 | 54 |
Match score weights: distance 35% · size 25% · config 20% · recency 20%. Top-matched comps best support the ARV.
Projected returns pro-forma
-3.0% appreciation · 3.0% rent growth · sell at horizon
- IRR
- -5.7%
- Equity multiple
- 0.79×
- Total profit
- $-13,062
- Equity at exit
- $32,803
- IRR
- 4.0%
- Equity multiple
- 1.29×
- Total profit
- $17,811
- Equity at exit
- $19,022
Cash invested: $61,600 (down + closing). Projections, not guarantees.
Landlord ↔ Tenant lean methodology
- Overall (STATE)
- 28 Tenant-Leaning
- State Washington
- 28 Tenant-Leaning · D+8
- County
- — inherits STATE
- City
- — inherits STATE
ZIP-level market 98382
- Active inventory
- 605
- Price-to-rent
- 7.7×
Monthly cashflow live
- Estimated rent
- $2,373 medium interval (Pro) →
- Mortgage (P&I)
- −$1,154
- Tax est. 1.5%
- −$275 /mo · $3,300/yr
- Insurance
- −$92
- HOA
- −$0
- Vacancy / Maint / Mgmt
- −$498
- Net cashflow
- $354
Break-even live
UW: 25.0% down · 7.5% · 30yr · 1.5% tax · 5.0% vac · 8.0% maint · 8.0% mgmt
Financing live
Cash to close
- Down payment
- $55,000
- Closing costs
- $6,600
- Reserves months
- —
- Total cash needed
- —
Loan-product check · same deal, 3 products live
Conventional
25% down · 7.5% · 30yr
- Down + closing
- —
- Monthly P&I
- —
- Monthly cashflow
- —
- DSCR
- —
- Eligible?
- —
Personal DTI + credit; lowest rate.
DSCR
20% down · 8.5% · 30yr
- Down + closing
- —
- Monthly P&I
- —
- Monthly cashflow
- —
- DSCR
- —
- Eligible?
- —
No personal income docs; deal must DSCR.
Hard money
10% down · 12.0% · 12mo
- Down + closing
- —
- Monthly P&I
- —
- Monthly cashflow
- —
- DSCR
- —
- Eligible?
- —
Short-term bridge; refi at stabilization.
Listing history 2 events
-
2026-06-19remarks 683-char remark
-
2026-06-19$220,000 Active 1 DOM
ⓘ Source: listings_history table (triggers on properties + properties_extension) + one-shot
backfill from property_details.listing_events for pre-trigger history.
Nearby sold comps map
Loading sold comps map…
Walkable amenities ~0.75 mi
Loading nearby amenities…
Taxation est. · year 1
- Rental income
- $28,473
- − Mortgage interest
- −$12,323
- − Property taxes
- −$3,300
- − Insurance
- −$1,100
- − Repairs & maintenance
- −$2,278
- − Management
- −$2,278
- − Depreciation
- −$6,400
- Taxable income
- $794
- Est. tax owed @ 24.0%
- −$190
- After-tax cash flow
- $4,059/yr
For passive investors: Depreciation is non-cash, so a rental often shows a tax loss while cash-flowing — sheltering income. Rental losses are passive: they offset passive income freely, and up to $25,000/yr can offset ordinary (W-2) income if you actively participate and your MAGI is under $100k (phasing out to $0 by $150k); unused losses carry forward. On sale, claimed depreciation is recaptured at up to 25%, and gains may owe capital-gains tax (a 1031 exchange can defer both). Figures are a year-1 estimate at your 24.0% rate — not tax advice; consult a CPA.
Schools (NCES district)
- District
- Sequim School District
- NCES district ID
- 5307830
- Math proficiency
- 55% ▼ -1.00%
- Reading proficiency
- 66% ▲ 1.00%
- Median HH income
- $46,969
- Composite
- 52.77/100
- National rank
- #3312
- State rank
- #64 of 291 in WA
Livability — Carlsborg
- Score
- 59/100
- State rank
- #493
- US rank
- #20503
Category grades
Schools grade is shown separately in the Schools card above.
Census & demographics
- Census place
- Carlsborg, WA
- County
- Clallam County · 31,052 people
- Metro
- Port Angeles, WA
- Population (ZIP)
- 31,052
- Household income
- $74,189
- Rent vs Own
- Severe rent burden
- 666.0
Population outlook (Clallam County) Hauer SSP2
- Today (2025)
- 76,817 people
- By 2030
- 78,177 · +1.8%
- By 2040
- 79,795 · +3.9%
- By 2050
- 80,890 · +5.3%
- By 2075
- 83,933 · +9.3%
- By 2100
- 82,141 · +6.9%
Race, ethnicity, and origin ACS 2023
- Neighborhood character
- Predominantly White (85%)
- Race & ethnicity
- White 85% Two or more races 7% Hispanic / Latino 4% Asian 2%
- Common ancestry
- Portuguese 5% Slovak 5% Italian 4%
- Foreign-born
- 6% · Canada
- Languages at home
- 95% English-only · Spanish 2% German/W. Germanic 1% Other Indo-European 1%
Political lean MEDSL · Clallam
- 2024 margin
- Lean D (+7.9) · D 52.6% · R 44.7% · Other 2.7%
- 2008→2024 swing
- +4.6pp toward D · 2008: 3.3pp · 2024: 7.9pp
- All cycles
- 2024: D+7.9 2020: D+3.4 2016: R+1.6 2012: D+0.4 2008: D+3.3
Not yet ingested
- Civics
- —
Market trends
- HPI YoY
- ▼ -225.89%
- Current HPI
- 181.4372
- Rent YoY
- —
- Metro
- Port Angeles, WA
- State GDP YoY
- ▲ 4.65%
- F500 in state
- 22
Industry mix (Fortune 500 HQ in WA)
| Industry | F500 HQs | Revenue |
|---|---|---|
| Retail | 2 | $269B |
|
||
| Technology / Retail | 1 | $638B |
|
||
| Technology | 1 | $245B |
|
||
| Telecommunications | 1 | $38B |
|
||
| Food / Beverage | 1 | $36B |
|
||
| Automotive / Trucks | 1 | $34B |
|
||
Cash-flow waterfall
monthlySold comps — $/sqft
last 12 mo · ≤1 miLoading sold comps…