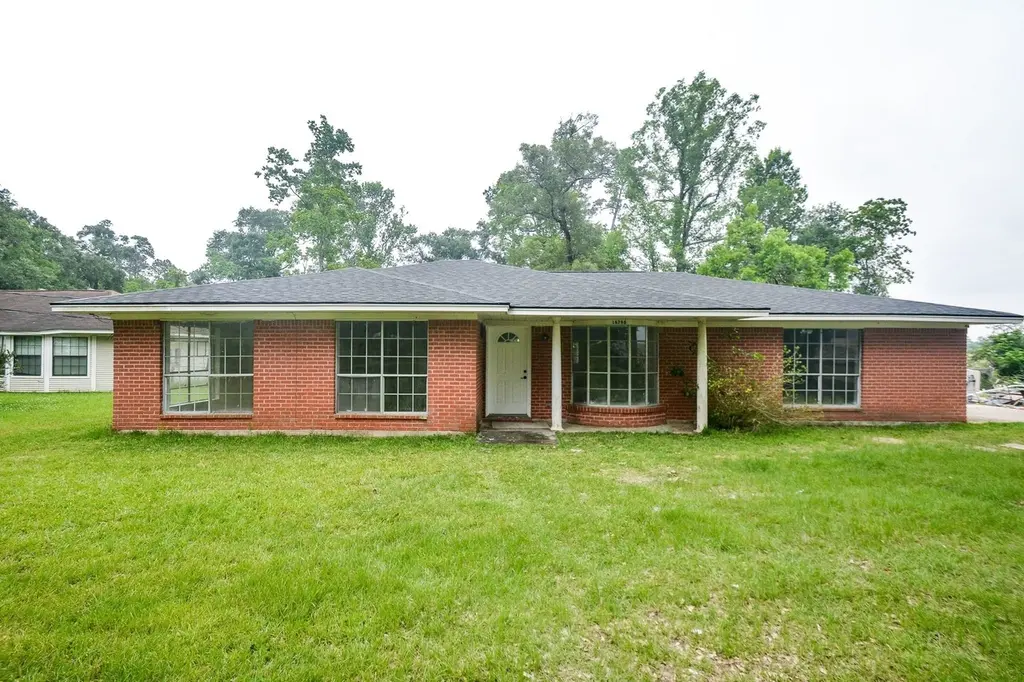
16796 Red Leaf Ln · Grangerland, TX
Flood risk 3/10 · Minor
- FEMA flood zone
- X (unshaded)
- Chance of flooding over 30 yrs
- 0.2%
- Est. flood insurance / yr
- $507 – $1,088
Fire risk 5/10 · Moderate
- Est. fire insurance / yr
- $1,222 – $2,270
Heat risk 8/10 · Major
- Hot days now (above 112°F)
- 7 days/yr
- Hot days in 30 yrs
- 24 days/yr
Wind risk 8/10 · Major
- Chance of severe wind over 30 yrs
- 99.0%
Air-quality risk 3/10 · Minor
- Unhealthy air days now
- 2 days/yr
- Unhealthy air days in 30 yrs
- 3 days/yr
Risk factors via First Street. Map © Google.
Why this score? — see what drove the C- grade
The composite is a weighted blend of 9 inputs, each scored 0–100. Each bar is that input's sub-score; the figure is the points it added to the 100-point composite (weight × sub-score).
- Cash flow +17.4/30.0
- ARV discount +13.0/15.0
- DSCR +5.4/10.0
- Schools +5.1/10.0
- 1% rule +4.0/10.0
- Rent growth +2.5/5.0
- Livability +2.5/5.0
- Condition / age +2.5/5.0
- Appreciation +0.0/10.0
$195,000
🖨 Deal sheet (PDF) 📄 Offer letter ✓ Due diligence
Listing remarks
Welcome to this beautifully remodeled home tucked away on a quiet cul-de-sac! This move-in ready property features 3 spacious bedrooms, 2 updated bathrooms, and a 2-car garage. Recent upgrades include a NEW roof, stylish kitchen cabinets, and modern finishes throughout the home. Enjoy the large lot with plenty of space for entertaining, gardening, or future possibilities. The open and inviting layout offers comfort and functionality, making it perfect for everyday living. Don’t miss the opportunity to make this beautifully updated home yours!
Key facts
- Quiet cul-de-sac
- Large lot
- Open layout
Tags
Property features AI
Exterior
- Parking: Attached 2-car garage
- Utilities: Public water; Public sewer
- Home design: Residential property; One-story (all main rooms listed on first floor); Built in 1966
- Construction: Brick construction; Composition roof; Slab foundation
- Exterior features: Back yard fencing; Fence; Located on a cul-de-sac
Interior
- Kitchen: Kitchen on the first floor (approx. 12 x 10)
- Bedrooms: Primary bedroom on the first floor (approx. 18 x 15); Two additional bedrooms on the first floor (each approx. 14 x 11)
- Flooring: Carpet; Tile
- Bathrooms: Two full bathrooms
- Heating & cooling: Central heating (gas); Central electric air conditioning
- Interior features: Carpet and tile flooring; Six total rooms
Neighborhood map
What this means for you Summary
Snapshot
- This is a 3-bed/2.0-bath single-family listed at $195k.
Deal economics
- At list price, monthly cash flow is $147 ($2k/yr) — positive.
- The deal already cash-flows at list — no discount required.
- To meet the 1% rule (rent ≥ 1% of price), the offer needs to be $175k (10.1% below list).
- Recommended offer: $175k (10.1% below list) — sets the bar for 1% rule.
- Cap rate 7.2% vs local median 5.1% in Grangerland — top-decile yield for the area; either an underpriced asset or a hidden risk that comps aren't pricing in. Stress-test before assuming the spread holds.
Location & tenants
- Location reads: area grade C — affects rentability + tenant quality, not the cash-flow math above.
- Conroe ISD (other): math 57% / reading 57% proficiency, ranked #69 of 826 in TX (top 8%) — acceptable for families but not a draw, mixed tenant base, ~2y average lease.
- Zoned schools: Milam El (math 49% / reading 35%, grade F, #1,335 of 4,322 statewide, top 33%, 524 students, 82% FRL); Moorhead J H (math 35% / reading 42%, grade F, #704 of 1,662 statewide, top 43%, 1,391 students, 82% FRL); Conroe H S (math 32% / reading 51%, grade F, #767 of 1,632 statewide, top 47%, 4,915 students, 61% FRL) — zoned schools average 75% FRL vs 34% district-wide (40 pts higher); higher-poverty schools than district average — tighter screening recommended.
- Zoned-school proficiency averages 41% at this address vs 57% district-wide (-16 pts) — the specific schools serving this property underperform the Conroe ISD average; the district grade overstates school quality for this exact location.
- Market conditions: 420 active listings in the ZIP; 3 comparable units currently listed for rent nearby; rentals at typical pace (median 22d on market — plan ~3-4 weeks tenant-placement turnaround); solid renter incomes; 13,259 units permitted in Montgomery County in 2024 (1,402 in 5+ unit buildings).
Forward outlook
- Local home prices are declining (-3.0%/yr); year-one equity from $1k of loan paydown is wiped out by about $6k of value loss. Plan a longer hold.
- Montgomery County population projected at +65% by 2050 — long-run rental-demand tailwind backs the buy-and-hold thesis.
Negotiation context
- It's been on market 29 days — a 2% lower offer ($192k) is reasonable based on typical stale-listing flexibility.
Risks & watch-outs
- Climate carrying-cost: severe wind risk, 99% chance of damaging wind over 30y; moderate wildfire risk; extreme-heat days projected 7→24/yr by 2055 (HVAC capex compounding) — expect insurance premiums to compound above CPI over the hold.
Questions for the listing agent
- Built in 1966 — when were the roof, HVAC, electrical panel, plumbing, and water heater last replaced?
- Is there a deadline driving the sale (1031 exchange, divorce, estate, relocation)? That informs how much negotiation room exists.
- What's the average days-on-market for RENTAL listings here right now (not sales)? A rising rental-DOM trend means longer vacancies and softer asking-rent achievability than the comps imply.
- What's the recent tenant-quality profile in this submarket — average credit score on applications, eviction rate, late-payment / NSF rate, and stable-employment percentage? A property-management company in the area should have these aggregated.
- How much new for-sale + rental construction is in the pipeline within 1–3 miles? Heavy new supply typically softens prices + rents 12–24 months out; constrained supply supports both.
Investment metrics
- 1% rule
- 0.90% ✗
- Cap rate
- 7.20%
- Cash-on-cash
- 3.24%
- DSCR
- 1.14
- GRM
- 9.3
CMA / ARV
- ARV (median comp)
- $222,225
- List price
- $195,000
- Delta
- -12.25%
- Verdict
- UNDERPRICED
- Comps
- 20 within 1.0 mi
Show comp detail 12 sales within ~0.75 mi
| Address | Dist | Beds/Ba | Sqft | Sold | Price | $/sf | Match |
|---|---|---|---|---|---|---|---|
| 14312 Grey Pointe Ct | 0.36mi | 3/2.0 | 1,440 (-3%) | 2mo | $236,940 | $165 | 76 |
| 14150 Granger Pointe | 0.39mi | 3/2.0 | 1,440 (-3%) | 0mo | $213,790 | $148 | 76 |
| 14170 Granger Pointe Ln | 0.36mi | 3/2.0 | 1,426 (-4%) | 0mo | $227,940 | $160 | 76 |
| 14304 Grey Pointe | 0.34mi | 3/2.0 | 1,426 (-4%) | 2mo | $221,590 | $155 | 76 |
| 14162 Granger Pointe Ln | 0.37mi | 3/2.0 | 1,426 (-4%) | 1mo | $214,590 | $150 | 75 |
| 14171 Granger Pointe Ln | 0.34mi | 3/2.0 | 1,405 (-6%) | 0mo | $239,540 | $170 | 75 |
| 14166 Granger Pointe Ln | 0.36mi | 4/2.0 (+1) | 1,557 (+5%) | 2mo | $260,040 | $167 | 69 |
| 14158 Granger Pointe Ln | 0.38mi | 4/2.0 (+1) | 1,557 (+5%) | 2mo | $254,040 | $163 | 68 |
| 17104 Coulter Pine Ct | 0.48mi | 4/2.0 (+1) | 1,583 (+6%) | 2mo | $234,600 | $148 | 60 |
| 16269 Parish Pointe Ct | 0.53mi | 3/2.0 | 1,688 (+13%) | 0mo | $267,240 | $158 | 53 |
| 16261 Parish Pointe Ct | 0.55mi | 3/2.0 | 1,688 (+13%) | 0mo | $266,240 | $158 | 52 |
| 16229 Parish Pointe | 0.62mi | 3/2.0 | 1,688 (+13%) | 2mo | $247,990 | $147 | 47 |
Match score weights: distance 35% · size 25% · config 20% · recency 20%. Top-matched comps best support the ARV.
Projected returns pro-forma
-3.0% appreciation · 3.0% rent growth · sell at horizon
- IRR
- -11.2%
- Equity multiple
- 0.59×
- Total profit
- $-22,250
- Equity at exit
- $29,075
- IRR
- -2.0%
- Equity multiple
- 0.86×
- Total profit
- $-7,451
- Equity at exit
- $16,860
Cash invested: $54,600 (down + closing). Projections, not guarantees.
Landlord ↔ Tenant lean methodology
- Overall (STATE)
- 87 Strongly Landlord-Friendly
- State Texas
- 87 Strongly Landlord-Friendly · R+5
- County
- — inherits STATE
- City
- — inherits STATE
ZIP-level market 77306
- Home prices YoY
- -4.1%
- Active inventory
- 420
- Price-to-rent
- 9.3×
Monthly cashflow live
- Estimated rent
- $1,753 medium interval (Pro) →
- Mortgage (P&I)
- −$1,023
- Tax from tax record
- −$133 /mo · $1,601/yr
- Insurance
- −$81
- HOA
- −$0
- Lot rent
- −$0
- Vacancy / Maint / Mgmt
- −$368
- Net cashflow
- $147
Break-even live
Sensitivity live
| Price | -10% $258 | -5% $203 | +0% $147 | +5% $92 | +10% $37 |
|---|---|---|---|---|---|
| Rent | -10% $9 | -5% $78 | +0% $147 | +5% $217 | +10% $286 |
| Rate | -1.0pp $246 | -0.5pp $197 | base $147 | +0.5pp $97 | +1.0pp $45 |
UW: 25.0% down · 7.5% · 30yr · 1.5% tax · 5.0% vac · 8.0% maint · 8.0% mgmt
Financing live
Cash to close
- Down payment
- $48,750
- Closing costs
- $5,850
- Reserves months
- —
- Total cash needed
- —
Loan-product check · same deal, 3 products live
Conventional
25% down · 7.5% · 30yr
- Down + closing
- —
- Monthly P&I
- —
- Monthly cashflow
- —
- DSCR
- —
- Eligible?
- —
Personal DTI + credit; lowest rate.
DSCR
20% down · 8.5% · 30yr
- Down + closing
- —
- Monthly P&I
- —
- Monthly cashflow
- —
- DSCR
- —
- Eligible?
- —
No personal income docs; deal must DSCR.
Hard money
10% down · 12.0% · 12mo
- Down + closing
- —
- Monthly P&I
- —
- Monthly cashflow
- —
- DSCR
- —
- Eligible?
- —
Short-term bridge; refi at stabilization.
Rent comps 3 comps
| Address | Beds | Baths | Sqft | Rent | $/sqft | DOM | Units | Dist |
|---|---|---|---|---|---|---|---|---|
| 16703 Twisted Pine Dr Conroe, TX | 3.0–4.0 | 2.0–3.0 | 1671 | $1,900 | $1.14 | 0d | 13 | 0.60mi |
| 17892 Brown Rd Conroe, TX | 2.0 | 2.0 | 1500 | $1,300 | $0.87 | 22d | 1 | 1.08mi |
| 15271 Country West Dr Conroe, TX | 3.0 | 2.0 | 1568 | $1,350 | $0.86 | 46d | 1 | 1.47mi |
Listing history 12 events
-
2026-06-09days on market $195,000 Pending 29 DOM
-
2026-06-08days on market $195,000 Pending 28 DOM
-
2026-06-07days on market $195,000 Pending 27 DOM
-
2026-06-04days on market $195,000 Pending 24 DOM
-
2026-06-03days on market $195,000 Pending 23 DOM
-
2026-06-02days on market $195,000 Pending 22 DOM
-
2026-06-01days on market $195,000 Pending 21 DOM
-
2026-05-31statusdays on market $195,000 Pending 20 DOM
-
2026-05-08$195,000 Active 554-char remark
-
2026-03-16soldstatus
-
2025-09-25soldstatus
-
2002-04-26soldstatus
ⓘ Source: listings_history table (triggers on properties + properties_extension) + one-shot
backfill from property_details.listing_events for pre-trigger history.
Tax reassessment forecast TX · Resets to sale price
- Current annual tax
- $1,601 · $133/mo
- Projected year-2 tax
- $3,568 · $297/mo
- Expected delta
- +$1,967/yr (+$164/mo · 122.9%)
ⓘ Screening estimate from a state-policy table — verify with the county assessor before closing.
Climate risk First Street
- Flood 3/10 Moderate FEMA zone X (unshaded) · 20% chance over 30 yrs
- Wildfire 5/10 Major
- Heat 8/10 Severe 7 d/yr ≥112°F today · 24 d/yr by 30 yrs out
- Wind 8/10 Severe 99% chance of damaging wind over 30 yrs
- Air quality 3/10 Moderate 2 unhealthy d/yr today · 3 by 30 yrs out
Nearby sold comps map
Loading sold comps map…
Walkable amenities ~0.75 mi
Loading nearby amenities…
Taxation est. · year 1
- Rental income
- $21,033
- − Mortgage interest
- −$10,923
- − Property taxes
- −$1,601
- − Insurance
- −$975
- − Repairs & maintenance
- −$1,683
- − Management
- −$1,683
- − Depreciation
- −$5,673
- Taxable loss
- −$1,504
- Est. tax savings @ 24.0%
- +$361
- After-tax cash flow
- $2,130/yr
For passive investors: Depreciation is non-cash, so a rental often shows a tax loss while cash-flowing — sheltering income. Rental losses are passive: they offset passive income freely, and up to $25,000/yr can offset ordinary (W-2) income if you actively participate and your MAGI is under $100k (phasing out to $0 by $150k); unused losses carry forward. On sale, claimed depreciation is recaptured at up to 25%, and gains may owe capital-gains tax (a 1031 exchange can defer both). Figures are a year-1 estimate at your 24.0% rate — not tax advice; consult a CPA.
Schools (NCES district)
- District
- Conroe ISD
- NCES district ID
- 4815000
- Math proficiency
- 57% ▼ -6.00%
- Reading proficiency
- 57% ▼ -1.00%
- Median HH income
- $71,541
- Composite
- 50.65/100
- National rank
- #1833
- State rank
- #69 of 826 in TX
Livability — Grangerland
No livability data for this city. (Only ~50 U.S. cities are tracked.)
Census & demographics
- County
- Montgomery County · 663,713 people
- Metro
- Houston-The Woodlands-Sugar Land, TX
- Population (ZIP)
- 18,086
- Household income
- $76,257
- Rent vs Own
- Severe rent burden
- 231.0
Population outlook (Montgomery County) Hauer SSP2
- Today (2025)
- 713,896 people
- By 2030
- 805,263 · +12.8%
- By 2040
- 992,708 · +39.1%
- By 2050
- 1,179,590 · +65.2%
- By 2075
- 1,628,084 · +128.1%
- By 2100
- 1,937,880 · +171.5%
Race, ethnicity, and origin ACS 2023
- Neighborhood character
- Majority Hispanic (55%)
- Race & ethnicity
- Hispanic / Latino 55% White 41% Two or more races 11% Black 2%
- Hispanic origin (detail)
- Mexican 51%
- Common ancestry
- Iranian 1% Slovak 1% Lithuanian 1%
- Foreign-born
- 21% · Canada
- Languages at home
- 53% English-only · Spanish 45% German/W. Germanic 1%
Political lean MEDSL · Montgomery
- 2024 margin
- Solid R (+45.5) · D 26.8% · R 72.3%
- 2008→2024 swing
- +7.2pp toward D · 2008: -52.7pp · 2024: -45.5pp
- All cycles
- 2024: R+45.5 2020: R+43.8 2016: R+51.4 2012: R+60.7 2008: R+52.7
Not yet ingested
- Civics
- —
Market trends
- HPI YoY
- ▼ -13.02%
- Current HPI
- 306.3801
- Rent YoY
- —
- Metro
- Houston-The Woodlands-Sugar Land, TX
- State GDP YoY
- ▲ 3.95%
- F500 in state
- 110
Industry mix (Fortune 500 HQ in TX)
| Industry | F500 HQs | Revenue |
|---|---|---|
| Energy | 16 | $1,198B |
|
||
| Technology | 5 | $198B |
|
||
| Engineering / Construction | 4 | $72B |
|
||
| Energy Services | 3 | $60B |
|
||
| Utilities | 3 | $41B |
|
||
| Healthcare | 2 | $330B |
|
||
Price history
6 events — show timeline
- 2026-06-10 Pending — HARMLS
- 2026-05-30 Pending — HARMLS
- 2026-05-08 Listed $195,000 HARMLS
- 2026-03-16 Sold (Public Records) — Public Records
- 2025-09-25 Sold (Public Records) — Public Records
- 2002-04-26 Sold (Public Records) — Public Records
Property tax history
+4.8%/yrLatest (2025): $1,601 · +9.6% YoY. Source: county tax records.
Cash-flow waterfall
monthlySold comps — $/sqft
last 12 mo · ≤1 miLoading sold comps…