 🏗️ New Construction
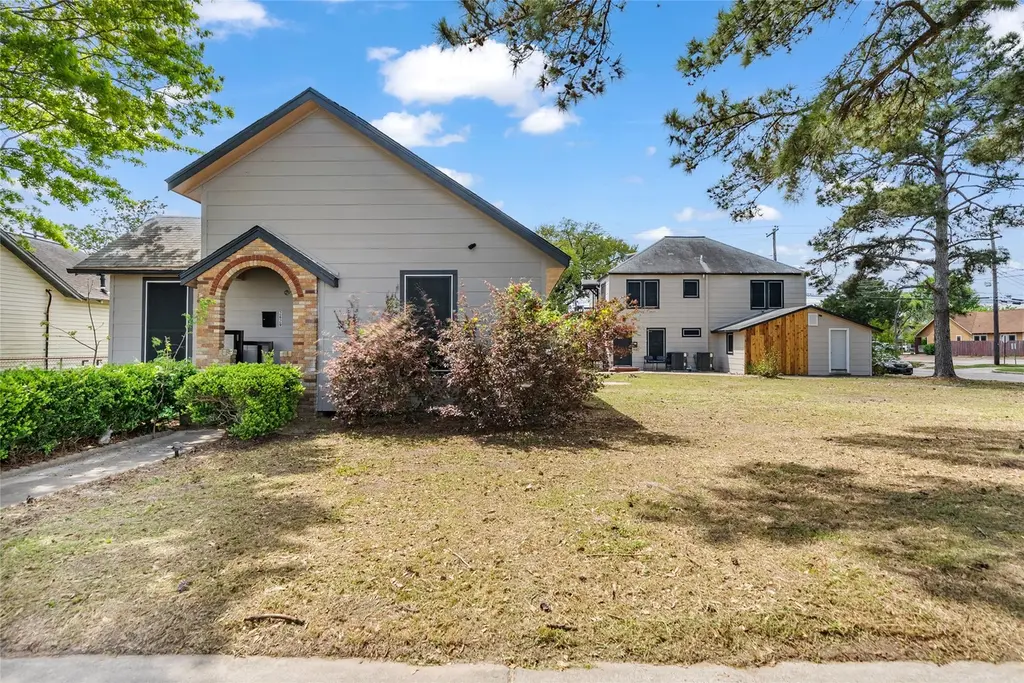
2633 W Main St · Baytown, TX
Flood risk 6/10 · Moderate
- FEMA flood zone
- X (shaded)
- Chance of flooding over 30 yrs
- 0.57%
- Est. flood insurance / yr
- $507 – $1,088
Fire risk 1/10 · Minimal
- Est. fire insurance / yr
- $1,222 – $2,270
Heat risk 9/10 · Severe
- Hot days now (above 108°F)
- 7 days/yr
- Hot days in 30 yrs
- 25 days/yr
Wind risk 9/10 · Severe
- Chance of severe wind over 30 yrs
- 99.0%
Air-quality risk 2/10 · Minimal
- Unhealthy air days now
- 1 days/yr
- Unhealthy air days in 30 yrs
- 2 days/yr
Risk factors via First Street. Map © Google.
Why this score? — see what drove the C grade
The composite is a weighted blend of 9 inputs, each scored 0–100. Each bar is that input's sub-score; the figure is the points it added to the 100-point composite (weight × sub-score).
- Cash flow +23.1/30.0
- ARV discount +7.5/15.0
- DSCR +7.4/10.0
- 1% rule +5.4/10.0
- Livability +3.5/5.0
- Schools +3.2/10.0
- Rent growth +2.8/5.0
- Condition / age +2.5/5.0
- Appreciation +0.0/10.0
$550,000
🖨 Deal sheet 📄 Offer letter ✓ Due diligence
Multi-family units
County records classify this as Multi-Family (2-4 Unit). Listing-text estimate: 1 unit. estimate disagrees with records
Listing remarks
BEAUTIFUL 4-Unit Investment with WHOPPING 11.57% CAP RATE! buy this new complex with new and paying tenants. This property was REBUILT! 2633 & 2629 W Main St. , Baytown, TX. . This income-producing asset includes a 3 bed / 2 bath single-family home, a duplex with two spacious 3 bed / 2 bath units, and a 1 bed / 1 bath garage apartment situated above a detached garage at the rear of the property. The unit mix is ideal for attracting long-term tenants and maximizing rental income, while the separate structures offer flexibility in leasing and management. Perfect for investors seeking stable cash flow from day one! Owner Flnanclng available! Hablamos Español! Pagos de dueno a duen
Key facts
- 0.28 acre lot
- Parking
- Built 2026
Property features AI
Exterior
- Parking: Carport
- Utilities: Electricity available; Water available
- Home design: Residential income property; New construction (2026); Faces east
- Construction: Wood siding; Composition roof; Built in 2026; Builder: Sanmore Investments
- Exterior features: Corner lot; Patio
Interior
- Kitchen: Dishwasher; Refrigerator
- Bedrooms: One 1-bed unit; Three 3-bed units
- Flooring: Plank flooring; Vinyl flooring
- Bathrooms: Two full bathrooms (total listed)
- Heating & cooling: Central heating (electric); Central air (electric)
- Interior features: Patio; Owner is listing agent
- Laundry & utility: Washer hookup; Dryer hookup
Neighborhood map
What this means for you Summary
Snapshot
- This is a 3-bed/2.0-bath multifamily listed at $550k.
Deal economics
- At list price, monthly cash flow is $784 ($9k/yr) — positive.
- The deal already cash-flows at list — no discount required.
- To meet the 1% rule (rent ≥ 1% of price), the offer needs to be $451k (17.9% below list).
- Recommended offer: $451k (17.9% below list) — sets the bar for 1% rule.
- Cap rate 8.5% vs local median 4.2% in Baytown — top-decile yield for the area; either an underpriced asset or a hidden risk that comps aren't pricing in. Stress-test before assuming the spread holds.
Location & tenants
- Location reads 69/100 on livability (#412 in TX) — a middle-class / working-renter tenant base. Strengths: cost of living A+, housing A+; Watch: employment D+, crime F, amenities F.
- Goose Creek CISD (urban): math 37% / reading 36% proficiency, ranked #473 of 826 in TX (top 57%) — families likely to look elsewhere, expect single-tenant / working-renter base with shorter leases; 61% free/reduced lunch — lower-income household profile, screen leases tightly.
- Zoned schools: San Jacinto El (math 32% / reading 27%, grade F, #2,525 of 4,322 statewide, top 62%, 657 students, 91% FRL); High Point School (12 students, 75% FRL) — zoned schools average 83% FRL vs 61% district-wide (22 pts higher); higher-poverty schools than district average — tighter screening recommended.
- Market conditions: Rents rising (+1.3%/yr); 271 active listings in the ZIP; 1 comparable units currently listed for rent nearby; 29,883 units permitted in Harris County in 2024 (8,621 in 5+ unit buildings).
- At $4,514/mo this rent would consume 100% of the median local household income ($54k/yr) (locally 1559% of renters already pay >50% of income on rent) — very limited rent-growth headroom before tenants either downsize or default.
Forward outlook
- Local home prices are declining (-3.0%/yr); year-one equity from $3k of loan paydown is wiped out by about $13k of value loss. Plan a longer hold.
- Harris County population projected at +47% by 2050 — long-run rental-demand tailwind backs the buy-and-hold thesis.
Negotiation context
- It's been on market 35 days — a 3% lower offer ($534k) is reasonable based on typical stale-listing flexibility.
- 7 sale attempts since 3y ago with the ask held roughly flat each time — persistent listings suggest the price (not the market) is what's stuck; bring a comps-based counter.
- Current owner paid $370k; 49% above their basis — modest negotiation headroom, anchor on the comps not their cost.
Risks & watch-outs
- Climate carrying-cost: major flood risk; severe wind risk, 99% chance of damaging wind over 30y; extreme-heat days projected 7→25/yr by 2055 (HVAC capex compounding) — expect insurance premiums to compound above CPI over the hold.
Questions for the listing agent
- It's been on market 35 days. Have you received any prior offers? Is the seller open to a 18% concession, seller financing, or rate buy-down credit?
- Is there a deadline driving the sale (1031 exchange, divorce, estate, relocation)? That informs how much negotiation room exists.
- Schools are D-rated, which usually means shorter tenancies and higher turnover. Who's the typical renter profile here, and what's been the actual vacancy rate?
- Crime grade is F in this area — have there been break-ins, vandalism, or insurance claims at this property in the last 3 years? What carrier currently insures it and at what premium?
- What's the average days-on-market for RENTAL listings here right now (not sales)? A rising rental-DOM trend means longer vacancies and softer asking-rent achievability than the comps imply.
- What's the recent tenant-quality profile in this submarket — average credit score on applications, eviction rate, late-payment / NSF rate, and stable-employment percentage? A property-management company in the area should have these aggregated.
- How much new apartment / multifamily construction is in the pipeline within 1–3 miles? Heavy new supply (>2% of stock underway) typically softens rents 12–24 months out; light construction supports rent growth.
Investment metrics
- 1% rule
- 1.04% ✓
- Cap rate
- 8.45%
- Cash-on-cash
- 7.71%
- DSCR
- 1.34
- GRM
- 8.0
CMA / ARV
- ARV (median comp)
- $435,763
- List price
- $550,000
- Delta
- 26.22%
- Verdict
- OVERPRICED
- Comps
- 2 within 1.0 mi
Projected returns pro-forma
-3.0% appreciation · 1.3% rent growth · sell at horizon
- IRR
- -6.4%
- Equity multiple
- 0.77×
- Total profit
- $-28,336
- Equity at exit
- $64,974
- IRR
- 1.2%
- Equity multiple
- 1.08×
- Total profit
- $9,228
- Equity at exit
- $37,677
Cash invested: $122,014 (down + closing). Projections, not guarantees.
Landlord ↔ Tenant lean methodology
- Overall (STATE)
- 87 Strongly Landlord-Friendly
- State Texas
- 87 Strongly Landlord-Friendly · R+5
- County
- — inherits STATE
- City
- — inherits STATE
ZIP-level market 77520
- Rents YoY
- 1.3%
- Active inventory
- 271
- Price-to-rent
- 38.2×
Monthly cashflow live
- Estimated rent
- $4,514 medium interval (Pro) →
- Mortgage (P&I)
- −$2,285
- Tax from tax record
- −$315 /mo · $3,782/yr
- Insurance
- −$182
- HOA
- −$0
- Vacancy / Maint / Mgmt
- −$948
- Net cashflow
- $784
Break-even live
4-unit breakdown (identical units grouped — click to expand)
| Units | Beds | Baths | Est. rent |
|---|---|---|---|
| 3× units | 3 | 2 | $3,603 |
| #1 | 3 | 2 | $1,201 |
| #2 | 3 | 2 | $1,201 |
| #3 | 3 | 2 | $1,201 |
| 1× unit | 1 | 1 | $910 |
| Total (4 units) | $4,514 | ||
UW: 25.0% down · 7.5% · 30yr · 1.5% tax · 5.0% vac · 8.0% maint · 8.0% mgmt
Financing live
Cash to close
- Down payment
- $108,941
- Closing costs
- $13,073
- Reserves months
- —
- Total cash needed
- —
Loan-product check · same deal, 3 products live
Conventional
25% down · 7.5% · 30yr
- Down + closing
- —
- Monthly P&I
- —
- Monthly cashflow
- —
- DSCR
- —
- Eligible?
- —
Personal DTI + credit; lowest rate.
DSCR
20% down · 8.5% · 30yr
- Down + closing
- —
- Monthly P&I
- —
- Monthly cashflow
- —
- DSCR
- —
- Eligible?
- —
No personal income docs; deal must DSCR.
Hard money
10% down · 12.0% · 12mo
- Down + closing
- —
- Monthly P&I
- —
- Monthly cashflow
- —
- DSCR
- —
- Eligible?
- —
Short-term bridge; refi at stabilization.
Rent comps 1 comps
| Address | Beds | Baths | Sqft | Rent | $/sqft | DOM | Units | Dist |
|---|---|---|---|---|---|---|---|---|
| 811 Barrymore Blvd Baytown, TX | 3.0 | 2.0 | 1200 | $1,300 | $1.08 | 5d | 1 | 0.93mi |
Listing history 30 events
-
2026-06-18days on market $550,000 Active 35 DOM
-
2026-06-17days on market $550,000 Active 34 DOM
-
2026-06-16days on market $550,000 Active 33 DOM
-
2026-06-15days on market $550,000 Active 32 DOM
-
2026-06-13days on market $550,000 Active 30 DOM
-
2026-06-09days on market $550,000 Active 26 DOM
-
2026-06-07days on market $550,000 Active 24 DOM
-
2026-06-04days on market $550,000 Active 21 DOM
-
2026-06-03days on market $550,000 Active 20 DOM
-
2026-06-02days on market $550,000 Active 19 DOM
-
2026-06-01days on market $550,000 Active 18 DOM
-
2026-05-31days on market $550,000 Active 17 DOM
-
2026-05-14$550,000 Active 742-char remark
-
2026-05-13historical
-
2026-05-07price $598,000
-
2026-04-08$650,000 Active
-
2024-06-06historical
-
2023-12-29status Active
-
2023-12-13status Pending, Continue to Show
-
2023-10-20status Active
-
2023-10-18status Pending, Continue to Show
-
2023-09-13soldstatus $370,000
-
2023-09-02$365,000 Active
-
2023-06-08historical
-
2023-05-09price $365,000
-
2023-03-30$385,000 Active
-
2023-03-10historical
-
2023-01-26$439,000 Active
-
2022-03-03soldstatus
-
2021-12-15soldstatus $126,600
ⓘ Source: listings_history table (triggers on properties + properties_extension) + one-shot
backfill from property_details.listing_events for pre-trigger history.
Tax reassessment forecast TX · Resets to sale price
- Current annual tax
- $3,782 · $315/mo
- Projected year-2 tax
- $10,065 · $839/mo
- Expected delta
- +$6,283/yr (+$524/mo · 166.1%)
ⓘ Screening estimate from a state-policy table — verify with the county assessor before closing.
Climate risk First Street
- Flood 6/10 Major FEMA zone X (shaded) · 57% chance over 30 yrs
- Wildfire 1/10 Low
- Heat 9/10 Extreme 7 d/yr ≥108°F today · 25 d/yr by 30 yrs out
- Wind 9/10 Extreme 99% chance of damaging wind over 30 yrs
- Air quality 2/10 Low 1 unhealthy d/yr today · 2 by 30 yrs out
Nearby sold comps map
Loading sold comps map…
Walkable amenities ~0.75 mi
Loading nearby amenities…
Taxation est. · year 1
- Rental income
- $54,168
- − Mortgage interest
- −$24,410
- − Property taxes
- −$3,782
- − Insurance
- −$2,179
- − Repairs & maintenance
- −$4,333
- − Management
- −$4,333
- − Depreciation
- −$12,677
- Taxable income
- $2,454
- Est. tax owed @ 24.0%
- −$589
- After-tax cash flow
- $8,821/yr
For passive investors: Depreciation is non-cash, so a rental often shows a tax loss while cash-flowing — sheltering income. Rental losses are passive: they offset passive income freely, and up to $25,000/yr can offset ordinary (W-2) income if you actively participate and your MAGI is under $100k (phasing out to $0 by $150k); unused losses carry forward. On sale, claimed depreciation is recaptured at up to 25%, and gains may owe capital-gains tax (a 1031 exchange can defer both). Figures are a year-1 estimate at your 24.0% rate — not tax advice; consult a CPA.
Schools (NCES district)
- District
- Goose Creek CISD
- NCES district ID
- 4821150
- Math proficiency
- 37% ▼ -11.00%
- Reading proficiency
- 36% ▼ -4.00%
- Median HH income
- $52,468
- Composite
- 31.84/100
- National rank
- #5877
- State rank
- #473 of 826 in TX
Livability — Baytown
- Score
- 69/100
- State rank
- #412
- US rank
- #8494
Category grades
Schools grade is shown separately in the Schools card above.
Census & demographics
- Census place
- Baytown, TX
- County
- Harris County · 4,702,590 people
- City population
- 135,579
- Metro
- Houston-The Woodlands-Sugar Land, TX
- Population (ZIP)
- 36,355
- Household income
- $54,278
- Rent vs Own
- Severe rent burden
- 1559.0
Population outlook (Harris County) Hauer SSP2
- Today (2025)
- 5,571,493 people
- By 2030
- 6,089,821 · +9.3%
- By 2040
- 7,142,806 · +28.2%
- By 2050
- 8,185,864 · +46.9%
- By 2075
- 10,574,329 · +89.8%
- By 2100
- 12,109,958 · +117.4%
Race, ethnicity, and origin ACS 2023
- Neighborhood character
- Diverse neighborhood (Simpson 0.60)
- Race & ethnicity
- Hispanic / Latino 55% White 30% Two or more races 19% Black 10% Asian 2%
- Hispanic origin (detail)
- Mexican 48%
- Common ancestry
- Italian 1% Lithuanian 1% Romanian 1%
- Foreign-born
- 21% · Canada, Vietnam
- Languages at home
- 55% English-only · Spanish 43% Other Asian/Pacific 1% Other Indo-European 1%
Political lean MEDSL · Harris
- 2024 margin
- Lean D (+5.5) · D 52.0% · R 46.4% · Other 1.6%
- 2008→2024 swing
- +3.9pp toward D · 2008: 1.6pp · 2024: 5.5pp
- All cycles
- 2024: D+5.5 2020: D+13.3 2016: D+12.4 2012: D+0.1 2008: D+1.6
Not yet ingested
- Civics
- —
Market trends
- HPI YoY
- ▼ -143.36%
- Current HPI
- 262.066
- Rent YoY
- ▲ 1.30%
- Metro
- Houston-The Woodlands-Sugar Land, TX
- State GDP YoY
- ▲ 3.95%
- F500 in state
- 110
Industry mix (Fortune 500 HQ in TX)
| Industry | F500 HQs | Revenue |
|---|---|---|
| Energy | 16 | $1,198B |
|
||
| Technology | 5 | $198B |
|
||
| Engineering / Construction | 4 | $72B |
|
||
| Energy Services | 3 | $60B |
|
||
| Utilities | 3 | $41B |
|
||
| Healthcare | 2 | $330B |
|
||
Price history
+334.4% since first listed18 events — show timeline
- 2026-05-14 Listed $550,000 HARMLS
- 2026-05-13 Listing Removed — HARMLS
- 2026-05-07 Price Changed $598,000 HARMLS
- 2026-04-08 Listed $650,000 HARMLS
- 2024-06-06 Listing Removed — HARMLS
- 2023-12-29 Relisted — HARMLS
- 2023-12-13 Pending — HARMLS
- 2023-10-20 Relisted — HARMLS
- 2023-10-18 Pending — HARMLS
- 2023-09-13 Sold (Public Records) $370,000 Public Records
- 2023-09-02 Listed $365,000 HARMLS
- 2023-06-08 Listing Removed — HARMLS
- 2023-05-09 Price Changed $365,000 HARMLS
- 2023-03-30 Listed $385,000 HARMLS
- 2023-03-10 Listing Removed — HARMLS
- 2023-01-26 Listed $439,000 HARMLS
- 2022-03-03 Sold (Public Records) — Public Records
- 2021-12-15 Sold (Public Records) $126,600 Public Records
Property tax history
+6.4%/yrLatest (2025): $3,782 · -8.0% YoY. Source: county tax records.
Cash-flow waterfall
monthlySold comps — $/sqft
last 12 mo · ≤1 miLoading sold comps…