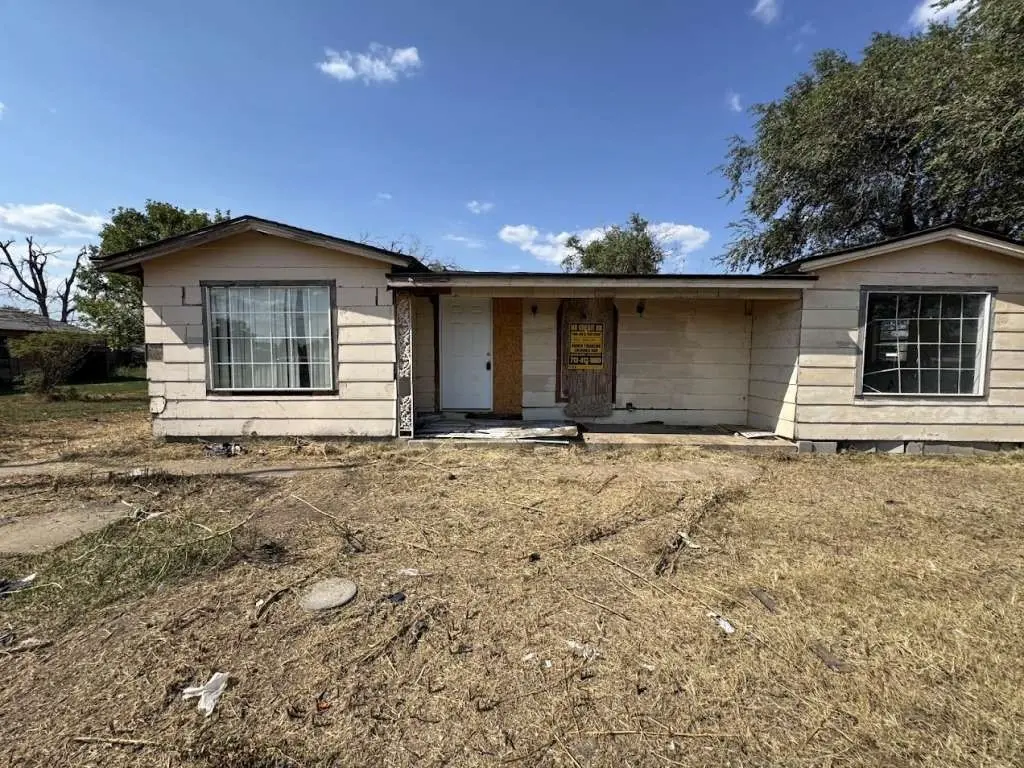
1511 Gray St · Plainview, TX
Flood risk 8/10 · Major
- FEMA flood zone
- A
- Chance of flooding over 30 yrs
- 0.78%
- Est. flood insurance / yr
- $1,009 – $1,996
Fire risk 1/10 · Minimal
- Est. fire insurance / yr
- $1,222 – $2,270
Heat risk 5/10 · Moderate
- Hot days now (above 99°F)
- 8 days/yr
- Hot days in 30 yrs
- 23 days/yr
Wind risk 2/10 · Minimal
- Chance of severe wind over 30 yrs
- 1.0%
Air-quality risk 2/10 · Minimal
- Unhealthy air days now
- 1 days/yr
- Unhealthy air days in 30 yrs
- 1 days/yr
Risk factors via First Street. Map © Google.
Why this score? — see what drove the B+ grade
The composite is a weighted blend of 9 inputs, each scored 0–100. Each bar is that input's sub-score; the figure is the points it added to the 100-point composite (weight × sub-score).
- Cash flow +30.0/30.0
- ARV discount +15.0/15.0
- 1% rule +10.0/10.0
- DSCR +10.0/10.0
- Livability +3.5/5.0
- Schools +3.3/10.0
- Rent growth +2.5/5.0
- Condition / age +2.5/5.0
- Appreciation +0.0/10.0
$42,999
🖨 Deal sheet 📄 Offer letter ✓ Due diligence
Listing remarks MLS
JUST LISTED! Welcome to a fantastic opportunity! This fixer-upper home, boasting three bedrooms and one bathroom spread across 1,302 square feet, awaits your creative touch. Located north of Lubbock, TX, this property offers easy access to Hwy 70, simplifying your commute and enhancing your convenience. With a little TLC, this home has the potential to become your dream residence. Here you will be just down the road from recreational areas such as Frisco Park and E Givens Park. There are also plenty of local grocery shops, restaurants, and markets nearby. The house is being sold AS IS but will have a NEW ROOF. WE MAKE IT EASY TO OWN. This is a great opportunity! Don't wait, call us today to get more information on the owner's easy terms and smooth process that may be able to put the deed in your name and make this your dream home. When you call be sure and ask about the other homes that we may have for sale in the Plainview Area.
Key facts
- Recreational areas
- New roof
- 7,492 sq ft lot
Tags
Neighborhood map
What this means for you Summary
Snapshot
- This is a 3-bed/1.0-bath single-family listed at $43k.
Deal economics
- At list price, monthly cash flow is $532 ($6k/yr) — positive.
- The deal already cash-flows at list — no discount required.
- Meets the 1% rule at list price ($1k rent vs $43k).
- Recommended offer: $38k (12.0% below list) — sets the bar for market timing.
Location & tenants
- Location reads 69/100 on livability (#393 in TX) — a middle-class / working-renter tenant base. Strengths: cost of living A+, housing A+; Watch: schools C-, crime C-, health & safety C-.
- Plainview ISD (town): math 41% / reading 37% proficiency, ranked #445 of 826 in TX (top 54%) — families likely to look elsewhere, expect single-tenant / working-renter base with shorter leases; 69% free/reduced lunch — lower-income household profile, screen leases tightly.
- Market conditions: 150 active listings in the ZIP; 13 units permitted in Hale County in 2024 (0 in 5+ unit buildings).
- This rent runs 31% of the median local income ($47k/yr) — at the standard rent-burdened threshold; future hikes will face affordability resistance.
Forward outlook
- Local home prices are declining (-3.0%/yr); year-one equity from $297 of loan paydown is wiped out by about $1k of value loss. Plan a longer hold.
- Hale County population projected at -27% by 2050 — secular population decline; favor cash flow + early exit over multi-decade hold.
- At projected returns (-3.0% appreciation + 3.0% rent growth), your $12k cash investment doubles in ~3 years — after that, you're playing with house money.
Negotiation context
- It's been on market 126 days — a 12% lower offer ($38k) is reasonable based on typical stale-listing flexibility.
- 2 sale attempts since 2y ago with the ask held roughly flat each time — persistent listings suggest the price (not the market) is what's stuck; bring a comps-based counter.
Risks & watch-outs
- Watch-outs: flood insurance adds $125/mo; built in 1950 — expect roof / HVAC / electrical / plumbing capex.
- Climate carrying-cost: in FEMA flood zone A (mandatory federal flood insurance); extreme-heat days projected 8→23/yr by 2055 (HVAC capex compounding) — expect insurance premiums to compound above CPI over the hold.
Questions for the listing agent
- It's been on market 126 days. Have you received any prior offers? Is the seller open to a 12% concession, seller financing, or rate buy-down credit?
- Built in 1950 — when were the roof, HVAC, electrical panel, plumbing, and water heater last replaced?
- What's the actual annual flood-insurance premium (NFIP or private), and is the property in a SFHA with mandatory coverage?
- Why hasn't it sold? Are there any deal-killer items the seller is aware of (foundation, flood, title, zoning, code violations)?
- Is there a deadline driving the sale (1031 exchange, divorce, estate, relocation)? That informs how much negotiation room exists.
- What's the average days-on-market for RENTAL listings here right now (not sales)? A rising rental-DOM trend means longer vacancies and softer asking-rent achievability than the comps imply.
- What's the recent tenant-quality profile in this submarket — average credit score on applications, eviction rate, late-payment / NSF rate, and stable-employment percentage? A property-management company in the area should have these aggregated.
- How much new for-sale + rental construction is in the pipeline within 1–3 miles? Heavy new supply typically softens prices + rents 12–24 months out; constrained supply supports both.
Investment metrics
- 1% rule
- 2.86% ✓
- Cap rate
- 24.63%
- Cash-on-cash
- 65.49%
- DSCR
- 3.91
- GRM
- 2.9
CMA / ARV
- ARV (median comp)
- $78,492
- List price
- $42,999
- Delta
- -45.22%
- Verdict
- UNDERPRICED
- Comps
- 1 within 2.0 mi
Projected returns pro-forma
-3.0% appreciation · 3.0% rent growth · sell at horizon
- IRR
- 51.2%
- Equity multiple
- 3.24×
- Total profit
- $27,014
- Equity at exit
- $6,411
- IRR
- 56.6%
- Equity multiple
- 6.61×
- Total profit
- $67,572
- Equity at exit
- $3,718
Cash invested: $12,040 (down + closing). Projections, not guarantees.
Landlord ↔ Tenant lean methodology
- Overall (STATE)
- 87 Strongly Landlord-Friendly
- State Texas
- 87 Strongly Landlord-Friendly · R+5
- County
- — inherits STATE
- City
- — inherits STATE
ZIP-level market 79072
- Active inventory
- 150
- Price-to-rent
- 2.9×
Monthly cashflow live
- Estimated rent
- $1,228 medium interval (Pro) →
- Mortgage (P&I)
- −$225
- Tax from tax record
- −$70 /mo · $835/yr
- Insurance
- −$18
- Flood insurance flood zone
- −$125 /mo · $1,502/yr
- HOA
- −$0
- Vacancy / Maint / Mgmt
- −$258
- Net cashflow
- $532
Break-even live
UW: 25.0% down · 7.5% · 30yr · 1.5% tax · 5.0% vac · 8.0% maint · 8.0% mgmt
Financing live
Cash to close
- Down payment
- $10,750
- Closing costs
- $1,290
- Reserves months
- —
- Total cash needed
- —
Loan-product check · same deal, 3 products live
Conventional
25% down · 7.5% · 30yr
- Down + closing
- —
- Monthly P&I
- —
- Monthly cashflow
- —
- DSCR
- —
- Eligible?
- —
Personal DTI + credit; lowest rate.
DSCR
20% down · 8.5% · 30yr
- Down + closing
- —
- Monthly P&I
- —
- Monthly cashflow
- —
- DSCR
- —
- Eligible?
- —
No personal income docs; deal must DSCR.
Hard money
10% down · 12.0% · 12mo
- Down + closing
- —
- Monthly P&I
- —
- Monthly cashflow
- —
- DSCR
- —
- Eligible?
- —
Short-term bridge; refi at stabilization.
Listing history 20 events
-
2026-06-19days on market $42,999 Active 126 DOM
-
2026-06-18days on market $42,999 Active 125 DOM
-
2026-06-17days on market $42,999 Active 124 DOM
-
2026-06-16days on market $42,999 Active 123 DOM
-
2026-06-15days on market $42,999 Active 122 DOM
-
2026-06-14days on market $42,999 Active 120 DOM
-
2026-06-12days on market $42,999 Active 119 DOM
-
2026-06-09days on market $42,999 Active 116 DOM
-
2026-06-08days on market $42,999 Active 115 DOM
-
2026-06-07days on market $42,999 Active 114 DOM
-
2026-06-07days on market $42,999 Active 113 DOM
-
2026-06-03days on market $42,999 Active 110 DOM
-
2026-06-02days on market $42,999 Active 109 DOM
-
2026-06-01days on market $42,999 Active 108 DOM
-
2026-05-31days on market $42,999 Active 107 DOM
-
2026-05-30days on market $42,999 Active 106 DOM
-
2026-02-13$42,999 Active 944-char remark
Show marketing remark (944 chars)
JUST LISTED! Welcome to a fantastic opportunity! This fixer-upper home, boasting three bedrooms and one bathroom spread across 1,302 square feet, awaits your creative touch. Located north of Lubbock, TX, this property offers easy access to Hwy 70, simplifying your commute and enhancing your convenience. With a little TLC, this home has the potential to become your dream residence. Here you will be just down the road from recreational areas such as Frisco Park and E Givens Park. There are also plenty of local grocery shops, restaurants, and markets nearby. The house is being sold AS IS but will have a NEW ROOF. WE MAKE IT EASY TO OWN. This is a great opportunity! Don't wait, call us today to get more information on the owner's easy terms and smooth process that may be able to put the deed in your name and make this your dream home. When you call be sure and ask about the other homes that we may have for sale in the Plainview Area.
-
2025-09-10historical
-
2024-09-10$35,889 Active
-
2023-06-20soldstatus
ⓘ Source: listings_history table (triggers on properties + properties_extension) + one-shot
backfill from property_details.listing_events for pre-trigger history.
Tax reassessment forecast TX · Resets to sale price
- Current annual tax
- $835 · $70/mo
- Projected year-2 tax
- $835 · $70/mo
- Expected delta
- $0/yr ($0/mo · 0.0%)
ⓘ Screening estimate from a state-policy table — verify with the county assessor before closing.
Climate risk First Street
- Flood 8/10 Severe FEMA zone A · 78% chance over 30 yrs
- Wildfire 1/10 Low
- Heat 5/10 Major 8 d/yr ≥99°F today · 23 d/yr by 30 yrs out
- Wind 2/10 Low 100% chance of damaging wind over 30 yrs
- Air quality 2/10 Low 1 unhealthy d/yr today · 1 by 30 yrs out
Nearby sold comps map
Loading sold comps map…
Walkable amenities ~0.75 mi
Loading nearby amenities…
Taxation est. · year 1
- Rental income
- $14,735
- − Mortgage interest
- −$2,409
- − Property taxes
- −$835
- − Insurance
- −$1,717
- − Repairs & maintenance
- −$1,179
- − Management
- −$1,179
- − Depreciation
- −$1,251
- Taxable income
- $6,166
- Est. tax owed @ 24.0%
- −$1,480
- After-tax cash flow
- $4,903/yr
For passive investors: Depreciation is non-cash, so a rental often shows a tax loss while cash-flowing — sheltering income. Rental losses are passive: they offset passive income freely, and up to $25,000/yr can offset ordinary (W-2) income if you actively participate and your MAGI is under $100k (phasing out to $0 by $150k); unused losses carry forward. On sale, claimed depreciation is recaptured at up to 25%, and gains may owe capital-gains tax (a 1031 exchange can defer both). Figures are a year-1 estimate at your 24.0% rate — not tax advice; consult a CPA.
Schools (NCES district)
- District
- Plainview ISD
- NCES district ID
- 4835070
- Math proficiency
- 41% ▼ -3.00%
- Reading proficiency
- 37% ▲ 1.00%
- Median HH income
- $41,146
- Composite
- 32.85/100
- National rank
- #5615
- State rank
- #445 of 826 in TX
Livability — Plainview
- Score
- 69/100
- State rank
- #393
- US rank
- #8233
Category grades
Schools grade is shown separately in the Schools card above.
Census & demographics
- Census place
- Plainview, TX
- County
- Hale County · 25,389 people
- City population
- 25,389
- Metro
- Plainview, TX
- Population (ZIP)
- 25,389
- Household income
- $47,255
- Rent vs Own
- Severe rent burden
- 1015.0
Population outlook (Hale County) Hauer SSP2
- Today (2025)
- 30,851 people
- By 2030
- 29,158 · -5.5%
- By 2040
- 25,681 · -16.8%
- By 2050
- 22,420 · -27.3%
- By 2075
- 15,857 · -48.6%
- By 2100
- 10,500 · -66.0%
Race, ethnicity, and origin ACS 2023
- Neighborhood character
- Majority Hispanic (63%)
- Race & ethnicity
- Hispanic / Latino 63% White 29% Two or more races 19% Black 4% Native American 2%
- Hispanic origin (detail)
- Mexican 52%
- Common ancestry
- Italian 1% Russian 1% Lithuanian 1%
- Foreign-born
- 11% · Canada, Jamaica
- Languages at home
- 63% English-only · Spanish 36%
Political lean MEDSL · Hale
- 2024 margin
- Solid R (+58.0) · D 20.5% · R 78.5%
- 2008→2024 swing
- -13.1pp toward R · 2008: -44.9pp · 2024: -58.0pp
- All cycles
- 2024: R+58.0 2020: R+51.1 2016: R+48.4 2012: R+47.8 2008: R+44.9
Not yet ingested
- Civics
- —
Market trends
- HPI YoY
- ▼ -120.38%
- Current HPI
- 127.9276
- Rent YoY
- —
- Metro
- Plainview, TX
- State GDP YoY
- ▲ 3.95%
- F500 in state
- 110
Industry mix (Fortune 500 HQ in TX)
| Industry | F500 HQs | Revenue |
|---|---|---|
| Energy | 16 | $1,198B |
|
||
| Technology | 5 | $198B |
|
||
| Engineering / Construction | 4 | $72B |
|
||
| Energy Services | 3 | $60B |
|
||
| Utilities | 3 | $41B |
|
||
| Healthcare | 2 | $330B |
|
||
Price history
+19.8% since first listed4 events — show timeline
- 2026-02-13 Listed $42,999 HARMLS
- 2025-09-10 Listing Removed — HARMLS
- 2024-09-10 Listed $35,889 HARMLS
- 2023-06-20 Sold (Public Records) — Public Records
Property tax history
+6.5%/yrLatest (2025): $835 · -3.0% YoY. Source: county tax records.
Cash-flow waterfall
monthlySold comps — $/sqft
last 12 mo · ≤1 miLoading sold comps…