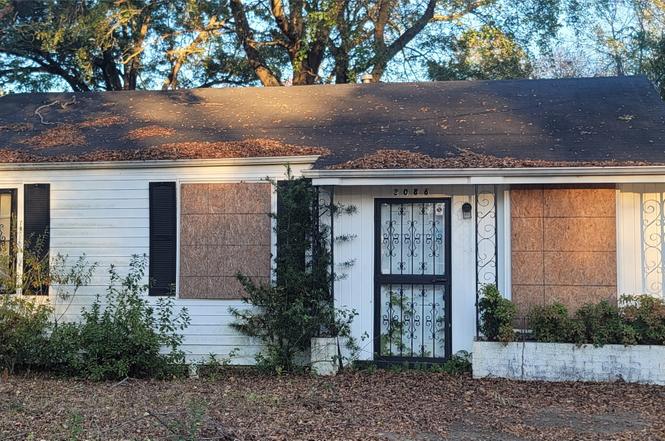
3086 Texas St · Montgomery, AL
Flood risk 1/10 · Minimal
- FEMA flood zone
- X (unshaded)
- Chance of flooding over 30 yrs
- 0.0%
- Est. flood insurance / yr
- $507 – $1,088
Fire risk 3/10 · Minor
- Est. fire insurance / yr
- $916 – $1,700
Heat risk 7/10 · Major
- Hot days now (above 107°F)
- 6 days/yr
- Hot days in 30 yrs
- 17 days/yr
Wind risk 8/10 · Major
- Chance of severe wind over 30 yrs
- 80.0%
Air-quality risk 3/10 · Minor
- Unhealthy air days now
- 4 days/yr
- Unhealthy air days in 30 yrs
- 4 days/yr
Risk factors via First Street. Map © Google.
Why this score? — see what drove the B grade
The composite is a weighted blend of 9 inputs, each scored 0–100. Each bar is that input's sub-score; the figure is the points it added to the 100-point composite (weight × sub-score).
- Cash flow +30.0/30.0
- ARV discount +15.0/15.0
- 1% rule +10.0/10.0
- DSCR +10.0/10.0
- Livability +3.2/5.0
- Rent growth +2.5/5.0
- Condition / age +2.5/5.0
- Schools +1.7/10.0
- Appreciation +0.0/10.0
$39,000
🖨 Deal sheet 📄 Offer letter ✓ Due diligence
Listing remarks MLS
A picture is worth a thousand words and so is my photo gallery. Home has brand new carpet throughout the house, stove, refrigerator, washer & dryer and shows like a dream. There is a nice window seat in one of the bedrooms, a living-dining combo and a separate den. The back yard is beautiful and has a nice patio as well as a small fish pond. Go take a look - you'll be glad you did. Verify school zones with Board of Education.
Key facts
- 0.37 acre lot
- Parking
- Built 1952
Property features AI
Exterior
- Parking: Driveway
- Utilities: Cable available; Electricity available; Natural gas available; Public water; Public sewer
- Home design: Single-story; Vinyl siding
- Construction: Built per public records; Slab foundation
- Exterior features: City lot; Mature trees; Irregular lot dimensions (50 x 155 x 35 x 100 x 85 x 255)
Interior
- Kitchen: First-floor kitchen
- Bedrooms: Two first-floor bedrooms
- Flooring: Carpet; Tile; Vinyl
- Bathrooms: One full bathroom (first floor)
- Interior features: Living/Dining room configuration; Foyer
- Laundry & utility: First-floor laundry; Water heater
Neighborhood map
What this means for you Summary
Snapshot
- This is a 3-bed/1.0-bath single-family listed at $39k.
Deal economics
- At list price, monthly cash flow is $570 ($7k/yr) — positive.
- The deal already cash-flows at list — no discount required.
- Meets the 1% rule at list price ($1k rent vs $39k).
- Cap rate 23.8% vs local median 6.0% in Montgomery — top-decile yield for the area; either an underpriced asset or a hidden risk that comps aren't pricing in. Stress-test before assuming the spread holds.
Location & tenants
- Location reads 65/100 on livability (#138 in AL) — a middle-class / working-renter tenant base. Strengths: cost of living A+, housing A+; Watch: schools C-, employment D, crime F.
- Montgomery County (urban): math 9% / reading 31% proficiency, ranked #106 of 129 in AL (top 82%) — low school quality limits family demand, transient renter base, plan for 1-2y turnover; 70% free/reduced lunch — lower-income household profile, screen leases tightly.
- Market conditions: 62 active listings in the ZIP; 40 comparable units currently listed for rent nearby; rentals lingering (median 44d on market — plan ~5-8 weeks vacancy on turnover, expect pricing pressure); 62% of comp listings sitting > 30 days — soft ceiling on asking rent; 460 units permitted in Montgomery County in 2024 (37 in 5+ unit buildings).
Forward outlook
- Local home prices are declining (-3.0%/yr); year-one equity from $270 of loan paydown is wiped out by about $1k of value loss. Plan a longer hold.
- Montgomery County population projected to shrink 8% by 2050 — rents likely to lag national; underwrite the cash flow, not the appreciation.
- At projected returns (-3.0% appreciation + 3.0% rent growth), your $11k cash investment doubles in ~2 years — after that, you're playing with house money.
Negotiation context
- Only 3 days on market — expect competitive offers; lowballing is unlikely to land.
- 3 sale attempts since 10y ago with the ask held roughly flat each time — persistent listings suggest the price (not the market) is what's stuck; bring a comps-based counter.
- Current owner paid $30k; 30% above their basis — modest negotiation headroom, anchor on the comps not their cost.
Risks & watch-outs
- Watch-outs: built in 1952 — expect roof / HVAC / electrical / plumbing capex.
- Climate carrying-cost: severe wind risk, 80% chance of damaging wind over 30y; extreme-heat days projected 6→17/yr by 2055 (HVAC capex compounding) — expect insurance premiums to compound above CPI over the hold.
Questions for the listing agent
- Built in 1952 — when were the roof, HVAC, electrical panel, plumbing, and water heater last replaced?
- Is there a deadline driving the sale (1031 exchange, divorce, estate, relocation)? That informs how much negotiation room exists.
- Crime grade is F in this area — have there been break-ins, vandalism, or insurance claims at this property in the last 3 years? What carrier currently insures it and at what premium?
- What's the average days-on-market for RENTAL listings here right now (not sales)? A rising rental-DOM trend means longer vacancies and softer asking-rent achievability than the comps imply.
- What's the recent tenant-quality profile in this submarket — average credit score on applications, eviction rate, late-payment / NSF rate, and stable-employment percentage? A property-management company in the area should have these aggregated.
- How much new for-sale + rental construction is in the pipeline within 1–3 miles? Heavy new supply typically softens prices + rents 12–24 months out; constrained supply supports both.
Investment metrics
- 1% rule
- 2.71% ✓
- Cap rate
- 23.82%
- Cash-on-cash
- 62.60%
- DSCR
- 3.79
- GRM
- 3.1
CMA / ARV
- ARV (on-the-fly)
- $58,038
- Comps found
- 12
Show comp detail 12 sales within ~0.75 mi
| Address | Dist | Beds/Ba | Sqft | Sold | Price | $/sf | Match |
|---|---|---|---|---|---|---|---|
| 1833 Midway St | 0.16mi | 3/1.0 | 1,175 (+3%) | 1mo | $64,900 | $55 | 86 |
| 3129 Cabot St | 0.19mi | 3/2.0 | 1,099 (-3%) | 1mo | $17,501 | $16 | 81 |
| 1945 Gibson St | 0.10mi | 3/1.0 | 1,045 (-8%) | 2mo | $23,000 | $22 | 80 |
| 3025 Baffin Dr | 0.39mi | 3/1.0 | 1,146 (+1%) | 6mo | $50,000 | $44 | 76 |
| 1930 Gibson St | 0.05mi | 3/2.0 | 1,040 (-9%) | 4mo | $63,500 | $61 | 76 |
| 1515 Baffin Ct | 0.40mi | 3/1.0 | 1,025 (-10%) | 3mo | $26,000 | $25 | 62 |
| 3329 Texas St | 0.27mi | 3/1.0 | 1,000 (-12%) | 7mo | $70,000 | $70 | 62 |
| 1544 Gibson St | 0.43mi | 3/1.0 | 1,025 (-10%) | 2mo | $52,000 | $51 | 61 |
| 1641 N Yarbrough Ct | 0.45mi | 3/1.0 | 1,215 (+7%) | 8mo | $75,000 | $62 | 61 |
| 2003 Miller St | 0.44mi | 2/1.0 (-1) | 1,044 (-8%) | 2mo | $54,000 | $52 | 59 |
| 132 Amanda Ln | 0.72mi | 3/2.0 | 1,118 (-2%) | 1mo | $45,000 | $40 | 58 |
| 1949 Johnson St | 0.31mi | 2/1.0 (-1) | 1,296 (+14%) | 2mo | $57,000 | $44 | 55 |
Match score weights: distance 35% · size 25% · config 20% · recency 20%. Top-matched comps best support the ARV.
Projected returns pro-forma
-3.0% appreciation · 3.0% rent growth · sell at horizon
- IRR
- 61.6%
- Equity multiple
- 3.75×
- Total profit
- $29,978
- Equity at exit
- $5,815
- IRR
- 66.2%
- Equity multiple
- 7.67×
- Total profit
- $72,882
- Equity at exit
- $3,372
Cash invested: $10,920 (down + closing). Projections, not guarantees.
Landlord ↔ Tenant lean methodology
- Overall (STATE)
- 90 Strongly Landlord-Friendly
- State Alabama
- 90 Strongly Landlord-Friendly · R+15
- County
- — inherits STATE
- City
- — inherits STATE
ZIP-level market 36110
- Home prices YoY
- -34.8%
- Active inventory
- 62
- Price-to-rent
- 3.1×
Monthly cashflow live
- Estimated rent
- $1,058 high interval (Pro) →
- Mortgage (P&I)
- −$205
- Tax from tax record
- −$45 /mo · $541/yr
- Insurance
- −$16
- HOA
- −$0
- Vacancy / Maint / Mgmt
- −$222
- Net cashflow
- $570
Break-even live
UW: 25.0% down · 7.5% · 30yr · 1.5% tax · 5.0% vac · 8.0% maint · 8.0% mgmt
Financing live
Cash to close
- Down payment
- $9,750
- Closing costs
- $1,170
- Reserves months
- —
- Total cash needed
- —
Loan-product check · same deal, 3 products live
Conventional
25% down · 7.5% · 30yr
- Down + closing
- —
- Monthly P&I
- —
- Monthly cashflow
- —
- DSCR
- —
- Eligible?
- —
Personal DTI + credit; lowest rate.
DSCR
20% down · 8.5% · 30yr
- Down + closing
- —
- Monthly P&I
- —
- Monthly cashflow
- —
- DSCR
- —
- Eligible?
- —
No personal income docs; deal must DSCR.
Hard money
10% down · 12.0% · 12mo
- Down + closing
- —
- Monthly P&I
- —
- Monthly cashflow
- —
- DSCR
- —
- Eligible?
- —
Short-term bridge; refi at stabilization.
Rent comps 40 comps
| Address | Beds | Baths | Sqft | Rent | $/sqft | DOM | Units | Dist |
|---|---|---|---|---|---|---|---|---|
| 1817 Texas Ct Montgomery, AL | 3.0 | 1.0 | 925 | $1,050 | $1.14 | 21d | 1 | 0.10mi |
| 3050 Willena Ave Montgomery, AL | 3.0 | 1.0 | 1466 | $985 | $0.67 | 21d | 1 | 0.13mi |
| 3114 Cotton St Montgomery, AL | 3.0 | 1.0 | 888 | $1,100 | $1.24 | 43d | 1 | 0.23mi |
| 3008 Cabot St Montgomery, AL | 4.0 | 2.0 | 1300 | $1,150 | $0.88 | 43d | 1 | 0.26mi |
| 2056 Midway St Montgomery, AL | 3.0 | 1.0 | 1110 | $985 | $0.89 | 43d | 1 | 0.28mi |
| 3329 Texas St Montgomery, AL | 3.0 | 1.0 | 1000 | $1,100 | $1.10 | 43d | 1 | 0.29mi |
| 3042 George B Edmondson Dr Montgomery, AL | 3.0 | 1.0 | 900 | $860 | $0.96 | 43d | 1 | 0.30mi |
| 2111 Yarbrough St Montgomery, AL | 3.0 | 1.0 | 962 | $795 | $0.83 | 43d | 1 | 0.32mi |
| 2076 Midway St Montgomery, AL | 3.0 | 1.0 | 1068 | $1,000 | $0.94 | 43d | 1 | 0.33mi |
| 2107 Yarbrough Cir Montgomery, AL | 3.0 | 1.0 | 910 | $925 | $1.02 | 43d | 1 | 0.33mi |
| 2019 Amos St Montgomery, AL | 3.0 | 1.5 | 1134 | $985 | $0.87 | 43d | 1 | 0.34mi |
| 3452 Harris St Montgomery, AL | 3.0 | 1.0 | 1400 | $1,150 | $0.82 | 21d | 1 | 0.42mi |
| 1653 N Yarbrough Ct Montgomery, AL | 3.0 | 1.0 | 1130 | $950 | $0.84 | 21d | 1 | 0.44mi |
| 2001 Speigle St Montgomery, AL | 3.0 | 1.0 | 1260 | $1,035 | $0.82 | 43d | 1 | 0.50mi |
| 218 Broadway St Montgomery, AL | 2.0 | 1.0 | 960 | $895 | $0.93 | 13d | 1 | 0.51mi |
| 298 Broadway St Montgomery, AL | 2.0 | 1.0 | 896 | $900 | $1.00 | 43d | 1 | 0.53mi |
| 2503 Skyline Ave Montgomery, AL | 3.0 | 1.0 | 1015 | $1,150 | $1.13 | 43d | 1 | 0.62mi |
| 341 Chisholm St Montgomery, AL | 3.0 | 1.0 | 756 | $1,195 | $1.58 | 21d | 1 | 0.63mi |
| 216 Gardendale Dr Montgomery, AL | 3.0 | 1.0 | 900 | $850 | $0.94 | 21d | 1 | 0.65mi |
| 2006 Harmon St Unit 3 Montgomery, AL | 3.0 | 1.0 | 800 | $500 | $0.62 | 43d | 1 | 0.71mi |
| 1324 Federal Dr Montgomery, AL | 2.0 | 1.0 | 1000 | $1,100 | $1.10 | 43d | 1 | 0.71mi |
| 3613 Erwin Dr Montgomery, AL | 3.0 | 2.0 | 1092 | $1,250 | $1.14 | 43d | 1 | 0.81mi |
| 4029 Chelsea Dr Montgomery, AL | 3.0 | 1.0 | 1000 | $1,200 | $1.20 | 43d | 1 | 0.87mi |
| 207 Destin St Montgomery, AL | 3.0 | 1.0 | 966 | $695 | $0.72 | 21d | 1 | 0.90mi |
| 16 Garden St Montgomery, AL | 3.0 | 1.5 | 1008 | $775 | $0.77 | 44d | 1 | 0.93mi |
| 204 W Park Ave Montgomery, AL | 3.0 | 1.0 | 1145 | $850 | $0.74 | 21d | 1 | 0.95mi |
| 3 Rotary St Montgomery, AL | 3.0 | 1.0 | 1131 | $925 | $0.82 | 21d | 1 | 1.05mi |
| 1024 Grenada Dr Montgomery, AL | 3.0 | 1.0 | 1144 | $1,125 | $0.98 | 43d | 1 | 1.15mi |
| 142 W Michigan Ave Montgomery, AL | 3.0 | 1.0 | 840 | $995 | $1.18 | 13d | 1 | 1.15mi |
| 429 Edward St Montgomery, AL | 3.0 | 1.0 | 828 | $1,080 | $1.30 | 13d | 1 | 1.18mi |
| 412 Edward St Montgomery, AL | 3.0 | 1.0 | 828 | $800 | $0.97 | 43d | 1 | 1.19mi |
| 517 N Florida St Unit B Montgomery, AL | 2.0 | 1.0 | 900 | $750 | $0.83 | 43d | 1 | 1.28mi |
| 740 Coliseum Blvd Unit 740A Montgomery, AL | 2.0 | 1.0 | 1100 | $895 | $0.81 | 13d | 1 | 1.29mi |
| 2023 Windsor Ave Montgomery, AL | 2.0 | 1.0 | 889 | $895 | $1.01 | 43d | 1 | 1.31mi |
| 424 N California St Apt D Montgomery, AL | 2.0 | 1.0 | 850 | $778 | $0.92 | 21d | 1 | 1.34mi |
| 2122 Windsor Ave Montgomery, AL | 2.0 | 1.0 | 1052 | $725 | $0.69 | 43d | 1 | 1.34mi |
| 700 Coliseum Blvd Unit 700D Montgomery, AL | 2.0 | 1.0 | 911 | $895 | $0.98 | 43d | 1 | 1.34mi |
| 508 Glenmore Rd Montgomery, AL | 2.0 | 1.0 | 1135 | $1,000 | $0.88 | 43d | 1 | 1.35mi |
| 2009 Yancey Ave Montgomery, AL | 3.0 | 1.0 | 1140 | $1,080 | $0.95 | 21d | 1 | 1.44mi |
| 108 Calhoun Rd Unit 108B Montgomery, AL | 2.0 | 1.0 | 1350 | $750 | $0.56 | 43d | 1 | 1.49mi |
Listing history 4 events
-
2026-06-18days on market $39,000 Active 3 DOM
-
2026-06-17days on market $39,000 Active 2 DOM
-
2026-06-15remarks 187-char remark
-
2026-06-15$39,000 Active 1 DOM
ⓘ Source: listings_history table (triggers on properties + properties_extension) + one-shot
backfill from property_details.listing_events for pre-trigger history.
Tax reassessment forecast AL · Resets to sale price
- Current annual tax
- $541 · $45/mo
- Projected year-2 tax
- $541 · $45/mo
- Expected delta
- $0/yr ($0/mo · 0.0%)
ⓘ Screening estimate from a state-policy table — verify with the county assessor before closing.
Climate risk First Street
- Flood 1/10 Low FEMA zone X (unshaded) · 0% chance over 30 yrs
- Wildfire 3/10 Moderate
- Heat 7/10 Severe 6 d/yr ≥107°F today · 17 d/yr by 30 yrs out
- Wind 8/10 Severe 80% chance of damaging wind over 30 yrs
- Air quality 3/10 Moderate 4 unhealthy d/yr today · 4 by 30 yrs out
Nearby sold comps map
Loading sold comps map…
Walkable amenities ~0.75 mi
Loading nearby amenities…
Taxation est. · year 1
- Rental income
- $12,692
- − Mortgage interest
- −$2,185
- − Property taxes
- −$541
- − Insurance
- −$195
- − Repairs & maintenance
- −$1,015
- − Management
- −$1,015
- − Depreciation
- −$1,135
- Taxable income
- $6,606
- Est. tax owed @ 24.0%
- −$1,585
- After-tax cash flow
- $5,251/yr
For passive investors: Depreciation is non-cash, so a rental often shows a tax loss while cash-flowing — sheltering income. Rental losses are passive: they offset passive income freely, and up to $25,000/yr can offset ordinary (W-2) income if you actively participate and your MAGI is under $100k (phasing out to $0 by $150k); unused losses carry forward. On sale, claimed depreciation is recaptured at up to 25%, and gains may owe capital-gains tax (a 1031 exchange can defer both). Figures are a year-1 estimate at your 24.0% rate — not tax advice; consult a CPA.
Schools (NCES district)
- District
- Montgomery County
- NCES district ID
- 0102430
- Math proficiency
- 9% ▼ -21.00%
- Reading proficiency
- 31% ▼ -1.00%
- Median HH income
- $43,902
- Composite
- 17.24/100
- National rank
- #9093
- State rank
- #106 of 129 in AL
Livability — Montgomery
- Score
- 65/100
- State rank
- #138
- US rank
- #13416
Category grades
Schools grade is shown separately in the Schools card above.
Census & demographics
- Census place
- Montgomery, AL
- County
- Montgomery County · 190,016 people
- City population
- 175,913
- Metro
- Montgomery, AL
- Population (ZIP)
- 12,102
- Household income
- $47,315
- Rent vs Own
- Severe rent burden
- 753.0
Population outlook (Montgomery County) Hauer SSP2
- Today (2025)
- 224,008 people
- By 2030
- 221,460 · -1.1%
- By 2040
- 214,179 · -4.4%
- By 2050
- 204,912 · -8.5%
- By 2075
- 177,821 · -20.6%
- By 2100
- 145,134 · -35.2%
Race, ethnicity, and origin ACS 2023
- Neighborhood character
- Predominantly Black (83%)
- Race & ethnicity
- Black 83% White 11% Two or more races 3% Asian 2% Hispanic / Latino 1%
- Common ancestry
- Hispanic 1%
- Foreign-born
- 2% · China, Canada
- Languages at home
- 96% English-only · Spanish 2% Other Asian/Pacific 1%
Political lean MEDSL · Montgomery
- 2024 margin
- Solid D (+30.7) · D 64.8% · R 34.1% · Other 1.1%
- 2008→2024 swing
- +11.5pp toward D · 2008: 19.2pp · 2024: 30.7pp
- All cycles
- 2024: D+30.7 2020: D+31.5 2016: D+26.2 2012: D+24.3 2008: D+19.2
Not yet ingested
- Civics
- —
Market trends
- HPI YoY
- ▼ -35.37%
- Current HPI
- 66.3114
- Rent YoY
- —
- Metro
- Montgomery, AL
- State GDP YoY
- ▲ 2.94%
- F500 in state
- 4
Industry mix (Fortune 500 HQ in AL)
| Industry | F500 HQs | Revenue |
|---|---|---|
| Financial Services | 1 | $8B |
|
||
| Healthcare | 1 | $5B |
|
||
Price history
+8.3% since first listed5 events — show timeline
- 2026-06-15 Listed $39,000 MAAR
- 2023-04-12 Contingent — MAAR
- 2023-03-31 Listed $69,000 MAAR
- 2018-11-14 Sold (MLS) $30,000 MAAR
- 2016-10-13 Listed $36,000 MAAR
Property tax history
+10.9%/yrLatest (2025): $541 · +1.5% YoY. Source: county tax records.
Cash-flow waterfall
monthlySold comps — $/sqft
last 12 mo · ≤1 miLoading sold comps…