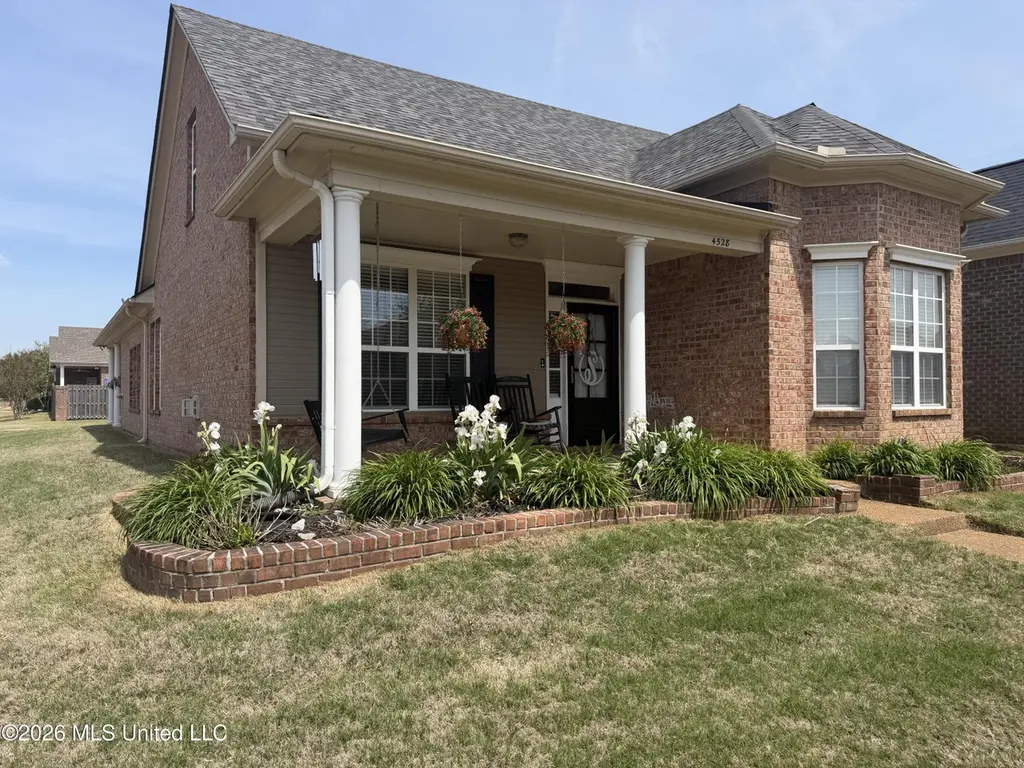
4528 Stone Cross Dr · Olive Branch, MS
Flood risk 1/10 · Minimal
- FEMA flood zone
- X (unshaded)
- Chance of flooding over 30 yrs
- 0.0%
- Est. flood insurance / yr
- $507 – $1,088
Fire risk 3/10 · Minor
- Est. fire insurance / yr
- $1,241 – $2,305
Heat risk 7/10 · Major
- Hot days now (above 109°F)
- 7 days/yr
- Hot days in 30 yrs
- 22 days/yr
Wind risk 4/10 · Minor
- Chance of severe wind over 30 yrs
- 19.0%
Air-quality risk 2/10 · Minimal
- Unhealthy air days now
- 2 days/yr
- Unhealthy air days in 30 yrs
- 2 days/yr
Risk factors via First Street. Map © Google.
Why this score? — see what drove the D grade
The composite is a weighted blend of 9 inputs, each scored 0–100. Each bar is that input's sub-score; the figure is the points it added to the 100-point composite (weight × sub-score).
- Cash flow +11.6/30.0
- ARV discount +11.4/15.0
- Schools +4.0/10.0
- Livability +3.6/5.0
- DSCR +3.4/10.0
- Condition / age +2.5/5.0
- Rent growth +2.4/5.0
- 1% rule +2.3/10.0
- Appreciation +0.0/10.0
$325,000
🖨 Deal sheet (PDF) 📄 Offer letter ✓ Due diligence
Listing remarks MLS
Welcome to Windstone! A subdivision that offers two swimming pools, walking trails, sidewalks, and two lakes. This 3 bedroom, 2 bathroom all one level house has updates and is move in ready, Entering the front porch which welcomes you with a swing and a double wood door. Walking into the entryway you will notice the open concept floor plan of the kitchen, family room, and dining room all with hardwood floors. The large kitchen will please any chef with the counter space, recessed lights, under cabinet lighting, tile backsplash, and stainless steel/black appliances. The family room has a fireplace, built-in bookshelves, crown molding, modern colors and two windows. There are two bedrooms and one bathroom at the front of the house. The split floor plan leads to the primary bedroom towards the rear that has crown molding, two windows, and wood floors. The primary bathroom has a whirlpool tub, walk-in shower dual, vanity and a large walk-in
Key facts
- Two swimming pools
- Sidewalks
- Two lakes
Tags
Neighborhood map
What this means for you Summary
Snapshot
- This is a 3-bed/2.0-bath single-family listed at $325k.
Deal economics
- At list price, monthly cash flow is $-102 ($-1k/yr) — negative.
- To cash-flow at today's rent, offer at most $307k (5.6% below list).
- To meet the 1% rule (rent ≥ 1% of price), the offer needs to be $237k (27.2% below list).
- Recommended offer: $237k (27.2% below list) — sets the bar for 1% rule.
- Cap rate 5.9% vs local median 4.3% in Olive Branch — top-decile yield for the area; either an underpriced asset or a hidden risk that comps aren't pricing in. Stress-test before assuming the spread holds.
Location & tenants
- Location reads 72/100 on livability (#29 in MS) — a middle-class / working-renter tenant base. Strengths: cost of living A+, housing A+, employment A; Watch: amenities F, commute F.
- Desoto County School District (suburban): math 48% / reading 42% proficiency, ranked #20 of 130 in MS (top 15%) — families likely to look elsewhere, expect single-tenant / working-renter base with shorter leases.
- Zoned schools: Pleasant Hill Elementary (math 60% / reading 63%, grade B, #22 of 375 statewide, top 6%, 1,110 students, 100% FRL); Desoto Central Middle School (math 62% / reading 48%, grade B-, #15 of 179 statewide, top 8%, 1,468 students, 100% FRL); Desoto Central High School (math 36% / reading 52%, grade F, #40 of 197 statewide, top 20%, 1,995 students, 100% FRL) — zoned schools average 100% FRL vs 43% district-wide (56 pts higher); higher-poverty schools than district average — tighter screening recommended.
- Market conditions: Rents soft (-0.3%/yr); 575 active listings in the ZIP; 6 comparable units currently listed for rent nearby; rentals lingering (median 46d on market — plan ~5-8 weeks vacancy on turnover, expect pricing pressure); 67% of comp listings sitting > 30 days — soft ceiling on asking rent; solid renter incomes; 1,155 units permitted in DeSoto County in 2024 (0 in 5+ unit buildings).
Forward outlook
- Local home prices are declining (-3.0%/yr); year-one equity from $2k of loan paydown is wiped out by about $10k of value loss. Plan a longer hold.
- DeSoto County population projected at +33% by 2050 — long-run rental-demand tailwind backs the buy-and-hold thesis.
Negotiation context
- It's been on market 72 days — a 6% lower offer ($306k) is reasonable based on typical stale-listing flexibility.
Risks & watch-outs
- Climate carrying-cost: extreme-heat days projected 7→22/yr by 2055 (HVAC capex compounding) — expect insurance premiums to compound above CPI over the hold.
Questions for the listing agent
- What do current leases actually rent for vs. the listed asking? Can we see a recent rent roll and the last 12 months of T-12 income?
- It's been on market 72 days. Have you received any prior offers? Is the seller open to a 27% concession, seller financing, or rate buy-down credit?
- What does the HOA fee cover, when was the last increase, and are there any pending special assessments or reserve-fund shortfalls?
- Why hasn't it sold? Are there any deal-killer items the seller is aware of (foundation, flood, title, zoning, code violations)?
- Is there a deadline driving the sale (1031 exchange, divorce, estate, relocation)? That informs how much negotiation room exists.
- Schools are B-rated — typically a magnet for longer-tenancy family renters. What's the average tenant stay here, and is there a school-zone premium baked into asking?
- The area grade is low — what's the realistic commute time and amenity access for the typical tenant pool here? Any planned neighborhood developments (good or bad) we should know about?
- What's the average days-on-market for RENTAL listings here right now (not sales)? A rising rental-DOM trend means longer vacancies and softer asking-rent achievability than the comps imply.
- What's the recent tenant-quality profile in this submarket — average credit score on applications, eviction rate, late-payment / NSF rate, and stable-employment percentage? A property-management company in the area should have these aggregated.
- How much new for-sale + rental construction is in the pipeline within 1–3 miles? Heavy new supply typically softens prices + rents 12–24 months out; constrained supply supports both.
Investment metrics
- 1% rule
- 0.73% ✗
- Cap rate
- 5.92%
- Cash-on-cash
- -1.35%
- DSCR
- 0.94
- GRM
- 11.4
CMA / ARV
- ARV (median comp)
- $356,112
- List price
- $325,000
- Delta
- -8.74%
- Verdict
- FAIR
- Comps
- 20 within 1.0 mi
Show comp detail 12 sales within ~0.75 mi
| Address | Dist | Beds/Ba | Sqft | Sold | Price | $/sf | Match |
|---|---|---|---|---|---|---|---|
| 4570 Stone Park Blvd | 0.08mi | 3/2.0 | 1,940 (+5%) | 2mo | $324,500 | $167 | 85 |
| 4614 Stone Park Blvd | 0.12mi | 3/2.0 | 1,932 (+5%) | 6mo | $329,900 | $171 | 81 |
| 7278 Stone Ridge Dr | 0.18mi | 3/2.0 | 1,945 (+6%) | 3mo | $299,000 | $154 | 80 |
| 4565 Stone Cross Dr | 0.06mi | 3/2.0 | 1,915 (+4%) | 14mo | $319,900 | $167 | 79 |
| 4501 Stone Cross Dr | 0.04mi | 3/2.0 | 2,086 (+13%) | 5mo | $350,000 | $168 | 72 |
| 4891 Stone Cross Dr | 0.46mi | 3/2.0 | 1,937 (+5%) | 9mo | $329,900 | $170 | 63 |
| 7294 Wind Dr | 0.57mi | 3/2.0 | 2,000 (+9%) | 2mo | $345,000 | $173 | 57 |
| 4690 Stone Cross Dr | 0.20mi | 3/2.5 | 2,100 (+14%) | 13mo | $309,900 | $148 | 55 |
| 4597 Graham Lake Dr | 0.75mi | 3/2.0 | 1,732 (-6%) | 2mo | $299,900 | $173 | 53 |
| 4729 Hillsdale Dr | 0.47mi | 4/2.0 (+1) | 1,984 (+8%) | 10mo | $245,000 | $123 | 52 |
| 7304 Wind Dr | 0.58mi | 3/2.0 | 2,067 (+12%) | 12mo | $375,000 | $181 | 43 |
| 7373 Cedar Hill Cv | 0.70mi | 3/2.0 | 2,004 (+9%) | 14mo | $379,900 | $190 | 41 |
Match score weights: distance 35% · size 25% · config 20% · recency 20%. Top-matched comps best support the ARV.
Projected returns pro-forma
-3.0% appreciation · 0.0% rent growth · sell at horizon
- IRR
- -21.5%
- Equity multiple
- 0.27×
- Total profit
- $-66,237
- Equity at exit
- $48,459
- IRR
- -23.1%
- Equity multiple
- -0.03×
- Total profit
- $-93,389
- Equity at exit
- $28,100
Cash invested: $91,000 (down + closing). Projections, not guarantees.
Landlord ↔ Tenant lean methodology
- Overall (STATE)
- 90 Strongly Landlord-Friendly
- State Mississippi
- 90 Strongly Landlord-Friendly · R+11
- County
- — inherits STATE
- City
- — inherits STATE
ZIP-level market 38654
- Home prices YoY
- -26.1%
- Rents YoY
- -0.3%
- Active inventory
- 575
- Price-to-rent
- 11.4×
Monthly cashflow live
- Estimated rent
- $2,365 high interval (Pro) →
- Mortgage (P&I)
- −$1,704
- Tax from tax record
- −$58 /mo · $698/yr
- Insurance
- −$135
- HOA
- −$73
- Vacancy / Maint / Mgmt
- −$497
- Net cashflow
- $-102
Break-even live
Sensitivity live
| Price | -10% $82 | -5% $-10 | +0% $-102 | +5% $-194 | +10% $-675 |
|---|---|---|---|---|---|
| Rent | -10% $-289 | -5% $-196 | +0% $-102 | +5% $-9 | +10% $85 |
| Rate | -1.0pp $62 | -0.5pp $-20 | base $-102 | +0.5pp $-186 | +1.0pp $-272 |
UW: 25.0% down · 7.5% · 30yr · 1.5% tax · 5.0% vac · 8.0% maint · 8.0% mgmt
Financing live
Cash to close
- Down payment
- $81,250
- Closing costs
- $9,750
- Reserves months
- —
- Total cash needed
- —
Loan-product check · same deal, 3 products live
Conventional
25% down · 7.5% · 30yr
- Down + closing
- —
- Monthly P&I
- —
- Monthly cashflow
- —
- DSCR
- —
- Eligible?
- —
Personal DTI + credit; lowest rate.
DSCR
20% down · 8.5% · 30yr
- Down + closing
- —
- Monthly P&I
- —
- Monthly cashflow
- —
- DSCR
- —
- Eligible?
- —
No personal income docs; deal must DSCR.
Hard money
10% down · 12.0% · 12mo
- Down + closing
- —
- Monthly P&I
- —
- Monthly cashflow
- —
- DSCR
- —
- Eligible?
- —
Short-term bridge; refi at stabilization.
Rent comps 6 comps
| Address | Beds | Baths | Sqft | Rent | $/sqft | DOM | Units | Dist |
|---|---|---|---|---|---|---|---|---|
| 6935 Meadowbrook Ln Olive Branch, MS | 3.0 | 2.0 | 1956 | $2,300 | $1.18 | 45d | 1 | 0.54mi |
| 6150 Morgan Dr Olive Branch, MS | 3.0 | 2.0 | 2000 | $2,130 | $1.06 | 45d | 1 | 1.04mi |
| 4049 Shinault Cv Olive Branch, MS | 4.0 | 2.0 | 2575 | $2,260 | $0.88 | 45d | 1 | 1.35mi |
| 4172 Shinault Ln Olive Branch, MS | 4.0 | 3.0 | 2225 | $2,365 | $1.06 | 45d | 1 | 1.36mi |
| 4172 Shinault Ln Olive Branch, MS | 4.0 | 3.0 | 2225 | $2,365 | $1.06 | 25d | 1 | 1.36mi |
| 4412 Davall Cir Olive Branch, MS | 4.0 | 3.0 | 2413 | $2,395 | $0.99 | 25d | 1 | 1.42mi |
HOA detail
- Monthly dues
- $73 · $876/yr
- Likely covers
- pool
Listing history 16 events
-
2026-06-21days on market $325,000 Active 72 DOM
-
2026-06-18days on market $325,000 Active 69 DOM
-
2026-06-17days on market $325,000 Active 68 DOM
-
2026-06-16days on market $325,000 Active 67 DOM
-
2026-06-15days on market $325,000 Active 66 DOM
-
2026-06-13days on market $325,000 Active 64 DOM
-
2026-06-10days on market $325,000 Active 61 DOM
-
2026-06-09days on market $325,000 Active 60 DOM
-
2026-06-08days on market $325,000 Active 59 DOM
-
2026-06-07days on market $325,000 Active 58 DOM
-
2026-06-03days on market $325,000 Active 54 DOM
-
2026-06-02days on market $325,000 Active 53 DOM
-
2026-06-01days on market $325,000 Active 52 DOM
-
2026-05-31days on market $325,000 Active 51 DOM
-
2026-04-10$325,000 Active 951-char remark
Show marketing remark (951 chars)
Welcome to Windstone! A subdivision that offers two swimming pools, walking trails, sidewalks, and two lakes. This 3 bedroom, 2 bathroom all one level house has updates and is move in ready, Entering the front porch which welcomes you with a swing and a double wood door. Walking into the entryway you will notice the open concept floor plan of the kitchen, family room, and dining room all with hardwood floors. The large kitchen will please any chef with the counter space, recessed lights, under cabinet lighting, tile backsplash, and stainless steel/black appliances. The family room has a fireplace, built-in bookshelves, crown molding, modern colors and two windows. There are two bedrooms and one bathroom at the front of the house. The split floor plan leads to the primary bedroom towards the rear that has crown molding, two windows, and wood floors. The primary bathroom has a whirlpool tub, walk-in shower dual, vanity and a large walk-in
-
2019-06-28soldstatus
ⓘ Source: listings_history table (triggers on properties + properties_extension) + one-shot
backfill from property_details.listing_events for pre-trigger history.
Tax reassessment forecast MS · Resets to sale price
- Current annual tax
- $698 · $58/mo
- Projected year-2 tax
- $2,568 · $214/mo
- Expected delta
- +$1,870/yr (+$156/mo · 268.0%)
ⓘ Screening estimate from a state-policy table — verify with the county assessor before closing.
Climate risk First Street
- Flood 1/10 Low FEMA zone X (unshaded) · 0% chance over 30 yrs
- Wildfire 3/10 Moderate
- Heat 7/10 Severe 7 d/yr ≥109°F today · 22 d/yr by 30 yrs out
- Wind 4/10 Moderate 19% chance of damaging wind over 30 yrs
- Air quality 2/10 Low 2 unhealthy d/yr today · 2 by 30 yrs out
Nearby sold comps map
Loading sold comps map…
Walkable amenities ~0.75 mi
Loading nearby amenities…
Taxation est. · year 1
- Rental income
- $28,386
- − Mortgage interest
- −$18,205
- − Property taxes
- −$698
- − Insurance
- −$1,625
- − Repairs & maintenance
- −$2,271
- − Management
- −$2,271
- − HOA
- −$876
- − Depreciation
- −$9,455
- Taxable loss
- −$7,014
- Est. tax savings @ 24.0%
- +$1,683
- After-tax cash flow
- $457/yr
For passive investors: Depreciation is non-cash, so a rental often shows a tax loss while cash-flowing — sheltering income. Rental losses are passive: they offset passive income freely, and up to $25,000/yr can offset ordinary (W-2) income if you actively participate and your MAGI is under $100k (phasing out to $0 by $150k); unused losses carry forward. On sale, claimed depreciation is recaptured at up to 25%, and gains may owe capital-gains tax (a 1031 exchange can defer both). Figures are a year-1 estimate at your 24.0% rate — not tax advice; consult a CPA.
Schools (NCES district)
- District
- Desoto County School District
- NCES district ID
- 2801320
- Math proficiency
- 48% ▼ -13.00%
- Reading proficiency
- 42% ▼ -6.00%
- Median HH income
- $59,272
- Composite
- 39.56/100
- National rank
- #3933
- State rank
- #20 of 130 in MS
Livability — Olive Branch
- Score
- 72/100
- State rank
- #29
- US rank
- #6509
Category grades
Schools grade is shown separately in the Schools card above.
Census & demographics
- Census place
- Olive Branch, MS
- County
- DeSoto County · 176,513 people
- City population
- 57,898
- Metro
- Memphis, TN-MS-AR
- Population (ZIP)
- 57,898
- Household income
- $103,092
- Rent vs Own
- Severe rent burden
- 801.0
Population outlook (DeSoto County) Hauer SSP2
- Today (2025)
- 203,338 people
- By 2030
- 217,692 · +7.1%
- By 2040
- 245,320 · +20.6%
- By 2050
- 270,133 · +32.8%
- By 2075
- 323,341 · +59.0%
- By 2100
- 348,742 · +71.5%
Race, ethnicity, and origin ACS 2023
- Neighborhood character
- Diverse neighborhood (Simpson 0.57)
- Race & ethnicity
- White 57% Black 32% Hispanic / Latino 5% Two or more races 5% Asian 2%
- Hispanic origin (detail)
- Mexican 4%
- Common ancestry
- Slovak 2% Lithuanian 1% Romanian 1%
- Foreign-born
- 4% · Canada, Vietnam, China
- Languages at home
- 93% English-only · Spanish 4% Vietnamese 1% Arabic 1%
Political lean MEDSL · DeSoto
- 2024 margin
- Strong R (+24.1) · D 36.7% · R 60.8% · Other 2.5%
- 2008→2024 swing
- +14.2pp toward D · 2008: -38.2pp · 2024: -24.1pp
- All cycles
- 2024: R+24.1 2020: R+23.9 2016: R+34.8 2012: R+33.5 2008: R+38.2
Not yet ingested
- Civics
- —
Market trends
- HPI YoY
- ▼ -66.27%
- Current HPI
- 187.2114
- Rent YoY
- ▼ -0.34%
- Metro
- Memphis, TN-MS-AR
- State GDP YoY
- —
- F500 in state
- 0
Price history
2 events — show timeline
- 2026-04-10 Listed $325,000 MLSU
- 2019-06-28 Sold (Public Records) — Public Records
Property tax history
-6.6%/yrLatest (2025): $698 · -15.2% YoY. Source: county tax records.
Cash-flow waterfall
monthlySold comps — $/sqft
last 12 mo · ≤1 miLoading sold comps…