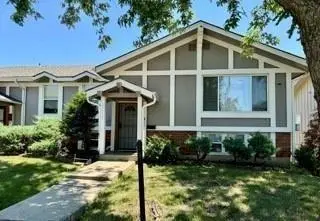
14051 Dunbar Ct · Grandview, MO
Flood risk 1/10 · Minimal
- FEMA flood zone
- X (unshaded)
- Chance of flooding over 30 yrs
- 0.0%
- Est. flood insurance / yr
- $473 – $860
Fire risk 3/10 · Minor
- Est. fire insurance / yr
- $1,054 – $1,958
Heat risk 4/10 · Minor
- Hot days now (above 107°F)
- 7 days/yr
- Hot days in 30 yrs
- 17 days/yr
Wind risk 2/10 · Minimal
- Chance of severe wind over 30 yrs
- —
Air-quality risk 3/10 · Minor
- Unhealthy air days now
- 3 days/yr
- Unhealthy air days in 30 yrs
- 3 days/yr
Risk factors via First Street. Map © Google.
Why this score? — see what drove the C- grade
The composite is a weighted blend of 9 inputs, each scored 0–100. Each bar is that input's sub-score; the figure is the points it added to the 100-point composite (weight × sub-score).
- Cash flow +23.9/30.0
- DSCR +7.7/10.0
- 1% rule +7.4/10.0
- Rent growth +4.0/5.0
- Livability +3.1/5.0
- Condition / age +2.5/5.0
- Schools +2.1/10.0
- ARV discount +0.0/15.0
- Appreciation +0.0/10.0
$147,900
🖨 Deal sheet (PDF) 📄 Offer letter ✓ Due diligence
Listing remarks MLS
Love Living Local - Excellent investment opportunity in Grandnview! Tenant occupied townhouse in boasts a smart floor plan with ample natural light and large family room. Subdivision includes a playground, and basketball courts! HOA adds value covering the cost of water, plus the sewer, trash and recycling, all lawn care, exterior paint & snow removal making it a maintenance-friendly investment, or owner occupant. Close to highway, shopping, restaurants, golf, and parks. Please do not disturb the tenant.
Key facts
- Ample natural light
- Tenant occupied
- Smart floor plan
Tags
Neighborhood map
What this means for you Summary
Snapshot
- This is a 3-bed/2.0-bath townhouse listed at $148k.
Deal economics
- At list price, monthly cash flow is $288 ($3k/yr) — positive.
- The deal already cash-flows at list — no discount required.
- Meets the 1% rule at list price ($2k rent vs $148k).
- Recommended offer: $135k (9.0% below list) — sets the bar for market timing.
- Cap rate 8.6% vs local median 5.0% in Grandview — top-decile yield for the area; either an underpriced asset or a hidden risk that comps aren't pricing in. Stress-test before assuming the spread holds.
Location & tenants
- Location reads 61/100 on livability (#454 in MO) — a middle-class / working-renter tenant base. Strengths: cost of living A+, housing A+; Watch: employment D, crime F, amenities F.
- Grandview C-4 (suburban): math 17% / reading 32% proficiency, ranked #284 of 324 in MO (top 88%) — low school quality limits family demand, transient renter base, plan for 1-2y turnover; 65% free/reduced lunch — lower-income household profile, screen leases tightly.
- Zoned schools: Butcher-Greene Elem. (math 12% / reading 17%, grade F, #993 of 1,115 statewide, top 90%, 283 students, 78% FRL); Grandview Middle (math 18% / reading 39%, grade F, #303 of 391 statewide, top 78%, 517 students, 68% FRL); Grandview Sr. High (math 15% / reading 41%, grade F, #414 of 521 statewide, top 80%, 1,122 students, 62% FRL) — zoned schools at 69% FRL track the district average.
- Market conditions: Rents rising fast (+6.1%/yr); 120 active listings in the ZIP; 18 comparable units currently listed for rent nearby; rentals at typical pace (median 23d on market — plan ~3-4 weeks tenant-placement turnaround); 4,002 units permitted in Jackson County in 2024 (2,271 in 5+ unit buildings).
- This rent runs 41% of the median local income ($53k/yr) — at the standard rent-burdened threshold; future hikes will face affordability resistance.
Forward outlook
- Local home prices are declining (-3.0%/yr); year-one equity from $1k of loan paydown is wiped out by about $4k of value loss. Plan a longer hold.
- Jackson County population projected at +4% by 2050 — modest demand growth; plan on rents tracking national, not racing it.
- At projected returns (-3.0% appreciation + 6.1% rent growth), your $41k cash investment doubles in ~9 years — after that, you're playing with house money.
Negotiation context
- It's been on market 93 days — a 9% lower offer ($135k) is reasonable based on typical stale-listing flexibility.
- 4 sale attempts since 17y ago with the ask held roughly flat each time — persistent listings suggest the price (not the market) is what's stuck; bring a comps-based counter.
Questions for the listing agent
- It's been on market 93 days. Have you received any prior offers? Is the seller open to a 9% concession, seller financing, or rate buy-down credit?
- Built in 1974 — when were the roof, HVAC, electrical panel, plumbing, and water heater last replaced?
- What does the HOA fee cover, when was the last increase, and are there any pending special assessments or reserve-fund shortfalls?
- Why hasn't it sold? Are there any deal-killer items the seller is aware of (foundation, flood, title, zoning, code violations)?
- Is there a deadline driving the sale (1031 exchange, divorce, estate, relocation)? That informs how much negotiation room exists.
- Schools are D-rated, which usually means shorter tenancies and higher turnover. Who's the typical renter profile here, and what's been the actual vacancy rate?
- Crime grade is F in this area — have there been break-ins, vandalism, or insurance claims at this property in the last 3 years? What carrier currently insures it and at what premium?
- What's the average days-on-market for RENTAL listings here right now (not sales)? A rising rental-DOM trend means longer vacancies and softer asking-rent achievability than the comps imply.
- What's the recent tenant-quality profile in this submarket — average credit score on applications, eviction rate, late-payment / NSF rate, and stable-employment percentage? A property-management company in the area should have these aggregated.
- How much new for-sale + rental construction is in the pipeline within 1–3 miles? Heavy new supply typically softens prices + rents 12–24 months out; constrained supply supports both.
Investment metrics
- 1% rule
- 1.24% ✓
- Cap rate
- 8.63%
- Cash-on-cash
- 8.34%
- DSCR
- 1.37
- GRM
- 6.7
CMA / ARV
- ARV (median comp)
- $121,905
- List price
- $147,900
- Delta
- 21.32%
- Verdict
- OVERPRICED
- Comps
- 20 within 1.0 mi
Show comp detail 9 sales within ~0.75 mi
| Address | Dist | Beds/Ba | Sqft | Sold | Price | $/sf | Match |
|---|---|---|---|---|---|---|---|
| 14033 Dornoch St | 0.06mi | 3/2.0 | 1,484 (-3%) | 8mo | $179,900 | $121 | 85 |
| 13917 Falkirk Cir | 0.21mi | 4/2.0 (+1) | 1,559 (+2%) | 1mo | $189,000 | $121 | 82 |
| 13907 Falkirk Cir | 0.19mi | 3/1.5 | 1,615 (+5%) | 2mo | $135,000 | $84 | 79 |
| 13908 Dundee Cir | 0.12mi | 3/2.0 | 1,392 (-9%) | 1mo | $150,000 | $108 | 78 |
| 14045 Dornoch St | 0.10mi | 3/2.0 | 1,384 (-10%) | 4mo | $125,000 | $90 | 76 |
| 14002 Ballantrae Dr | 0.09mi | 3/2.0 | 1,728 (+12%) | 1mo | $97,000 | $56 | 74 |
| 14006 Dunoon St | 0.02mi | 3/2.5 | 1,380 (-10%) | 7mo | $110,000 | $80 | 74 |
| 13910 Dundee Cir | 0.12mi | 3/2.0 | 1,392 (-9%) | 9mo | $170,000 | $122 | 71 |
| 14011 Dunbar Ct | 0.05mi | 3/3.0 | 1,731 (+13%) | 9mo | $139,950 | $81 | 65 |
Match score weights: distance 35% · size 25% · config 20% · recency 20%. Top-matched comps best support the ARV.
Projected returns pro-forma
-3.0% appreciation · 6.1% rent growth · sell at horizon
- IRR
- 0.2%
- Equity multiple
- 1.01×
- Total profit
- $397
- Equity at exit
- $22,052
- IRR
- 13.1%
- Equity multiple
- 2.21×
- Total profit
- $50,291
- Equity at exit
- $12,788
Cash invested: $41,412 (down + closing). Projections, not guarantees.
Landlord ↔ Tenant lean methodology
- Overall (STATE)
- 81 Strongly Landlord-Friendly
- State Missouri
- 81 Strongly Landlord-Friendly · R+10
- County
- — inherits STATE
- City
- — inherits STATE
ZIP-level market 64030
- Home prices YoY
- -30.7%
- Rents YoY
- 6.1%
- Active inventory
- 120
- Price-to-rent
- 6.7×
Monthly cashflow live
- Estimated rent
- $1,839 high interval (Pro) →
- Mortgage (P&I)
- −$776
- Tax from tax record
- −$103 /mo · $1,236/yr
- Insurance
- −$62
- HOA
- −$225
- Vacancy / Maint / Mgmt
- −$386
- Net cashflow
- $288
Break-even live
Sensitivity live
| Price | -10% $372 | -5% $330 | +0% $288 | +5% $246 | +10% $204 |
|---|---|---|---|---|---|
| Rent | -10% $143 | -5% $215 | +0% $288 | +5% $360 | +10% $433 |
| Rate | -1.0pp $362 | -0.5pp $325 | base $288 | +0.5pp $250 | +1.0pp $211 |
UW: 25.0% down · 7.5% · 30yr · 1.5% tax · 5.0% vac · 8.0% maint · 8.0% mgmt
Financing live
Cash to close
- Down payment
- $36,975
- Closing costs
- $4,437
- Reserves months
- —
- Total cash needed
- —
Loan-product check · same deal, 3 products live
Conventional
25% down · 7.5% · 30yr
- Down + closing
- —
- Monthly P&I
- —
- Monthly cashflow
- —
- DSCR
- —
- Eligible?
- —
Personal DTI + credit; lowest rate.
DSCR
20% down · 8.5% · 30yr
- Down + closing
- —
- Monthly P&I
- —
- Monthly cashflow
- —
- DSCR
- —
- Eligible?
- —
No personal income docs; deal must DSCR.
Hard money
10% down · 12.0% · 12mo
- Down + closing
- —
- Monthly P&I
- —
- Monthly cashflow
- —
- DSCR
- —
- Eligible?
- —
Short-term bridge; refi at stabilization.
Rent comps 18 comps
| Address | Beds | Baths | Sqft | Rent | $/sqft | DOM | Units | Dist |
|---|---|---|---|---|---|---|---|---|
| 14011 Dunbar Ct Grandview, MO | 3.0 | 3.0 | 1750 | $1,725 | $0.99 | 6d | 1 | 0.06mi |
| 6501 E 137th St Grandview, MO | 4.0 | 3.0 | 1469 | $2,135 | $1.45 | 45d | 1 | 0.48mi |
| 5940 E 136th St Grandview, MO | 4.0 | 2.0 | 1897 | $1,575 | $0.83 | 25d | 1 | 0.55mi |
| 13915 Grandboro Ln Grandview, MO | 4.0 | 2.5 | 1515 | $1,895 | $1.25 | 4d | 1 | 0.56mi |
| 13915 Grandboro Ln Grandview, MO | 4.0 | 2.5 | 1515 | $1,895 | $1.25 | 3d | 1 | 0.56mi |
| 7002 E 140th Ter Grandview, MO | 3.0 | 2.0 | 2095 | $2,321 | $1.11 | 5d | 1 | 0.62mi |
| 13701 11th Ter Grandview, MO | 4.0 | 2.0 | 1900 | $1,940 | $1.02 | 45d | 1 | 0.64mi |
| 14411 Craig Ave Grandview, MO | 3.0 | 2.5 | 1284 | $1,891 | $1.47 | 25d | 1 | 0.68mi |
| 14412 Wilshire Cir Grandview, MO | 3.0 | 3.0 | 2040 | $2,205 | $1.08 | 14d | 1 | 0.75mi |
| 6003 E 133rd St Grandview, MO | 4.0 | 2.5 | 1560 | $1,990 | $1.28 | 13d | 1 | 0.90mi |
| 14700 Pine View Dr Grandview, MO | 3.0 | 1.5 | 1168 | $1,900 | $1.63 | 45d | 1 | 0.93mi |
| 14719 Bellaire Ave Grandview, MO | 4.0 | 2.0 | 1440 | $1,750 | $1.22 | 45d | 1 | 0.97mi |
| 13206 15th St Grandview, MO | 3.0 | 2.0 | 1204 | $1,735 | $1.44 | 23d | 1 | 1.02mi |
| 13718 Cypress Ave Grandview, MO | 3.0 | 1.0 | 1050 | $1,445 | $1.38 | 9d | 1 | 1.02mi |
| 6505 Yorkshire Ct Grandview, MO | 3.0 | 2.0 | 1697 | $2,090 | $1.23 | 5d | 1 | 1.07mi |
| 6108 E 149th St Grandview, MO | 4.0 | 1.5 | 1200 | $1,465 | $1.22 | 45d | 1 | 1.12mi |
| 6205 E 149th St Grandview, MO | 4.0 | 1.0 | 1200 | $1,495 | $1.25 | 23d | 1 | 1.13mi |
| 7502 E 132nd Ter Grandview, MO | 3.0 | 2.0 | 1754 | $2,135 | $1.22 | 25d | 1 | 1.34mi |
HOA detail
- Monthly dues
- $225 · $2,700/yr
- Likely covers
- watersewertrashlandscapingsnow removal
Listing history 26 events
-
2026-06-21days on market $147,900 Active 93 DOM
-
2026-06-18days on market $147,900 Active 90 DOM
-
2026-06-17days on market $147,900 Active 89 DOM
-
2026-06-16days on market $147,900 Active 88 DOM
-
2026-06-15days on market $147,900 Active 87 DOM
-
2026-06-13days on market $147,900 Active 85 DOM
-
2026-06-13days on market $147,900 Active 84 DOM
-
2026-06-09days on market $147,900 Active 81 DOM
-
2026-06-08days on market $147,900 Active 80 DOM
-
2026-06-07days on market $147,900 Active 79 DOM
-
2026-06-03days on market $147,900 Active 75 DOM
-
2026-06-02days on market $147,900 Active 74 DOM
-
2026-06-01days on market $147,900 Active 73 DOM
-
2026-05-31days on market $147,900 Active 72 DOM
-
2026-03-20$147,900 Active 515-char remark
Show marketing remark (515 chars)
Love Living Local - Excellent investment opportunity in Grandnview! Tenant occupied townhouse in boasts a smart floor plan with ample natural light and large family room. Subdivision includes a playground, and basketball courts! HOA adds value covering the cost of water, plus the sewer, trash and recycling, all lawn care, exterior paint & snow removal making it a maintenance-friendly investment, or owner occupant. Close to highway, shopping, restaurants, golf, and parks. Please do not disturb the tenant.
-
2025-12-31historical
-
2025-09-03price $147,900
-
2025-06-07$149,900 Active
-
2024-12-24historical
-
2024-10-24price $126,900
-
2024-08-05$129,900 Active
-
2010-07-08soldstatus $161,334
-
2009-04-01soldstatus
-
2009-02-18$22,500
-
2004-09-13soldstatus
-
1993-08-23soldstatus
ⓘ Source: listings_history table (triggers on properties + properties_extension) + one-shot
backfill from property_details.listing_events for pre-trigger history.
Tax reassessment forecast MO · Resets to sale price
- Current annual tax
- $1,236 · $103/mo
- Projected year-2 tax
- $1,435 · $120/mo
- Expected delta
- +$198/yr (+$17/mo · 16.0%)
ⓘ Screening estimate from a state-policy table — verify with the county assessor before closing.
Climate risk First Street
- Flood 1/10 Low FEMA zone X (unshaded) · 0% chance over 30 yrs
- Wildfire 3/10 Moderate
- Heat 4/10 Moderate 7 d/yr ≥107°F today · 17 d/yr by 30 yrs out
- Wind 2/10 Low
- Air quality 3/10 Moderate 3 unhealthy d/yr today · 3 by 30 yrs out
Nearby sold comps map
Loading sold comps map…
Walkable amenities ~0.75 mi
Loading nearby amenities…
Taxation est. · year 1
- Rental income
- $22,072
- − Mortgage interest
- −$8,285
- − Property taxes
- −$1,236
- − Insurance
- −$740
- − Repairs & maintenance
- −$1,766
- − Management
- −$1,766
- − HOA
- −$2,700
- − Depreciation
- −$4,303
- Taxable income
- $1,278
- Est. tax owed @ 24.0%
- −$307
- After-tax cash flow
- $3,147/yr
For passive investors: Depreciation is non-cash, so a rental often shows a tax loss while cash-flowing — sheltering income. Rental losses are passive: they offset passive income freely, and up to $25,000/yr can offset ordinary (W-2) income if you actively participate and your MAGI is under $100k (phasing out to $0 by $150k); unused losses carry forward. On sale, claimed depreciation is recaptured at up to 25%, and gains may owe capital-gains tax (a 1031 exchange can defer both). Figures are a year-1 estimate at your 24.0% rate — not tax advice; consult a CPA.
Schools (NCES district)
- District
- Grandview C-4
- NCES district ID
- 2913140
- Math proficiency
- 17% ▼ -12.00%
- Reading proficiency
- 32% ▼ -3.00%
- Median HH income
- $48,934
- Composite
- 21.49/100
- National rank
- #8326
- State rank
- #284 of 324 in MO
Livability — Grandview
- Score
- 61/100
- State rank
- #454
- US rank
- #18350
Category grades
Schools grade is shown separately in the Schools card above.
Census & demographics
- Census place
- Grandview, MO
- County
- Jackson County · 687,798 people
- City population
- 26,422
- Metro
- Kansas City, MO-KS
- Population (ZIP)
- 26,422
- Household income
- $53,216
- Rent vs Own
- Severe rent burden
- 1449.0
Population outlook (Jackson County) Hauer SSP2
- Today (2025)
- 719,589 people
- By 2030
- 731,456 · +1.6%
- By 2040
- 746,689 · +3.8%
- By 2050
- 749,289 · +4.1%
- By 2075
- 736,227 · +2.3%
- By 2100
- 668,210 · -7.1%
Race, ethnicity, and origin ACS 2023
- Neighborhood character
- Diverse neighborhood (Simpson 0.68)
- Race & ethnicity
- White 44% Black 33% Hispanic / Latino 14% Two or more races 7% Asian 3%
- Hispanic origin (detail)
- Mexican 8%
- Common ancestry
- Lithuanian 1% Romanian 1% Slovak 1%
- Foreign-born
- 9% · Canada, South Korea
- Languages at home
- 86% English-only · Spanish 11% Korean 1% Arabic 1%
Political lean MEDSL · Jackson
- 2024 margin
- D (+19.3) · D 58.9% · R 39.5% · Other 1.6%
- 2008→2024 swing
- -6.1pp toward R · 2008: 25.4pp · 2024: 19.3pp
- All cycles
- 2024: D+19.3 2020: D+22.0 2016: D+16.6 2012: D+19.0 2008: D+25.4
Not yet ingested
- Civics
- —
Market trends
- HPI YoY
- ▼ -142.24%
- Current HPI
- 321.6905
- Rent YoY
- ▲ 6.10%
- Metro
- Kansas City, MO-KS
- State GDP YoY
- ▲ 1.84%
- F500 in state
- 20
Industry mix (Fortune 500 HQ in MO)
| Industry | F500 HQs | Revenue |
|---|---|---|
| Healthcare | 1 | $163B |
|
||
| Insurance | 1 | $21B |
|
||
| Industrial Technology | 1 | $17B |
|
||
| Retail | 1 | $16B |
|
||
| Industrial Distribution | 1 | $10B |
|
||
| Utilities | 1 | $9B |
|
||
Price history
+557.3% since first listed12 events — show timeline
- 2026-03-20 Listed $147,900 Heartland MLS as Distributed by MLS Grid
- 2025-12-31 Listing Removed — Heartland MLS as Distributed by MLS Grid
- 2025-09-03 Price Changed $147,900 Heartland MLS as Distributed by MLS Grid
- 2025-06-07 Listed $149,900 Heartland MLS as Distributed by MLS Grid
- 2024-12-24 Listing Removed — Heartland MLS as Distributed by MLS Grid
- 2024-10-24 Price Changed $126,900 Heartland MLS as Distributed by MLS Grid
- 2024-08-05 Listed $129,900 Heartland MLS as Distributed by MLS Grid
- 2010-07-08 Sold (Public Records) $161,334 Public Records
- 2009-04-01 Sold (MLS) — Heartland MLS as Distributed by MLS Grid
- 2009-02-18 Listed $22,500 Heartland MLS as Distributed by MLS Grid
- 2004-09-13 Sold (Public Records) — Public Records
- 1993-08-23 Sold (Public Records) — Public Records
Property tax history
+10.2%/yrLatest (2025): $1,236 · -29.7% YoY. Source: county tax records.
Cash-flow waterfall
monthlySold comps — $/sqft
last 12 mo · ≤1 miLoading sold comps…