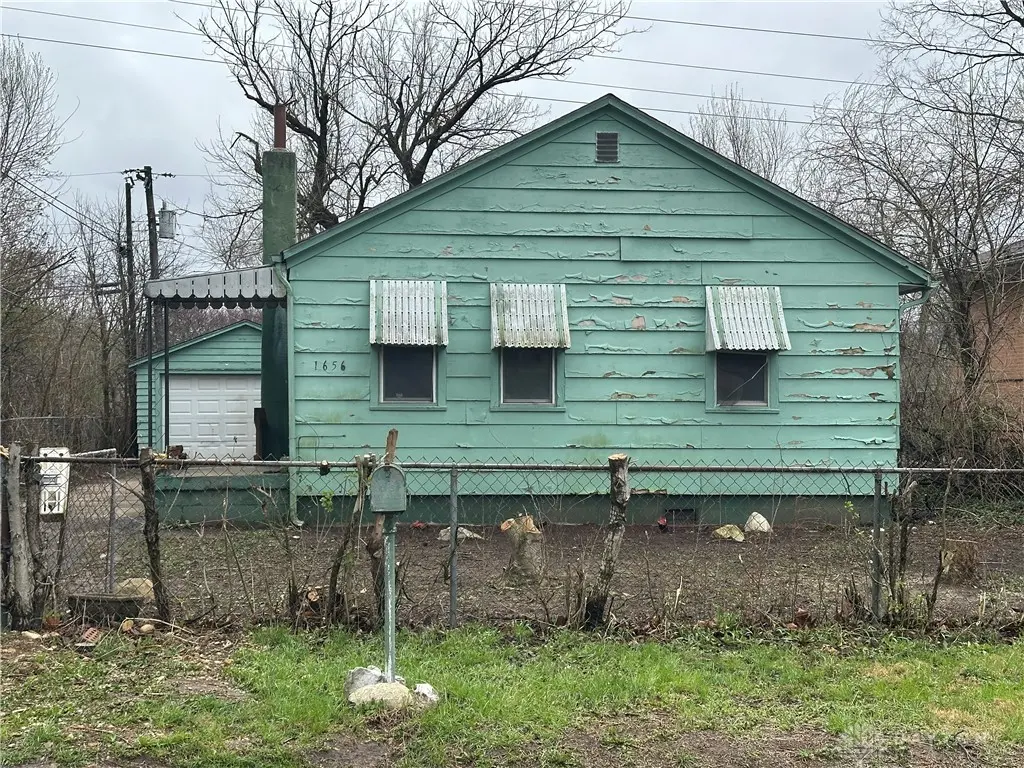
1656 Dewitt Dr · Dayton, OH
Flood risk 4/10 · Minor
- FEMA flood zone
- X (unshaded)
- Chance of flooding over 30 yrs
- 0.21%
- Est. flood insurance / yr
- $507 – $1,088
Fire risk 1/10 · Minimal
- Est. fire insurance / yr
- $713 – $1,323
Heat risk 3/10 · Minor
- Hot days now (above 103°F)
- 7 days/yr
- Hot days in 30 yrs
- 19 days/yr
Wind risk 2/10 · Minimal
- Chance of severe wind over 30 yrs
- 0.0%
Air-quality risk 3/10 · Minor
- Unhealthy air days now
- 3 days/yr
- Unhealthy air days in 30 yrs
- 4 days/yr
Risk factors via First Street. Map © Google.
Why this score? — see what drove the B- grade
The composite is a weighted blend of 9 inputs, each scored 0–100. Each bar is that input's sub-score; the figure is the points it added to the 100-point composite (weight × sub-score).
- Cash flow +30.0/30.0
- 1% rule +10.0/10.0
- DSCR +10.0/10.0
- ARV discount +7.5/15.0
- Rent growth +3.3/5.0
- Livability +3.2/5.0
- Condition / age +2.5/5.0
- Schools +1.3/10.0
- Appreciation +0.0/10.0
$32,000
🖨 Deal sheet 📄 Offer letter ✓ Due diligence
Listing remarks MLS
Handyman/Rehabber special. Would make a great rental or put a little more $ into it to make it owner occupied. Selling As-is. Hurry this one will go fast. Room sizes are approximate. No sign in the yard. Owner/Agent
Key facts
- 6,050 sq ft lot
- Garage
- Built 1950
Neighborhood map
What this means for you Summary
Snapshot
- This is a 3-bed/1.0-bath single-family listed at $32k.
Deal economics
- At list price, monthly cash flow is $630 ($8k/yr) — positive.
- The deal already cash-flows at list — no discount required.
- Meets the 1% rule at list price ($1k rent vs $32k).
- Recommended offer: $30k (6.0% below list) — sets the bar for market timing.
- Cap rate 29.9% vs local median 7.4% in Dayton — top-decile yield for the area; either an underpriced asset or a hidden risk that comps aren't pricing in. Stress-test before assuming the spread holds.
Location & tenants
- Location reads 65/100 on livability (#716 in OH) — a middle-class / working-renter tenant base. Strengths: cost of living A+, housing A+, health & safety A; Watch: schools C-, amenities C-, crime F.
- Dayton City (urban): math 12% / reading 21% proficiency, ranked #641 of 656 in OH (top 98%) — low school quality limits family demand, transient renter base, plan for 1-2y turnover; 74% free/reduced lunch — lower-income household profile, screen leases tightly.
- Market conditions: Rents rising (+3.0%/yr); 156 active listings in the ZIP; 24 comparable units currently listed for rent nearby; rentals at typical pace (median 21d on market — plan ~3-4 weeks tenant-placement turnaround); lower-income renter base — watch delinquency; 907 units permitted in Montgomery County in 2024 (416 in 5+ unit buildings).
- This rent runs 33% of the median local income ($42k/yr) — at the standard rent-burdened threshold; future hikes will face affordability resistance.
Forward outlook
- Local home prices are declining (-3.0%/yr); year-one equity from $221 of loan paydown is wiped out by about $960 of value loss. Plan a longer hold.
- Montgomery County population projected at -10% by 2050 — secular population decline; favor cash flow + early exit over multi-decade hold.
- At projected returns (-3.0% appreciation + 3.0% rent growth), your $9k cash investment doubles in ~2 years — after that, you're playing with house money.
Negotiation context
- It's been on market 81 days — a 6% lower offer ($30k) is reasonable based on typical stale-listing flexibility.
- 2 sale attempts; this cycle's ask has dropped $7k (18%) from the opening price — seller is motivated, your offer sets the floor, not the list.
- Current owner paid $15k; list at $32k implies a 106% gain — meaningful room to come down on a strong offer.
Risks & watch-outs
- Watch-outs: property tax is 3.3% of price; built in 1950 — expect roof / HVAC / electrical / plumbing capex.
Questions for the listing agent
- It's been on market 81 days. Have you received any prior offers? Is the seller open to a 6% concession, seller financing, or rate buy-down credit?
- Built in 1950 — when were the roof, HVAC, electrical panel, plumbing, and water heater last replaced?
- Property tax is high relative to price — has the assessment been appealed recently, and will the sale trigger a re-assessment?
- Why hasn't it sold? Are there any deal-killer items the seller is aware of (foundation, flood, title, zoning, code violations)?
- Is there a deadline driving the sale (1031 exchange, divorce, estate, relocation)? That informs how much negotiation room exists.
- Crime grade is F in this area — have there been break-ins, vandalism, or insurance claims at this property in the last 3 years? What carrier currently insures it and at what premium?
- What's the average days-on-market for RENTAL listings here right now (not sales)? A rising rental-DOM trend means longer vacancies and softer asking-rent achievability than the comps imply.
- What's the recent tenant-quality profile in this submarket — average credit score on applications, eviction rate, late-payment / NSF rate, and stable-employment percentage? A property-management company in the area should have these aggregated.
- How much new for-sale + rental construction is in the pipeline within 1–3 miles? Heavy new supply typically softens prices + rents 12–24 months out; constrained supply supports both.
Investment metrics
- 1% rule
- 3.56% ✓
- Cap rate
- 29.91%
- Cash-on-cash
- 84.35%
- DSCR
- 4.75
- GRM
- 2.3
CMA / ARV
- ARV (median comp)
- $65,392
- List price
- $32,000
- Delta
- -51.06%
- Verdict
- UNDERPRICED
- Comps
- 20 within 1.0 mi
Show comp detail 12 sales within ~0.75 mi
| Address | Dist | Beds/Ba | Sqft | Sold | Price | $/sf | Match |
|---|---|---|---|---|---|---|---|
| 4610 Blueberry Ave | 0.18mi | 3/1.5 | 1,296 (+2%) | 1mo | $110,000 | $85 | 85 |
| 4500 Bluehaven Dr | 0.26mi | 3/1.5 | 1,296 (+2%) | 12mo | $145,000 | $112 | 72 |
| 4637 Blueberry Ave | 0.14mi | 3/2.0 | 1,134 (-10%) | 8mo | $50,000 | $44 | 66 |
| 4936 Blueberry Ave | 0.11mi | 3/1.0 | 1,152 (-9%) | 17mo | $17,500 | $15 | 66 |
| 5130 Eichelberger Ave | 0.42mi | 3/1.5 | 1,120 (-11%) | 3mo | $51,000 | $46 | 56 |
| 4722 Hollister Ave | 0.30mi | 3/1.0 | 1,096 (-13%) | 9mo | $206,000 | $188 | 56 |
| 4845 Little Richmond Rd | 0.48mi | 3/1.5 | 1,134 (-10%) | 9mo | $100,000 | $88 | 51 |
| 4968 Little Richmond Rd | 0.61mi | 4/2.0 (+1) | 1,318 (+4%) | 8mo | $194,900 | $148 | 49 |
| 4643 Saint Johns Ave | 0.63mi | 3/1.0 | 1,363 (+8%) | 11mo | $51,750 | $38 | 48 |
| 4919 W Hillcrest Ave | 0.68mi | 3/1.5 | 1,296 (+2%) | 20mo | $130,000 | $100 | 45 |
| 1579 Sundale Ave | 0.71mi | 3/1.5 | 1,109 (-12%) | 7mo | $48,000 | $43 | 38 |
| 4076 Prescott Ave | 0.73mi | 4/1.0 (+1) | 1,129 (-11%) | 6mo | $65,000 | $58 | 38 |
Match score weights: distance 35% · size 25% · config 20% · recency 20%. Top-matched comps best support the ARV.
Projected returns pro-forma
-3.0% appreciation · 3.03% rent growth · sell at horizon
- IRR
- 84.8%
- Equity multiple
- 4.91×
- Total profit
- $35,009
- Equity at exit
- $4,771
- IRR
- 88.0%
- Equity multiple
- 10.20×
- Total profit
- $82,469
- Equity at exit
- $2,767
Cash invested: $8,960 (down + closing). Projections, not guarantees.
Landlord ↔ Tenant lean methodology
- Overall (STATE)
- 73 Landlord-Friendly
- State Ohio
- 73 Landlord-Friendly · R+6
- County
- — inherits STATE
- City
- — inherits STATE
ZIP-level market 45406
- Rents YoY
- 3.0%
- Active inventory
- 156
- Price-to-rent
- 2.3×
Monthly cashflow live
- Estimated rent
- $1,139 high interval (Pro) →
- Mortgage (P&I)
- −$168
- Tax from tax record
- −$89 /mo · $1,067/yr
- Insurance
- −$13
- HOA
- −$0
- Vacancy / Maint / Mgmt
- −$239
- Net cashflow
- $630
Break-even live
UW: 25.0% down · 7.5% · 30yr · 1.5% tax · 5.0% vac · 8.0% maint · 8.0% mgmt
Financing live
Cash to close
- Down payment
- $8,000
- Closing costs
- $960
- Reserves months
- —
- Total cash needed
- —
Loan-product check · same deal, 3 products live
Conventional
25% down · 7.5% · 30yr
- Down + closing
- —
- Monthly P&I
- —
- Monthly cashflow
- —
- DSCR
- —
- Eligible?
- —
Personal DTI + credit; lowest rate.
DSCR
20% down · 8.5% · 30yr
- Down + closing
- —
- Monthly P&I
- —
- Monthly cashflow
- —
- DSCR
- —
- Eligible?
- —
No personal income docs; deal must DSCR.
Hard money
10% down · 12.0% · 12mo
- Down + closing
- —
- Monthly P&I
- —
- Monthly cashflow
- —
- DSCR
- —
- Eligible?
- —
Short-term bridge; refi at stabilization.
Rent comps 24 comps
| Address | Beds | Baths | Sqft | Rent | $/sqft | DOM | Units | Dist |
|---|---|---|---|---|---|---|---|---|
| 4629 Queens Ave Dayton, OH | 2.0 | 1.0 | 900 | $1,100 | $1.22 | 43d | 1 | 0.26mi |
| 2002 Val Vista Ct Dayton, OH | 3.0 | 1.0 | 975 | $1,095 | $1.12 | 21d | 1 | 0.42mi |
| 4446 Waymire Ave Dayton, OH | 3.0 | 1.0 | 1100 | $1,100 | $1.00 | 21d | 1 | 0.55mi |
| 5112 W Hillcrest Ave Unit 1 Dayton, OH | 3.0 | 1.0 | 972 | $700 | $0.72 | 23d | 1 | 0.67mi |
| 3650 Otterbein Ave Unit 3650 Dayton, OH | 2.0 | 1.0 | 900 | $800 | $0.89 | 2d | 1 | 0.88mi |
| 4916 Copeland Ave Dayton, OH | 3.0 | 1.5 | 1515 | $1,125 | $0.74 | 11d | 1 | 0.90mi |
| 3672 Karwin Dr Unit 3672 Dayton, OH | 2.0 | 1.0 | 1500 | $995 | $0.66 | 43d | 1 | 0.92mi |
| 3668 Karwin Dr Unit 3672 Dayton, OH | 2.0 | 1.0 | 1500 | $995 | $0.66 | 23d | 1 | 0.93mi |
| 1720 Kings Mill Ct Dayton, OH | 2.0 | 1.5 | 975 | $925 | $0.95 | 23d | 1 | 0.93mi |
| 3537 Otterbein Ave Unit d Dayton, OH | 2.0 | 1.0 | 900 | $925 | $1.03 | 43d | 1 | 0.96mi |
| 4914 Gardendale Ave Dayton, OH | 4.0 | 1.0 | 960 | $1,125 | $1.17 | 43d | 1 | 1.10mi |
| 3311 Otterbein Ave Dayton, OH | 3.0 | 1.5 | 1004 | $1,300 | $1.29 | 11d | 1 | 1.12mi |
| 1427 Stuben Dr Dayton, OH | 3.0 | 1.0 | 957 | $900 | $0.94 | 2d | 1 | 1.13mi |
| 2609 Fairport Ave Dayton, OH | 3.0 | 1.0 | 1000 | $1,025 | $1.02 | 2d | 1 | 1.16mi |
| 3207 Cornell Dr Dayton, OH | 3.0 | 1.0 | 1168 | $1,000 | $0.86 | 3d | 1 | 1.21mi |
| 3220 Princeton Dr Dayton, OH | 3.0 | 1.0 | 900 | $1,000 | $1.11 | 43d | 1 | 1.30mi |
| 1816 N James H McGee Blvd Unit C Dayton, OH | 3.0 | 1.0 | 950 | $1,150 | $1.21 | 2d | 1 | 1.31mi |
| 1816 N James H McGee Blvd Apt B Dayton, OH | 3.0 | 1.0 | 950 | $1,150 | $1.21 | 43d | 1 | 1.31mi |
| 1816 N James H McGee Blvd Apt A Dayton, OH | 3.0 | 1.0 | 950 | $1,200 | $1.26 | 2d | 1 | 1.31mi |
| 4246 Redonda Ln Dayton, OH | 3.0 | 1.0 | 1600 | $1,495 | $0.93 | 43d | 1 | 1.33mi |
| 3668 Castano Dr Dayton, OH | 3.0 | 2.0 | 1608 | $1,600 | $1.00 | 2d | 1 | 1.44mi |
| 3925 Hoover Ave Dayton, OH | 2.0 | 1.0 | 936 | $1,100 | $1.18 | 2d | 1 | 1.48mi |
| 863 N Upland Ave Dayton, OH | 3.0 | 1.0 | 1042 | $1,200 | $1.15 | 43d | 1 | 1.48mi |
| 920 Huron Ave Dayton, OH | 2.0 | 1.0 | 950 | $995 | $1.05 | 3d | 1 | 1.50mi |
Listing history 21 events
-
2026-06-18price $32,000 Active 81 DOM
-
2026-06-18days on market $35,000 Active 81 DOM
-
2026-06-17days on market $35,000 Active 80 DOM
-
2026-06-16days on market $35,000 Active 79 DOM
-
2026-06-15days on market $35,000 Active 78 DOM
-
2026-06-14days on market $35,000 Active 76 DOM
-
2026-06-13days on market $35,000 Active 75 DOM
-
2026-06-10days on market $35,000 Active 73 DOM
-
2026-06-09days on market $35,000 Active 72 DOM
-
2026-06-08days on market $35,000 Active 71 DOM
-
2026-06-07days on market $35,000 Active 70 DOM
-
2026-06-05days on market $35,000 Active 67 DOM
-
2026-06-03days on market $35,000 Active 66 DOM
-
2026-06-02days on market $35,000 Active 65 DOM
-
2026-06-01days on market $35,000 Active 64 DOM
-
2026-05-31days on market $35,000 Active 63 DOM
-
2026-05-13price $35,000 215-char remark
Show marketing remark (215 chars)
Handyman/Rehabber special. Would make a great rental or put a little more $ into it to make it owner occupied. Selling As-is. Hurry this one will go fast. Room sizes are approximate. No sign in the yard. Owner/Agent
-
2026-03-27$39,000 Active 215-char remark
Show marketing remark (215 chars)
Handyman/Rehabber special. Would make a great rental or put a little more $ into it to make it owner occupied. Selling As-is. Hurry this one will go fast. Room sizes are approximate. No sign in the yard. Owner/Agent
-
2026-02-11soldstatus $15,499 Sold 361-char remark
Show marketing remark (361 chars)
Court Ordered Sale by Private Selling Officer. All information we have on the property is included. We have no additional information, property condition is unknown. NO SHOWINGS, NO trespassing for any reason. Information is thought to be correct but not guaranteed. 10% Buyer Premium added to the high bid, $5,000 deposit is due within 24 hours of bidding end.
-
2025-12-09historical Contingency Pending 361-char remark
Show marketing remark (361 chars)
Court Ordered Sale by Private Selling Officer. All information we have on the property is included. We have no additional information, property condition is unknown. NO SHOWINGS, NO trespassing for any reason. Information is thought to be correct but not guaranteed. 10% Buyer Premium added to the high bid, $5,000 deposit is due within 24 hours of bidding end.
-
2025-12-01$1 Active 361-char remark
Show marketing remark (361 chars)
Court Ordered Sale by Private Selling Officer. All information we have on the property is included. We have no additional information, property condition is unknown. NO SHOWINGS, NO trespassing for any reason. Information is thought to be correct but not guaranteed. 10% Buyer Premium added to the high bid, $5,000 deposit is due within 24 hours of bidding end.
ⓘ Source: listings_history table (triggers on properties + properties_extension) + one-shot
backfill from property_details.listing_events for pre-trigger history.
Tax reassessment forecast OH · Partial reset (capped growth)
- Current annual tax
- $1,067 · $89/mo
- Projected year-2 tax
- $1,067 · $89/mo
- Expected delta
- $0/yr ($0/mo · 0.0%)
ⓘ Screening estimate from a state-policy table — verify with the county assessor before closing.
Climate risk First Street
- Flood 4/10 Moderate FEMA zone X (unshaded) · 21% chance over 30 yrs
- Wildfire 1/10 Low
- Heat 3/10 Moderate 7 d/yr ≥103°F today · 19 d/yr by 30 yrs out
- Wind 2/10 Low 0% chance of damaging wind over 30 yrs
- Air quality 3/10 Moderate 3 unhealthy d/yr today · 4 by 30 yrs out
Nearby sold comps map
Loading sold comps map…
Walkable amenities ~0.75 mi
Loading nearby amenities…
Taxation est. · year 1
- Rental income
- $13,669
- − Mortgage interest
- −$1,792
- − Property taxes
- −$1,067
- − Insurance
- −$160
- − Repairs & maintenance
- −$1,094
- − Management
- −$1,094
- − Depreciation
- −$931
- Taxable income
- $7,531
- Est. tax owed @ 24.0%
- −$1,808
- After-tax cash flow
- $5,750/yr
For passive investors: Depreciation is non-cash, so a rental often shows a tax loss while cash-flowing — sheltering income. Rental losses are passive: they offset passive income freely, and up to $25,000/yr can offset ordinary (W-2) income if you actively participate and your MAGI is under $100k (phasing out to $0 by $150k); unused losses carry forward. On sale, claimed depreciation is recaptured at up to 25%, and gains may owe capital-gains tax (a 1031 exchange can defer both). Figures are a year-1 estimate at your 24.0% rate — not tax advice; consult a CPA.
Schools (NCES district)
- District
- Dayton City
- NCES district ID
- 3904384
- Math proficiency
- 12% ▼ -12.00%
- Reading proficiency
- 21% ▼ -11.00%
- Median HH income
- $28,688
- Composite
- 12.94/100
- National rank
- #9579
- State rank
- #641 of 656 in OH
Livability — Dayton
- Score
- 65/100
- State rank
- #716
- US rank
- #12895
Category grades
Schools grade is shown separately in the Schools card above.
Census & demographics
- Census place
- Dayton, OH
- County
- Montgomery County · 459,541 people
- City population
- 164,387
- Metro
- Dayton-Kettering, OH
- Population (ZIP)
- 19,991
- Household income
- $41,796
- Rent vs Own
- Severe rent burden
- 1504.0
Population outlook (Montgomery County) Hauer SSP2
- Today (2025)
- 523,241 people
- By 2030
- 514,948 · -1.6%
- By 2040
- 493,378 · -5.7%
- By 2050
- 469,639 · -10.2%
- By 2075
- 418,360 · -20.0%
- By 2100
- 353,315 · -32.5%
Race, ethnicity, and origin ACS 2023
- Neighborhood character
- Predominantly Black (75%)
- Race & ethnicity
- Black 75% White 16% Two or more races 7% Hispanic / Latino 3%
- Common ancestry
- Italian 2% Lithuanian 1% Slovak 1%
- Foreign-born
- 2% · Canada
- Languages at home
- 97% English-only · Spanish 1%
Political lean MEDSL · Montgomery
- 2024 margin
- Toss-up / Even · D 49.8% · R 49.3%
- 2008→2024 swing
- -5.8pp toward R · 2008: 6.2pp · 2024: 0.5pp
- All cycles
- 2024: D+0.5 2020: D+2.2 2016: R+1.2 2012: D+3.1 2008: D+6.2
Not yet ingested
- Civics
- —
Market trends
- HPI YoY
- ▼ -113.75%
- Current HPI
- 197.1302
- Rent YoY
- ▲ 3.03%
- Metro
- Dayton-Kettering, OH
- State GDP YoY
- ▲ 1.98%
- F500 in state
- 48
Industry mix (Fortune 500 HQ in OH)
| Industry | F500 HQs | Revenue |
|---|---|---|
| Insurance | 3 | $145B |
|
||
| Industrial Machinery | 3 | $49B |
|
||
| Financial Services | 3 | $24B |
|
||
| Consumer Goods | 2 | $93B |
|
||
| Aerospace / Defense | 2 | $47B |
|
||
| Utilities | 2 | $33B |
|
||
Price history
+125.8% since first listed5 events — show timeline
- 2026-05-13 Price Changed $35,000 Dayton MLS
- 2026-03-27 Listed $39,000 Dayton MLS
- 2026-02-11 Sold (MLS) $15,499 Cincy MLS
- 2025-12-09 Contingent — Cincy MLS
- 2025-12-01 Listed $1 Cincy MLS
Property tax history
+1.1%/yrLatest (2025): $1,067 · -21.6% YoY. Source: county tax records.
Cash-flow waterfall
monthlySold comps — $/sqft
last 12 mo · ≤1 miLoading sold comps…