2558 Farnell Dr · Mobile, AL
Flood risk 1/10 · Minimal
- FEMA flood zone
- X (unshaded)
- Chance of flooding over 30 yrs
- 0.0%
- Est. flood insurance / yr
- $507 – $1,088
Fire risk 2/10 · Minimal
- Est. fire insurance / yr
- $916 – $1,700
Heat risk 9/10 · Severe
- Hot days now (above 105°F)
- 6 days/yr
- Hot days in 30 yrs
- 18 days/yr
Wind risk 9/10 · Severe
- Chance of severe wind over 30 yrs
- 99.0%
Air-quality risk 2/10 · Minimal
- Unhealthy air days now
- 1 days/yr
- Unhealthy air days in 30 yrs
- 1 days/yr
Risk factors via First Street. Map © Google.
Why this score? — see what drove the B- grade
The composite is a weighted blend of 9 inputs, each scored 0–100. Each bar is that input's sub-score; the figure is the points it added to the 100-point composite (weight × sub-score).
- Cash flow +30.0/30.0
- 1% rule +10.0/10.0
- DSCR +10.0/10.0
- ARV discount +7.5/15.0
- Rent growth +4.6/5.0
- Livability +3.8/5.0
- Schools +2.3/10.0
- Condition / age +1.0/5.0
- Appreciation +0.0/10.0
$30,000
🖨 Deal sheet 📄 Offer letter ✓ Due diligence
Listing remarks
Flip opportunity in Mobile! This 2-bedroom, 1-bath home offers approximately 1,068 square feet of potential and is ready for your vision. 2558 Farnell Dr presents a great flip opportunity with solid bones and plenty of upside for the right buyer. Whether you're looking to renovate and resell or add to your rental portfolio, this property is priced to move and full of possibilities. Bring your contractor and imagination—don’t miss this chance to unlock its value!Buyer to verify all information during due diligence. This is an equitable interest listing where seller is selling only an option contract or assigning an interest in a contract, such as a purchase and sale agreement or
Key facts
- 0.26 acre lot
- Built 1979
- Listed 8 days
Property features AI
Finance
- HOA & community: No transfer fees; No community amenities
Exterior
- Parking: Attached parking
- Utilities: Electric service: Alabama Power
- Home design: One story; Resale property
- Construction: Built with asbestos and wood siding; Slab foundation; Composition roof; Building area reported by seller (1,068 square feet)
- Exterior features: Less than 1 acre lot; No waterfront; Whole/Full ownership
Interior
- Flooring: Other flooring (see remarks)
- Bathrooms: 1 full bathroom
- Heating & cooling: Has heating; Electric service provided by Alabama Power
- Interior features: No fireplace; Other flooring (see remarks)
Neighborhood map
What this means for you Summary
Snapshot
- This is a 2-bed/1.0-bath single-family listed at $30k. Condition is rated poor.
Deal economics
- At list price, monthly cash flow is $637 ($8k/yr) — positive.
- The deal already cash-flows at list — no discount required.
- Meets the 1% rule at list price ($1k rent vs $30k).
- Cap rate 31.8% vs local median 4.9% in Mobile — top-decile yield for the area; either an underpriced asset or a hidden risk that comps aren't pricing in. Stress-test before assuming the spread holds.
Location & tenants
- Location reads 75/100 on livability (#20 in AL, #4,262 nationally) — a middle-class / working-renter tenant base. Strengths: commute A+, cost of living A+, housing A+; Watch: schools D-, crime F, employment D-.
- Mobile County (urban): math 15% / reading 39% proficiency, ranked #81 of 129 in AL (top 63%) — low school quality limits family demand, transient renter base, plan for 1-2y turnover; 67% free/reduced lunch — lower-income household profile, screen leases tightly.
- Market conditions: Rents rising fast (+8.3%/yr); 139 active listings in the ZIP; 16 comparable units currently listed for rent nearby; rentals lingering (median 44d on market — plan ~5-8 weeks vacancy on turnover, expect pricing pressure); 62% of comp listings sitting > 30 days — soft ceiling on asking rent; lower-income renter base — watch delinquency; 1,678 units permitted in Mobile County in 2024 (264 in 5+ unit buildings).
Forward outlook
- Local home prices are declining (-3.0%/yr); year-one equity from $207 of loan paydown is wiped out by about $900 of value loss. Plan a longer hold.
- Mobile County population projected to shrink 8% by 2050 — rents likely to lag national; underwrite the cash flow, not the appreciation.
- At projected returns (-3.0% appreciation + 8.0% rent growth), your $8k cash investment doubles in ~2 years — after that, you're playing with house money.
Negotiation context
- Only 8 days on market — expect competitive offers; lowballing is unlikely to land.
Risks & watch-outs
- Climate carrying-cost: severe wind risk, 99% chance of damaging wind over 30y; extreme-heat days projected 6→18/yr by 2055 (HVAC capex compounding) — expect insurance premiums to compound above CPI over the hold.
Questions for the listing agent
- Have any recent inspections been done? Can we get a copy of the seller's disclosures and any deferred-maintenance estimates?
- Built in 1979 — when were the roof, HVAC, electrical panel, plumbing, and water heater last replaced?
- Is there a deadline driving the sale (1031 exchange, divorce, estate, relocation)? That informs how much negotiation room exists.
- Schools are D-rated, which usually means shorter tenancies and higher turnover. Who's the typical renter profile here, and what's been the actual vacancy rate?
- Crime grade is F in this area — have there been break-ins, vandalism, or insurance claims at this property in the last 3 years? What carrier currently insures it and at what premium?
- What's the average days-on-market for RENTAL listings here right now (not sales)? A rising rental-DOM trend means longer vacancies and softer asking-rent achievability than the comps imply.
- What's the recent tenant-quality profile in this submarket — average credit score on applications, eviction rate, late-payment / NSF rate, and stable-employment percentage? A property-management company in the area should have these aggregated.
- How much new for-sale + rental construction is in the pipeline within 1–3 miles? Heavy new supply typically softens prices + rents 12–24 months out; constrained supply supports both.
Investment metrics
- 1% rule
- 3.56% ✓
- Cap rate
- 31.77%
- Cash-on-cash
- 90.99%
- DSCR
- 5.05
- GRM
- 2.3
CMA / ARV
- ARV (median comp)
- $83,190
- List price
- $30,000
- Delta
- -63.94%
- Verdict
- UNDERPRICED
- Comps
- 20 within 1.0 mi
Show comp detail 12 sales within ~0.75 mi
| Address | Dist | Beds/Ba | Sqft | Sold | Price | $/sf | Match |
|---|---|---|---|---|---|---|---|
| 1614 Penicault Dr | 0.29mi | 3/1.0 (+1) | 1,068 (0%) | 1mo | $80,000 | $75 | 80 |
| 2518 Greenlawn Dr | 0.30mi | 3/1.0 (+1) | 1,120 (+5%) | 6mo | $60,000 | $54 | 68 |
| 2655 N Harbor Dr | 0.27mi | 3/1.5 (+1) | 1,007 (-6%) | 3mo | $115,000 | $114 | 68 |
| 2517 N Pineway Dr | 0.32mi | 3/1.0 (+1) | 1,073 (+0%) | 13mo | $30,000 | $28 | 68 |
| 2606 Eldorado Dr | 0.21mi | 3/1.5 (+1) | 1,131 (+6%) | 11mo | $75,000 | $66 | 64 |
| 2651 Atoll Dr | 0.32mi | 3/1.0 (+1) | 1,000 (-6%) | 8mo | $103,000 | $103 | 63 |
| 2403 Octavia Dr S | 0.39mi | 3/1.0 (+1) | 1,026 (-4%) | 10mo | $90,000 | $88 | 62 |
| 2360 Vermillion Dr | 0.47mi | 3/1.0 (+1) | 1,064 (-0%) | 15mo | $120,000 | $113 | 59 |
| 1400 Darwood Dr | 0.60mi | 3/1.5 (+1) | 1,014 (-5%) | 1mo | $75,200 | $74 | 56 |
| 1706 Bass Dr | 0.67mi | 3/1.0 (+1) | 1,008 (-6%) | 4mo | $50,000 | $50 | 51 |
| 1557 Pineway Dr S | 0.36mi | 3/2.0 (+1) | 925 (-13%) | 7mo | $125,000 | $135 | 46 |
| 2653 Morningside Dr | 0.51mi | 3/1.5 (+1) | 1,216 (+14%) | 12mo | $90,313 | $74 | 36 |
Match score weights: distance 35% · size 25% · config 20% · recency 20%. Top-matched comps best support the ARV.
Projected returns pro-forma
-3.0% appreciation · 8.0% rent growth · sell at horizon
- IRR
- 97.3%
- Equity multiple
- 5.92×
- Total profit
- $41,368
- Equity at exit
- $4,473
- IRR
- —
- Equity multiple
- 14.57×
- Total profit
- $114,028
- Equity at exit
- $2,594
Cash invested: $8,400 (down + closing). Projections, not guarantees.
Landlord ↔ Tenant lean methodology
- Overall (STATE)
- 90 Strongly Landlord-Friendly
- State Alabama
- 90 Strongly Landlord-Friendly · R+15
- County
- — inherits STATE
- City
- — inherits STATE
ZIP-level market 36605
- Rents YoY
- 8.3%
- Active inventory
- 139
- Price-to-rent
- 2.3×
Monthly cashflow live
- Estimated rent
- $1,069 high interval (Pro) →
- Mortgage (P&I)
- −$157
- Tax est. 1.5%
- −$38 /mo · $450/yr
- Insurance
- −$12
- HOA
- −$0
- Vacancy / Maint / Mgmt
- −$224
- Net cashflow
- $637
Break-even live
UW: 25.0% down · 7.5% · 30yr · 1.5% tax · 5.0% vac · 8.0% maint · 8.0% mgmt
Financing live
Cash to close
- Down payment
- $7,500
- Closing costs
- $900
- Reserves months
- —
- Total cash needed
- —
Loan-product check · same deal, 3 products live
Conventional
25% down · 7.5% · 30yr
- Down + closing
- —
- Monthly P&I
- —
- Monthly cashflow
- —
- DSCR
- —
- Eligible?
- —
Personal DTI + credit; lowest rate.
DSCR
20% down · 8.5% · 30yr
- Down + closing
- —
- Monthly P&I
- —
- Monthly cashflow
- —
- DSCR
- —
- Eligible?
- —
No personal income docs; deal must DSCR.
Hard money
10% down · 12.0% · 12mo
- Down + closing
- —
- Monthly P&I
- —
- Monthly cashflow
- —
- DSCR
- —
- Eligible?
- —
Short-term bridge; refi at stabilization.
Rent comps 16 comps
| Address | Beds | Baths | Sqft | Rent | $/sqft | DOM | Units | Dist |
|---|---|---|---|---|---|---|---|---|
| 1466 Darwood Dr Mobile, AL | 3.0 | 1.5 | 1053 | $1,400 | $1.33 | 44d | 1 | 0.44mi |
| 1506 Flowers Dr Unit B Mobile, AL | 2.0 | 1.0 | 1000 | $795 | $0.80 | 21d | 1 | 0.47mi |
| 2359 Vermillion Dr Mobile, AL | 3.0 | 1.0 | 1064 | $895 | $0.84 | 21d | 1 | 0.47mi |
| 1411 Greenbrier Dr Mobile, AL | 3.0 | 1.0 | 1069 | $995 | $0.93 | 44d | 1 | 0.55mi |
| 2366 White St Unit B Mobile, AL | 2.0 | 1.0 | 900 | $845 | $0.94 | 44d | 1 | 0.61mi |
| 2456 McLaughlin Dr Mobile, AL | 3.0 | 1.0 | 1405 | $1,300 | $0.93 | 44d | 1 | 0.65mi |
| 1302 Navco Rd Mobile, AL | 2.0 | 1.0 | 1009 | $935 | $0.93 | 13d | 13 | 0.86mi |
| 207 Riverbend Dr #207 Mobile, AL | 2.0 | 1.0 | 843 | $1,150 | $1.36 | 44d | 1 | 1.02mi |
| 957 Navco Rd Mobile, AL | 2.0 | 1.5 | 812 | $850 | $1.05 | 21d | 1 | 1.23mi |
| 2115 Barron Pl Mobile, AL | 3.0 | 1.0 | 1000 | $1,200 | $1.20 | 44d | 1 | 1.25mi |
| 2425 Nortons Ln Unit D Mobile, AL | 2.0 | 1.0 | 1050 | $1,100 | $1.05 | 13d | 1 | 1.28mi |
| 2425 Nortons Ln Unit C Mobile, AL | 2.0 | 1.0 | 1050 | $1,200 | $1.14 | 44d | 1 | 1.28mi |
| 1601 Neshota Dr Apt 19 Mobile, AL | 2.0 | 1.0 | 750 | $800 | $1.07 | 44d | 1 | 1.36mi |
| 1601 Neshota Dr Apt 86 Mobile, AL | 3.0 | 1.0 | 880 | $900 | $1.02 | 44d | 1 | 1.36mi |
| 1601 Neshota Dr Mobile, AL | 2.0–3.0 | 1.0 | 815 | $735 | $0.90 | 13d | 7 | 1.36mi |
| 1351 Dauphin Island Pkwy Mobile, AL | 3.0 | 1.0 | 992 | $1,095 | $1.10 | 44d | 1 | 1.38mi |
Listing history 2 events
-
2026-05-05status Pending 920-char remark
-
2026-04-27$30,000 Active 920-char remark
ⓘ Source: listings_history table (triggers on properties + properties_extension) + one-shot
backfill from property_details.listing_events for pre-trigger history.
Climate risk First Street
- Flood 1/10 Low FEMA zone X (unshaded) · 0% chance over 30 yrs
- Wildfire 2/10 Low
- Heat 9/10 Extreme 6 d/yr ≥105°F today · 18 d/yr by 30 yrs out
- Wind 9/10 Extreme 99% chance of damaging wind over 30 yrs
- Air quality 2/10 Low 1 unhealthy d/yr today · 1 by 30 yrs out
Nearby sold comps map
Loading sold comps map…
Walkable amenities ~0.75 mi
Loading nearby amenities…
Taxation est. · year 1
- Rental income
- $12,824
- − Mortgage interest
- −$1,680
- − Property taxes
- −$450
- − Insurance
- −$150
- − Repairs & maintenance
- −$1,026
- − Management
- −$1,026
- − Depreciation
- −$873
- Taxable income
- $7,619
- Est. tax owed @ 24.0%
- −$1,829
- After-tax cash flow
- $5,814/yr
For passive investors: Depreciation is non-cash, so a rental often shows a tax loss while cash-flowing — sheltering income. Rental losses are passive: they offset passive income freely, and up to $25,000/yr can offset ordinary (W-2) income if you actively participate and your MAGI is under $100k (phasing out to $0 by $150k); unused losses carry forward. On sale, claimed depreciation is recaptured at up to 25%, and gains may owe capital-gains tax (a 1031 exchange can defer both). Figures are a year-1 estimate at your 24.0% rate — not tax advice; consult a CPA.
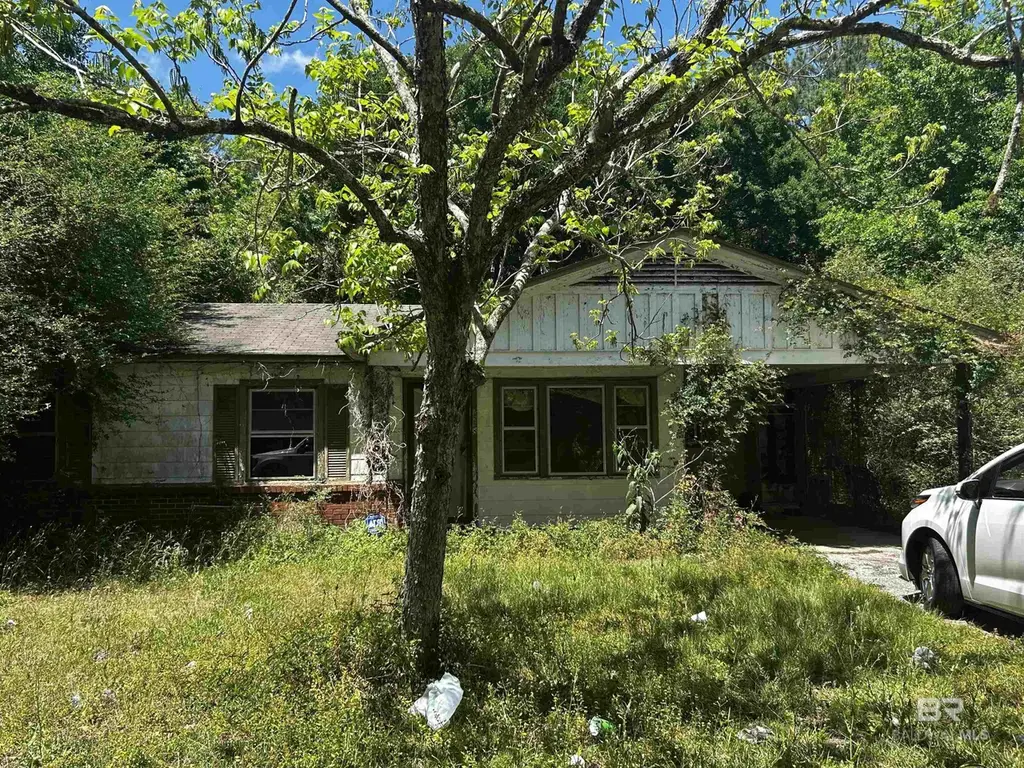
Condition & rehab AI · 12 photos
This property presents a significant renovation opportunity with extensive repairs and updates needed to bring it up to modern standards.
Repairs flagged
- Major Exterior siding — Severe peeling and damage
- Major Windows — Dirty and possibly broken
- Major Flooring — Worn-out and in need of replacement
- Major Paint — Peeling and exposed insulation
- Major HVAC/mechanicals — No visible units
Value-add opportunities
- Both Landscaping and curb appeal — Improves aesthetics and first impression
- Both Paint and interior updates — Enhances interior and curb appeal
- Both HVAC and mechanicals — Ensures comfort and energy efficiency
- Both Windows and exterior — Improves energy efficiency and security
Renovation cost estimate screening
| Repair item | Severity | Est. cost |
|---|---|---|
| Exterior siding · Severe peeling and damage | Major | $15,000–50,000 |
| Windows · Dirty and possibly broken | Major | $15,000–50,000 |
| Flooring · Worn-out and in need of replacement | Major | $15,000–50,000 |
| Paint · Peeling and exposed insulation | Major | $15,000–50,000 |
| HVAC/mechanicals · No visible units | Major | $15,000–50,000 |
| Total estimated repair cost · 5 items | $75,000–250,000 |
Value-add ROI direction
- Both Landscaping and curb appeal — Improves aesthetics and first impression ↑
- Both Paint and interior updates — Enhances interior and curb appeal ↑
- Both HVAC and mechanicals — Ensures comfort and energy efficiency ↑
- Both Windows and exterior — Improves energy efficiency and security ↑
ⓘ Cost ranges are severity-bucket heuristics (US national rule-of-thumb). Get contractor quotes + a written scope before underwriting a rehab budget.
Schools (NCES district)
- District
- Mobile County
- NCES district ID
- 0102370
- Math proficiency
- 15% ▼ -28.00%
- Reading proficiency
- 39% ▬ 0.00%
- Median HH income
- $42,455
- Composite
- 22.9/100
- National rank
- #8002
- State rank
- #81 of 129 in AL
Livability — Mobile
- Score
- 75/100
- State rank
- #20
- US rank
- #4262
Category grades
Schools grade is shown separately in the Schools card above.
Census & demographics
- Census place
- Mobile, AL
- County
- Mobile County · 246,577 people
- City population
- 205,729
- Metro
- Mobile, AL
- Population (ZIP)
- 25,104
- Household income
- $43,538
- Rent vs Own
- Severe rent burden
- 1521.0
Population outlook (Mobile County) Hauer SSP2
- Today (2025)
- 415,303 people
- By 2030
- 411,755 · -0.9%
- By 2040
- 399,670 · -3.8%
- By 2050
- 382,616 · -7.9%
- By 2075
- 337,353 · -18.8%
- By 2100
- 283,391 · -31.8%
Race, ethnicity, and origin ACS 2023
- Neighborhood character
- Predominantly Black (67%)
- Race & ethnicity
- Black 67% White 27% Two or more races 4% Hispanic / Latino 3%
- Common ancestry
- Lithuanian 3% Slovak 2% Iranian 1%
- Foreign-born
- 3% · Canada
- Languages at home
- 97% English-only · Spanish 2%
Political lean MEDSL · Mobile
- 2024 margin
- R (+16.4) · D 41.3% · R 57.7%
- 2008→2024 swing
- -7.7pp toward R · 2008: -8.7pp · 2024: -16.4pp
- All cycles
- 2024: R+16.4 2020: R+11.9 2016: R+13.9 2012: R+9.3 2008: R+8.7
Not yet ingested
- Civics
- —
Market trends
- HPI YoY
- ▼ -96.46%
- Current HPI
- 125.9526
- Rent YoY
- ▲ 8.26%
- Metro
- Mobile, AL
- State GDP YoY
- ▲ 2.94%
- F500 in state
- 4
Industry mix (Fortune 500 HQ in AL)
| Industry | F500 HQs | Revenue |
|---|---|---|
| Financial Services | 1 | $8B |
|
||
| Healthcare | 1 | $5B |
|
||
Price history
2 events — show timeline
- 2026-05-05 Pending — BCAR
- 2026-04-27 Listed $30,000 BCAR
Cash-flow waterfall
monthlySold comps — $/sqft
last 12 mo · ≤1 miLoading sold comps…