4662 New Amsterdam Rd · New Amsterdam, IN
Flood risk 1/10 · Minimal
- FEMA flood zone
- X (unshaded)
- Chance of flooding over 30 yrs
- 0.0%
- Est. flood insurance / yr
- $507 – $1,088
Fire risk 3/10 · Minor
- Est. fire insurance / yr
- $717 – $1,331
Heat risk 5/10 · Moderate
- Hot days now (above 104°F)
- 7 days/yr
- Hot days in 30 yrs
- 20 days/yr
Wind risk 2/10 · Minimal
- Chance of severe wind over 30 yrs
- 3.0%
Air-quality risk 2/10 · Minimal
- Unhealthy air days now
- 1 days/yr
- Unhealthy air days in 30 yrs
- 2 days/yr
Risk factors via First Street. Map © Google.
Why this score? — see what drove the C- grade
The composite is a weighted blend of 9 inputs, each scored 0–100. Each bar is that input's sub-score; the figure is the points it added to the 100-point composite (weight × sub-score).
- Cash flow +16.9/30.0
- Appreciation +8.1/10.0
- ARV discount +7.5/15.0
- DSCR +5.2/10.0
- Schools +3.9/10.0
- 1% rule +3.6/10.0
- Livability +3.3/5.0
- Rent growth +2.5/5.0
- Condition / age +2.5/5.0
$118,500
🖨 Deal sheet 📄 Offer letter ✓ Due diligence
Listing remarks
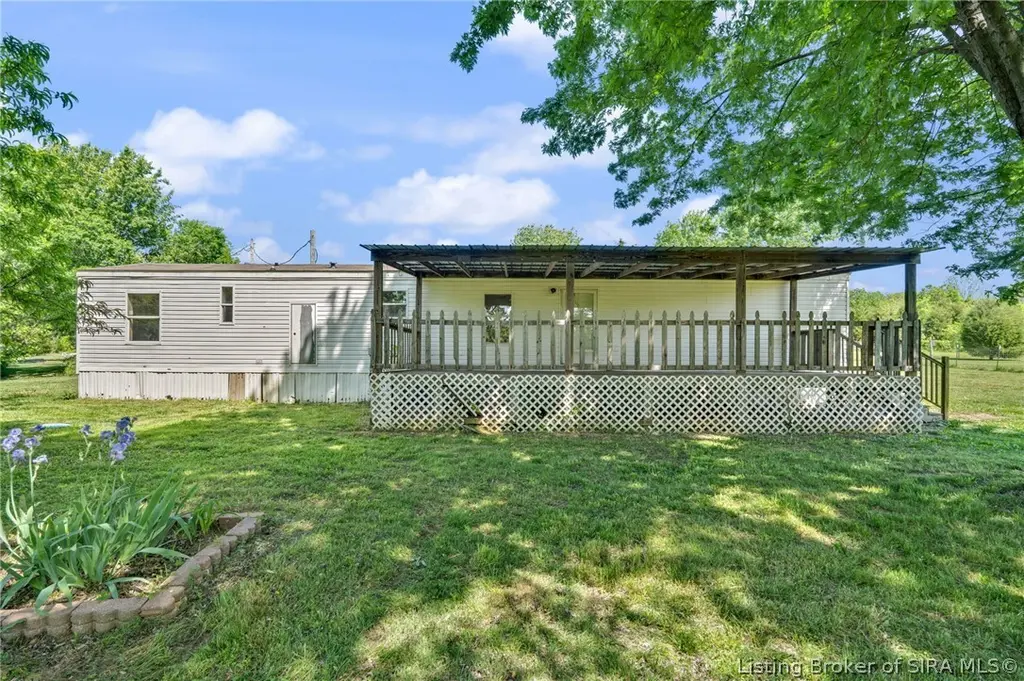
Charming fixer upper opportunity! This 3-bedroom, 1 full bath single-wide home is situated on 1.47 acres in Harrison County. The open concept floor plan offers a functional layout that’s perfect for everyday living. Enjoy relaxing on the large covered front porch, ideal for taking in the peaceful surroundings. A storage shed is also included, providing extra space for tools or outdoor equipment. Recent updates include all new plumbing, and the septic system was pumped in November 2025, adding peace of mind as you plan your improvements. Don’t miss your chance to make this property your own. Call today to schedule your private showing!
Key facts
- Recent updates
- New plumbing
- Storage shed
Tags
Property features AI
Finance
- Financial info: Annual tax amount available
Exterior
- Parking: No garage
- Utilities: Public water connected; Septic tank
- Home design: Single-wide mobile home; One story; Metal roof; Vinyl siding
- Construction: Metal roof; Vinyl siding; Crawl space foundation; Built above grade finished area 924
- Exterior features: Covered porch; Porch; Shed(s); Has view; Lot approximately 1.47 acres; Zoned residential/agricultural
Interior
- Kitchen: Open kitchen; Microwave; Oven; Range; Refrigerator
- Bedrooms: Bedroom on the first floor
- Flooring: Tile in bathroom
- Bathrooms: 1 full bathroom (first floor)
- Heating & cooling: Forced air heating; Central air conditioning
- Interior features: Ceiling fan(s); Eat-in kitchen; Main level primary bedroom; Mud room; Open floorplan; Utility room
- Laundry & utility: Main level laundry room; Utility room
Neighborhood map
What this means for you Summary
Snapshot
- This is a 3-bed/2.0-bath manufactured listed at $118k.
Deal economics
- At list price, monthly cash flow is $78 ($931/yr) — positive.
- The deal already cash-flows at list — no discount required.
- To meet the 1% rule (rent ≥ 1% of price), the offer needs to be $102k (14.0% below list).
- Recommended offer: $102k (14.0% below list) — sets the bar for 1% rule.
Location & tenants
- Location reads 66/100 on livability (#275 in IN) — a middle-class / working-renter tenant base. Strengths: employment A+, cost of living A+, housing A+; Watch: crime C-, schools D+, amenities F.
- South Harrison Community Schools (town): math 42% / reading 50% proficiency, ranked #89 of 301 in IN (top 30%) — families likely to look elsewhere, expect single-tenant / working-renter base with shorter leases.
- Market conditions: 4 active listings in the ZIP; 158 units permitted in Harrison County in 2024 (0 in 5+ unit buildings).
Forward outlook
- In year one you build about $8k of equity ($819 loan paydown + $7k appreciation (6.2% local appreciation)).
- Harrison County population projected to shrink 6% by 2050 — rents likely to lag national; underwrite the cash flow, not the appreciation.
- At projected returns (6.2% appreciation + 3.0% rent growth), your $33k cash investment doubles in ~4 years — after that, you're playing with house money.
- By year 5, paydown + projected appreciation supports a ~$36k cash-out refi (75% LTV) — recoverable capital for the next deal without selling this one.
Negotiation context
- It's been on market 47 days — a 3% lower offer ($115k) is reasonable based on typical stale-listing flexibility.
- 2 sale attempts with the ask held roughly flat each time — persistent listings suggest the price (not the market) is what's stuck; bring a comps-based counter.
Risks & watch-outs
- Climate carrying-cost: extreme-heat days projected 7→20/yr by 2055 (HVAC capex compounding) — expect insurance premiums to compound above CPI over the hold.
Questions for the listing agent
- It's been on market 47 days. Have you received any prior offers? Is the seller open to a 14% concession, seller financing, or rate buy-down credit?
- Is there a deadline driving the sale (1031 exchange, divorce, estate, relocation)? That informs how much negotiation room exists.
- Schools are D-rated, which usually means shorter tenancies and higher turnover. Who's the typical renter profile here, and what's been the actual vacancy rate?
- What's the average days-on-market for RENTAL listings here right now (not sales)? A rising rental-DOM trend means longer vacancies and softer asking-rent achievability than the comps imply.
- What's the recent tenant-quality profile in this submarket — average credit score on applications, eviction rate, late-payment / NSF rate, and stable-employment percentage? A property-management company in the area should have these aggregated.
- How much new for-sale + rental construction is in the pipeline within 1–3 miles? Heavy new supply typically softens prices + rents 12–24 months out; constrained supply supports both.
Investment metrics
- 1% rule
- 0.86% ✗
- Cap rate
- 7.08%
- Cash-on-cash
- 2.81%
- DSCR
- 1.12
- GRM
- 9.7
CMA / ARV
No comps found within radius.
Projected returns pro-forma
6.21% appreciation · 3.0% rent growth · sell at horizon
- IRR
- 18.1%
- Equity multiple
- 2.22×
- Total profit
- $40,623
- Equity at exit
- $76,097
- IRR
- 17.6%
- Equity multiple
- 4.47×
- Total profit
- $115,156
- Equity at exit
- $139,404
Cash invested: $33,180 (down + closing). Projections, not guarantees.
Landlord ↔ Tenant lean methodology
- Overall (STATE)
- 90 Strongly Landlord-Friendly
- State Indiana
- 90 Strongly Landlord-Friendly · R+11
- County
- — inherits STATE
- City
- — inherits STATE
ZIP-level market 47110
- Home prices YoY
- 2.5%
- Active inventory
- 4
- Price-to-rent
- 9.7×
Monthly cashflow live
- Estimated rent
- $1,019 medium interval (Pro) →
- Mortgage (P&I)
- −$621
- Tax from tax record
- −$57 /mo · $680/yr
- Insurance
- −$49
- HOA
- −$0
- Vacancy / Maint / Mgmt
- −$214
- Net cashflow
- $78
Break-even live
UW: 25.0% down · 7.5% · 30yr · 1.5% tax · 5.0% vac · 8.0% maint · 8.0% mgmt
Financing live
Cash to close
- Down payment
- $29,625
- Closing costs
- $3,555
- Reserves months
- —
- Total cash needed
- —
Loan-product check · same deal, 3 products live
Conventional
25% down · 7.5% · 30yr
- Down + closing
- —
- Monthly P&I
- —
- Monthly cashflow
- —
- DSCR
- —
- Eligible?
- —
Personal DTI + credit; lowest rate.
DSCR
20% down · 8.5% · 30yr
- Down + closing
- —
- Monthly P&I
- —
- Monthly cashflow
- —
- DSCR
- —
- Eligible?
- —
No personal income docs; deal must DSCR.
Hard money
10% down · 12.0% · 12mo
- Down + closing
- —
- Monthly P&I
- —
- Monthly cashflow
- —
- DSCR
- —
- Eligible?
- —
Short-term bridge; refi at stabilization.
Listing history 17 events
-
2026-06-18days on market $118,500 Active 47 DOM
-
2026-06-17days on market $118,500 Active 46 DOM
-
2026-06-16days on market $118,500 Active 45 DOM
-
2026-06-15days on market $118,500 Active 44 DOM
-
2026-06-13pricedays on market $118,500 Active 42 DOM
-
2026-06-10days on market $120,000 Active 39 DOM
-
2026-06-09days on market $120,000 Active 38 DOM
-
2026-06-08days on market $120,000 Active 37 DOM
-
2026-06-07days on market $120,000 Active 36 DOM
-
2026-06-05days on market $120,000 Active 33 DOM
-
2026-06-03days on market $120,000 Active 32 DOM
-
2026-06-02days on market $120,000 Active 31 DOM
-
2026-06-01days on market $120,000 Active 30 DOM
-
2026-05-31days on market $120,000 Active 29 DOM
-
2026-05-09status Active
-
2026-05-02historical
-
2026-04-23$120,000 Active
ⓘ Source: listings_history table (triggers on properties + properties_extension) + one-shot
backfill from property_details.listing_events for pre-trigger history.
Tax reassessment forecast IN · Partial reset (capped growth)
- Current annual tax
- $680 · $57/mo
- Projected year-2 tax
- $844 · $70/mo
- Expected delta
- +$163/yr (+$14/mo · 24.0%)
ⓘ Screening estimate from a state-policy table — verify with the county assessor before closing.
Climate risk First Street
- Flood 1/10 Low FEMA zone X (unshaded) · 0% chance over 30 yrs
- Wildfire 3/10 Moderate
- Heat 5/10 Major 7 d/yr ≥104°F today · 20 d/yr by 30 yrs out
- Wind 2/10 Low 3% chance of damaging wind over 30 yrs
- Air quality 2/10 Low 1 unhealthy d/yr today · 2 by 30 yrs out
Nearby sold comps map
Loading sold comps map…
Walkable amenities ~0.75 mi
Loading nearby amenities…
Taxation est. · year 1
- Rental income
- $12,229
- − Mortgage interest
- −$6,638
- − Property taxes
- −$680
- − Insurance
- −$592
- − Repairs & maintenance
- −$978
- − Management
- −$978
- − Depreciation
- −$3,447
- Taxable loss
- −$1,085
- Est. tax savings @ 24.0%
- +$260
- After-tax cash flow
- $1,192/yr
For passive investors: Depreciation is non-cash, so a rental often shows a tax loss while cash-flowing — sheltering income. Rental losses are passive: they offset passive income freely, and up to $25,000/yr can offset ordinary (W-2) income if you actively participate and your MAGI is under $100k (phasing out to $0 by $150k); unused losses carry forward. On sale, claimed depreciation is recaptured at up to 25%, and gains may owe capital-gains tax (a 1031 exchange can defer both). Figures are a year-1 estimate at your 24.0% rate — not tax advice; consult a CPA.
Schools (NCES district)
- District
- South Harrison Community Schools
- NCES district ID
- 1810360
- Math proficiency
- 42% ▼ -12.00%
- Reading proficiency
- 50% ▼ -3.00%
- Median HH income
- $50,528
- Composite
- 39.49/100
- National rank
- #3950
- State rank
- #89 of 301 in IN
Livability — New Amsterdam
- Score
- 66/100
- State rank
- #275
- US rank
- #11483
Category grades
Schools grade is shown separately in the Schools card above.
Census & demographics
- Population (ZIP)
- 656
Population outlook (Harrison County) Hauer SSP2
- Today (2025)
- 40,288 people
- By 2030
- 40,265 · -0.1%
- By 2040
- 39,538 · -1.9%
- By 2050
- 37,781 · -6.2%
- By 2075
- 33,200 · -17.6%
- By 2100
- 26,668 · -33.8%
Race, ethnicity, and origin ACS 2023
- Neighborhood character
- Predominantly White (97%)
- Race & ethnicity
- White 97% Hispanic / Latino 2%
- Common ancestry
- Italian 15% Slovak 8% Lithuanian 7%
- Languages at home
- 99% English-only · German/W. Germanic 1%
Political lean MEDSL · Harrison
- 2024 margin
- Solid R (+47.0) · D 25.6% · R 72.5% · Other 1.8%
- 2008→2024 swing
- -28.9pp toward R · 2008: -18.0pp · 2024: -47.0pp
- All cycles
- 2024: R+47.0 2020: R+45.6 2016: R+44.4 2012: R+22.8 2008: R+18.0
Not yet ingested
- Civics
- —
Market trends
- HPI YoY
- ▲ 6.21%
- Current HPI
- 252.7375
- Rent YoY
- —
- Metro
- —
- State GDP YoY
- ▲ 2.90%
- F500 in state
- 18
Industry mix (Fortune 500 HQ in IN)
| Industry | F500 HQs | Revenue |
|---|---|---|
| Industrial Machinery | 2 | $37B |
|
||
| Healthcare | 1 | $177B |
|
||
| Pharmaceuticals | 1 | $45B |
|
||
| Metals / Steel | 1 | $18B |
|
||
| Agriculture | 1 | $17B |
|
||
| Packaging | 1 | $12B |
|
||
Price history
3 events — show timeline
- 2026-05-09 Relisted — SIRA
- 2026-05-02 Delisted — SIRA
- 2026-04-23 Listed $120,000 SIRA
Property tax history
+13.0%/yrLatest (2024): $680 · -7.1% YoY. Source: county tax records.
Cash-flow waterfall
monthlySold comps — $/sqft
last 12 mo · ≤1 miLoading sold comps…