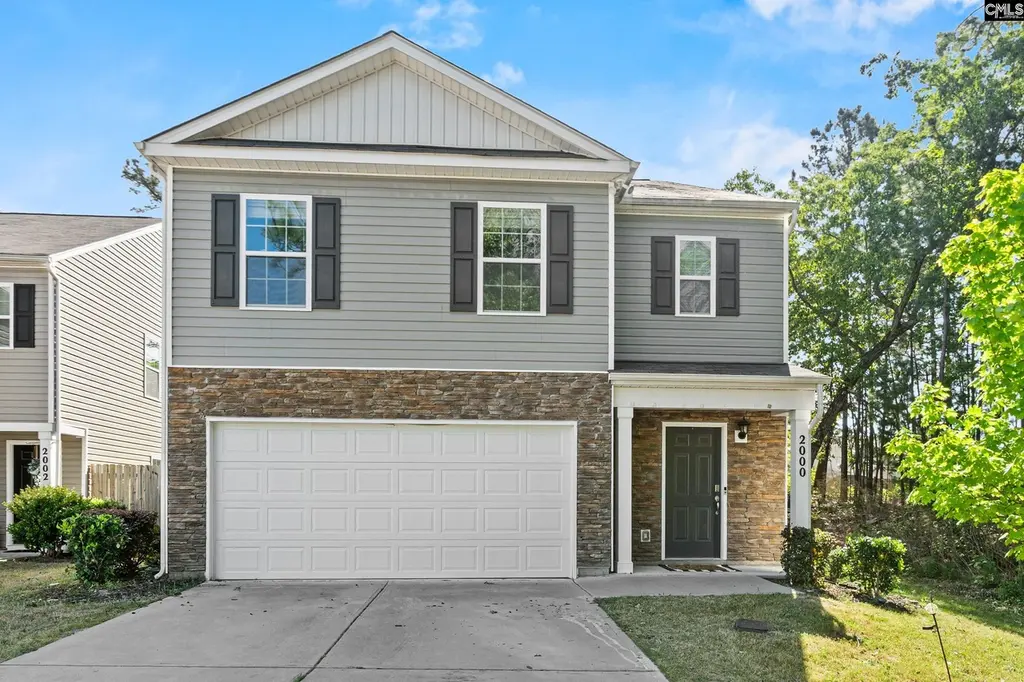
2000 Elmridge Rd · Columbia, SC
Flood risk 1/10 · Minimal
- FEMA flood zone
- X (unshaded)
- Chance of flooding over 30 yrs
- 0.0%
- Est. flood insurance / yr
- $507 – $1,088
Fire risk 4/10 · Minor
- Est. fire insurance / yr
- $783 – $1,453
Heat risk 6/10 · Moderate
- Hot days now (above 108°F)
- 7 days/yr
- Hot days in 30 yrs
- 16 days/yr
Wind risk 6/10 · Moderate
- Chance of severe wind over 30 yrs
- 74.0%
Air-quality risk 3/10 · Minor
- Unhealthy air days now
- 2 days/yr
- Unhealthy air days in 30 yrs
- 2 days/yr
Risk factors via First Street. Map © Google.
Why this score? — see what drove the D- grade
The composite is a weighted blend of 9 inputs, each scored 0–100. Each bar is that input's sub-score; the figure is the points it added to the 100-point composite (weight × sub-score).
- Cash flow +11.7/30.0
- ARV discount +7.5/15.0
- Condition / age +4.0/5.0
- Livability +3.9/5.0
- 1% rule +3.5/10.0
- DSCR +3.4/10.0
- Rent growth +3.0/5.0
- Schools +2.6/10.0
- Appreciation +0.0/10.0
$279,900
🖨 Deal sheet 📄 Offer letter ✓ Due diligence
Listing remarks
Spacious, functional, and designed for the way you live—this 5-bedroom, 3-bath home checks all the right boxes. The main level features durable LVP flooring throughout and an open-concept layout that seamlessly connects the living, dining, and kitchen spaces. The kitchen is the heart of the home, complete with a large island, ample cabinetry, and a walk-in pantry—perfect for everyday living and entertaining alike. A main-floor bedroom and full bath allow for flexibility for guests, a home office, or multigenerational living. Upstairs, you’ll find four generously sized bedrooms, providing plenty of space for everyone to spread out. Situated at the end of the street, this ho
Key facts
- Ample cabinetry
- Main-floor bedroom
- Large island
Tags
Property features AI
Finance
- HOA & community: Homeowners association present; Association covers common area maintenance
Exterior
- Parking: Attached garage with 2 spaces (main level); Total of 2 parking spaces
- Utilities: Public water; Public sewer
- Home design: Two-story home; Vinyl exterior
- Construction: Slab foundation
- Exterior features: Full gutters; Sprinkler system; Uncovered back porch; Rear wood privacy fence
Interior
- Kitchen: Eat-in kitchen with island; Pantry; Granite countertops; Painted cabinets; Recessed lighting
- Bedrooms: Master bedroom with double vanity, separate shower, walk-in closet, recessed lighting, carpet (second level); Bedroom 2 with private closet, recessed lighting, carpet (main level); Bedrooms 3–5 each with private closet, recessed lighting, carpet (second level)
- Flooring: Luxury vinyl plank on main living areas; Carpet in bedrooms
- Bathrooms: Three full bathrooms total; One main-level full bathroom; Two additional full bathrooms
- Heating & cooling: Central heating; Central air conditioning
- Interior features: Garage opener; Smoke detector; Pull-down attic access; Gas log (natural) fireplace; Free-standing range
- Laundry & utility: Laundry in utility room (washer/dryer on second level); Tankless water heater
Neighborhood map
What this means for you Summary
Snapshot
- This is a 5-bed/3.0-bath single-family listed at $280k. Condition is rated good.
Deal economics
- At list price, monthly cash flow is $-82 ($-980/yr) — negative.
- To cash-flow at today's rent, offer at most $268k (4.2% below list).
- To meet the 1% rule (rent ≥ 1% of price), the offer needs to be $239k (14.7% below list).
- Recommended offer: $239k (14.7% below list) — sets the bar for 1% rule.
Location & tenants
- Location reads 78/100 on livability (#18 in SC, #2,436 nationally) — a middle-class / working-renter tenant base. Strengths: amenities A+, commute A+, cost of living A+; Watch: employment D, crime F.
- Richland 01 (urban): math 26% / reading 36% proficiency, ranked #54 of 80 in SC (top 68%) — families likely to look elsewhere, expect single-tenant / working-renter base with shorter leases; 64% free/reduced lunch — lower-income household profile, screen leases tightly.
- Zoned schools: Mill Creek Elementary (math 22% / reading 22%, grade F, #475 of 597 statewide, top 81%, 339 students, 100% FRL); Lower Richland High (math 5% / reading 64%, grade F, #185 of 196 statewide, top 94%, 1,244 students, 100% FRL) — zoned schools average 100% FRL vs 64% district-wide (36 pts higher); higher-poverty schools than district average — tighter screening recommended.
- Market conditions: Rents rising (+2.1%/yr); 295 active listings in the ZIP; 5 comparable units currently listed for rent nearby; rentals at typical pace (median 15d on market — plan ~3-4 weeks tenant-placement turnaround); 3,472 units permitted in Richland County in 2024 (1,096 in 5+ unit buildings).
- At $2,387/mo this rent would consume 49% of the median local household income ($59k/yr) (locally 1716% of renters already pay >50% of income on rent) — very limited rent-growth headroom before tenants either downsize or default.
Forward outlook
- Local home prices are declining (-3.0%/yr); year-one equity from $2k of loan paydown is wiped out by about $8k of value loss. Plan a longer hold.
- Richland County population projected at +30% by 2050 — long-run rental-demand tailwind backs the buy-and-hold thesis.
Negotiation context
- It's been on market 57 days — a 3% lower offer ($272k) is reasonable based on typical stale-listing flexibility.
- 2 sale attempts since 5y ago with the ask held roughly flat each time — persistent listings suggest the price (not the market) is what's stuck; bring a comps-based counter.
Risks & watch-outs
- Climate carrying-cost: major wind risk, 74% chance of damaging wind over 30y; extreme-heat days projected 7→16/yr by 2055 (HVAC capex compounding) — expect insurance premiums to compound above CPI over the hold.
Questions for the listing agent
- What do current leases actually rent for vs. the listed asking? Can we see a recent rent roll and the last 12 months of T-12 income?
- It's been on market 57 days. Have you received any prior offers? Is the seller open to a 15% concession, seller financing, or rate buy-down credit?
- What does the HOA fee cover, when was the last increase, and are there any pending special assessments or reserve-fund shortfalls?
- Is there a deadline driving the sale (1031 exchange, divorce, estate, relocation)? That informs how much negotiation room exists.
- Schools are D-rated, which usually means shorter tenancies and higher turnover. Who's the typical renter profile here, and what's been the actual vacancy rate?
- Crime grade is F in this area — have there been break-ins, vandalism, or insurance claims at this property in the last 3 years? What carrier currently insures it and at what premium?
- The area grade is low — what's the realistic commute time and amenity access for the typical tenant pool here? Any planned neighborhood developments (good or bad) we should know about?
- What's the average days-on-market for RENTAL listings here right now (not sales)? A rising rental-DOM trend means longer vacancies and softer asking-rent achievability than the comps imply.
- What's the recent tenant-quality profile in this submarket — average credit score on applications, eviction rate, late-payment / NSF rate, and stable-employment percentage? A property-management company in the area should have these aggregated.
- How much new for-sale + rental construction is in the pipeline within 1–3 miles? Heavy new supply typically softens prices + rents 12–24 months out; constrained supply supports both.
Investment metrics
- 1% rule
- 0.85% ✗
- Cap rate
- 5.94%
- Cash-on-cash
- -1.25%
- DSCR
- 0.94
- GRM
- 9.8
CMA / ARV
No comps found within radius.
Projected returns pro-forma
-3.0% appreciation · 2.08% rent growth · sell at horizon
- IRR
- -19.4%
- Equity multiple
- 0.33×
- Total profit
- $-52,691
- Equity at exit
- $41,734
- IRR
- -14.1%
- Equity multiple
- 0.22×
- Total profit
- $-61,171
- Equity at exit
- $24,201
Cash invested: $78,372 (down + closing). Projections, not guarantees.
Landlord ↔ Tenant lean methodology
- Overall (STATE)
- 90 Strongly Landlord-Friendly
- State South Carolina
- 90 Strongly Landlord-Friendly · R+6
- County
- — inherits STATE
- City
- — inherits STATE
ZIP-level market 29209
- Rents YoY
- 2.1%
- Active inventory
- 295
- Price-to-rent
- 9.8×
Monthly cashflow live
- Estimated rent
- $2,387 high interval (Pro) →
- Mortgage (P&I)
- −$1,468
- Tax est. 1.5%
- −$350 /mo · $4,198/yr
- Insurance
- −$117
- HOA
- −$33
- Vacancy / Maint / Mgmt
- −$501
- Net cashflow
- $-82
Break-even live
UW: 25.0% down · 7.5% · 30yr · 1.5% tax · 5.0% vac · 8.0% maint · 8.0% mgmt
Financing live
Cash to close
- Down payment
- $69,975
- Closing costs
- $8,397
- Reserves months
- —
- Total cash needed
- —
Loan-product check · same deal, 3 products live
Conventional
25% down · 7.5% · 30yr
- Down + closing
- —
- Monthly P&I
- —
- Monthly cashflow
- —
- DSCR
- —
- Eligible?
- —
Personal DTI + credit; lowest rate.
DSCR
20% down · 8.5% · 30yr
- Down + closing
- —
- Monthly P&I
- —
- Monthly cashflow
- —
- DSCR
- —
- Eligible?
- —
No personal income docs; deal must DSCR.
Hard money
10% down · 12.0% · 12mo
- Down + closing
- —
- Monthly P&I
- —
- Monthly cashflow
- —
- DSCR
- —
- Eligible?
- —
Short-term bridge; refi at stabilization.
Rent comps 5 comps
| Address | Beds | Baths | Sqft | Rent | $/sqft | DOM | Units | Dist |
|---|---|---|---|---|---|---|---|---|
| 352 Sandbach Rd Columbia, SC | 4.0 | 2.5 | 1976 | $2,300 | $1.16 | 14d | 1 | 0.30mi |
| 244 Savannah Wood Rd Hopkins, SC | 5.0 | 3.0 | 3033 | $2,500 | $0.82 | 14d | 1 | 1.11mi |
| 1912 Dominion Dr Columbia, SC | 4.0 | 2.0 | 1614 | $2,300 | $1.43 | 23d | 1 | 1.13mi |
| 331 Crooked Pine Ct Columbia, SC | 4.0 | 2.5 | 1775 | $2,133 | $1.20 | 19d | 1 | 1.16mi |
| 706 Common Widgeon WAY Hopkins, SC | 4.0 | 2.5 | 2157 | $2,430 | $1.13 | 14d | 1 | 1.22mi |
HOA detail
- Monthly dues
- $33 · $396/yr
Listing history 18 events
-
2026-06-18days on market $279,900 Active 57 DOM
-
2026-06-17days on market $279,900 Active 56 DOM
-
2026-06-16days on market $279,900 Active 55 DOM
-
2026-06-15days on market $279,900 Active 54 DOM
-
2026-06-14days on market $279,900 Active 52 DOM
-
2026-06-10days on market $279,900 Active 49 DOM
-
2026-06-09days on market $279,900 Active 48 DOM
-
2026-06-08days on market $279,900 Active 47 DOM
-
2026-06-07days on market $279,900 Active 46 DOM
-
2026-06-03days on market $279,900 Active 42 DOM
-
2026-06-03days on market $279,900 Active 41 DOM
-
2026-06-02price $279,900 Active 40 DOM
-
2026-06-01days on market $285,000 Active 40 DOM
-
2026-05-31days on market $285,000 Active 39 DOM
-
2026-05-19price $285,000
-
2026-04-22$289,000 Active
-
2021-12-10historical
-
2021-12-06$248,740 Active
ⓘ Source: listings_history table (triggers on properties + properties_extension) + one-shot
backfill from property_details.listing_events for pre-trigger history.
Climate risk First Street
- Flood 1/10 Low FEMA zone X (unshaded) · 0% chance over 30 yrs
- Wildfire 4/10 Moderate
- Heat 6/10 Major 7 d/yr ≥108°F today · 16 d/yr by 30 yrs out
- Wind 6/10 Major 74% chance of damaging wind over 30 yrs
- Air quality 3/10 Moderate 2 unhealthy d/yr today · 2 by 30 yrs out
Nearby sold comps map
Loading sold comps map…
Walkable amenities ~0.75 mi
Loading nearby amenities…
Taxation est. · year 1
- Rental income
- $28,643
- − Mortgage interest
- −$15,679
- − Property taxes
- −$4,198
- − Insurance
- −$1,400
- − Repairs & maintenance
- −$2,291
- − Management
- −$2,291
- − HOA
- −$396
- − Depreciation
- −$8,143
- Taxable loss
- −$5,755
- Est. tax savings @ 24.0%
- +$1,381
- After-tax cash flow
- $401/yr
For passive investors: Depreciation is non-cash, so a rental often shows a tax loss while cash-flowing — sheltering income. Rental losses are passive: they offset passive income freely, and up to $25,000/yr can offset ordinary (W-2) income if you actively participate and your MAGI is under $100k (phasing out to $0 by $150k); unused losses carry forward. On sale, claimed depreciation is recaptured at up to 25%, and gains may owe capital-gains tax (a 1031 exchange can defer both). Figures are a year-1 estimate at your 24.0% rate — not tax advice; consult a CPA.
Condition & rehab AI · 12 photos
This well-maintained, updated home is move-in ready with good curb appeal and a functional layout.
Value-add opportunities
- Resale Paint exterior trim — Enhances curb appeal
- Rental Clean gutters — Keeps property in good condition
Renovation cost estimate screening
Value-add ROI direction
- Resale Paint exterior trim — Enhances curb appeal ↑
- Rental Clean gutters — Keeps property in good condition ↑
ⓘ Cost ranges are severity-bucket heuristics (US national rule-of-thumb). Get contractor quotes + a written scope before underwriting a rehab budget.
Schools (NCES district)
- District
- Richland 01
- NCES district ID
- 4503360
- Math proficiency
- 26% ▼ -7.00%
- Reading proficiency
- 36% ▼ -5.00%
- Median HH income
- $38,931
- Composite
- 25.94/100
- National rank
- #7335
- State rank
- #54 of 80 in SC
Livability — Columbia
- Score
- 78/100
- State rank
- #18
- US rank
- #2436
Category grades
Schools grade is shown separately in the Schools card above.
Census & demographics
- County
- Richland County · 389,530 people
- City population
- 335,994
- Metro
- Columbia, SC
- Population (ZIP)
- 38,041
- Household income
- $58,772
- Rent vs Own
- Severe rent burden
- 1716.0
Population outlook (Richland County) Hauer SSP2
- Today (2025)
- 459,667 people
- By 2030
- 487,524 · +6.1%
- By 2040
- 542,035 · +17.9%
- By 2050
- 595,371 · +29.5%
- By 2075
- 732,998 · +59.5%
- By 2100
- 820,415 · +78.5%
Race, ethnicity, and origin ACS 2023
- Neighborhood character
- Diverse neighborhood (Simpson 0.62)
- Race & ethnicity
- Black 48% White 39% Two or more races 6% Hispanic / Latino 6% Asian 2%
- Hispanic origin (detail)
- Mexican 3% Puerto Rican 2%
- Common ancestry
- Slovak 2% Serbian 2% Italian 1%
- Foreign-born
- 6% · Canada, Jamaica
- Languages at home
- 93% English-only · Spanish 3% Arabic 1% Other Indo-European 1%
Political lean MEDSL · Richland
- 2024 margin
- Solid D (+34.6) · D 66.4% · R 31.8% · Other 1.8%
- 2008→2024 swing
- +5.7pp toward D · 2008: 28.9pp · 2024: 34.6pp
- All cycles
- 2024: D+34.6 2020: D+38.3 2016: D+32.9 2012: D+33.3 2008: D+28.9
Not yet ingested
- Civics
- —
Market trends
- HPI YoY
- ▼ -142.10%
- Current HPI
- 205.5679
- Rent YoY
- ▲ 2.08%
- Metro
- Columbia, SC
- State GDP YoY
- ▲ 4.51%
- F500 in state
- 2
Industry mix (Fortune 500 HQ in SC)
| Industry | F500 HQs | Revenue |
|---|---|---|
| Packaging | 1 | $7B |
|
||
Price history
+14.6% since first listed4 events — show timeline
- 2026-05-19 Price Changed $285,000 Consolidated MLS
- 2026-04-22 Listed $289,000 Consolidated MLS
- 2021-12-10 Delisted — Consolidated MLS
- 2021-12-06 Listed $248,740 Consolidated MLS
Cash-flow waterfall
monthlySold comps — $/sqft
last 12 mo · ≤1 miLoading sold comps…