3281 Lindsey Ln #4 · Vineyards, FL
Flood risk 6/10 · Moderate
- FEMA flood zone
- X (unshaded)
- Chance of flooding over 30 yrs
- 0.72%
- Est. flood insurance / yr
- $507 – $1,088
Fire risk 1/10 · Minimal
- Est. fire insurance / yr
- $947 – $1,759
Heat risk 10/10 · Severe
- Hot days now (above 107°F)
- 7 days/yr
- Hot days in 30 yrs
- 30 days/yr
Wind risk 10/10 · Severe
- Chance of severe wind over 30 yrs
- 99.0%
Air-quality risk 2/10 · Minimal
- Unhealthy air days now
- 2 days/yr
- Unhealthy air days in 30 yrs
- 2 days/yr
Risk factors via First Street. Map © Google.
Why this score? — see what drove the D- grade
The composite is a weighted blend of 9 inputs, each scored 0–100. Each bar is that input's sub-score; the figure is the points it added to the 100-point composite (weight × sub-score).
- ARV discount +7.5/15.0
- Cash flow +7.3/30.0
- Appreciation +5.1/10.0
- Schools +5.0/10.0
- 1% rule +4.0/10.0
- Livability +3.2/5.0
- Rent growth +2.7/5.0
- Condition / age +2.5/5.0
- DSCR +1.5/10.0
$329,000
🖨 Deal sheet (PDF) 📄 Offer letter ✓ Due diligence
Listing remarks
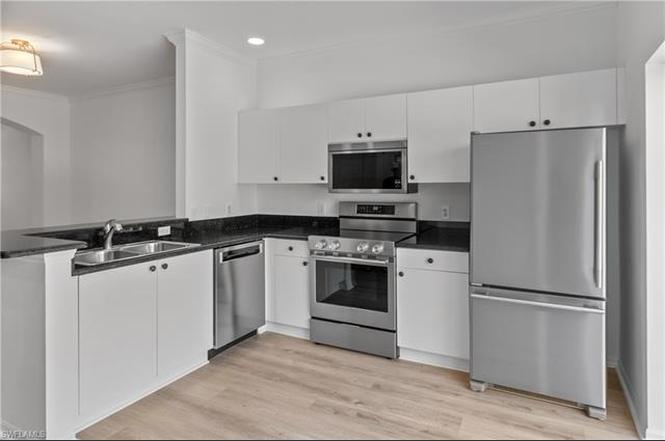
MOTIVATED SELLER. Bring an offer. Beautifully updated 3 bedroom 2.5 bath townhouse in a terrific location. Easy access to the beach and I-75. New luxury laminate throughout. New High end Kitchen Aid appliances. New light fixtures. Freshly painted, high ceilings, crown moldings. Relax on your deck overlooking the preserve. Master bedroom with ensuite, another bedroom has its own balcony, the third bedroom would be a perfect office or guest room. New water heater. HVAC has semi-annual maintenance agreement. Low quarterly dues. One car garage, freshly painted and new epoxy floor. Two community pools, with one steps away from your condo. Pets allowed to 40 lb. maximum.
Key facts
- Updated townhouse
- Easy access to beach
- Pets allowed
Tags
Property features AI
Finance
- Other: Complex has about 120 units; building contains 5 units with 2 floors
- HOA & community: Mandatory HOA; Master association fee $1,070 quarterly; Condo fee $990 quarterly; Professional management; Community pool; Community is non-gated; Maintenance covered: cable, internet/WiFi access, irrigation water, legal/accounting, manager, master association fee included, trash removal, water; Total annual recurring fees approximately $8,240
Exterior
- Parking: Attached garage (1 space); Paved driveway
- Utilities: Central water; Central sewer; Cable available
- Home design: Residential townhouse; 2-story floor plan; Built in 2004; Part of Cypress Glen Village
- Construction: Concrete block construction
- Exterior features: Stucco exterior; Shingle roof; Double hung windows; Rear exposure faces north; Preserve and wooded area views; Central irrigation; Located on a dead-end road; Deeded restrictions: limited number of vehicles, no commercial, no RV
Interior
- Kitchen: Dishwasher; Microwave; Range; Refrigerator/Freezer
- Bedrooms: 3 bedrooms with a split bedroom layout
- Flooring: Laminate flooring
- Bathrooms: 2 full bathrooms; 1 half bathroom; Master bath with shower only
- Heating & cooling: Central electric heat; Central electric air conditioning; Ceiling fans
- Interior features: High speed internet available; Dining area in living room; Laundry inside the residence; Unfurnished
- Laundry & utility: Washer; Dryer
Neighborhood map
What this means for you Summary
Snapshot
- This is a 3-bed/2.5-bath condo listed at $329k.
Deal economics
- At list price, monthly cash flow is $-434 ($-5k/yr) — negative.
- To cash-flow at today's rent, offer at most $252k (23.3% below list).
- To meet the 1% rule (rent ≥ 1% of price), the offer needs to be $297k (9.9% below list).
- Recommended offer: $252k (23.3% below list) — sets the bar for cash-flow.
Location & tenants
- Location reads 64/100 on livability (#679 in FL) — a middle-class / working-renter tenant base. Strengths: crime A+, employment A+, housing A-; Watch: health & safety D, amenities F, commute F.
- Collier (suburban): math 60% / reading 56% proficiency, ranked #16 of 73 in FL (top 22%) — acceptable for families but not a draw, mixed tenant base, ~2y average lease.
- Market conditions: Rents flat; 425 active listings in the ZIP; 40 comparable units currently listed for rent nearby; rentals at typical pace (median 15d on market — plan ~3-4 weeks tenant-placement turnaround); solid renter incomes; 3,520 units permitted in Collier County in 2024 (959 in 5+ unit buildings).
- This rent runs 39% of the median local income ($92k/yr) — at the standard rent-burdened threshold; future hikes will face affordability resistance.
Forward outlook
- In year one you build about $3k of equity ($2k loan paydown + $970 appreciation (0.3% local appreciation)).
- Collier County population projected at +30% by 2050 — long-run rental-demand tailwind backs the buy-and-hold thesis.
- By year 9, paydown + projected appreciation supports a ~$35k cash-out refi (75% LTV) — recoverable capital for the next deal without selling this one.
Negotiation context
- It's been on market 151 days — a 12% lower offer ($290k) is reasonable based on typical stale-listing flexibility.
- 3 sale attempts; this cycle's ask has dropped $96k (23%) from the opening price — seller is motivated, your offer sets the floor, not the list.
Risks & watch-outs
- Watch-outs: HOA is 23% of rent.
- Climate carrying-cost: major flood risk; severe wind risk, 99% chance of damaging wind over 30y; extreme-heat days projected 7→30/yr by 2055 (HVAC capex compounding) — expect insurance premiums to compound above CPI over the hold.
Questions for the listing agent
- What do current leases actually rent for vs. the listed asking? Can we see a recent rent roll and the last 12 months of T-12 income?
- It's been on market 151 days. Have you received any prior offers? Is the seller open to a 23% concession, seller financing, or rate buy-down credit?
- What does the HOA fee cover, when was the last increase, and are there any pending special assessments or reserve-fund shortfalls?
- Any open or pending special assessments — roof, HVAC, plumbing, elevator, façade? What's the per-unit balance and payoff schedule, and is the seller paying it off at close or rolling it to the buyer?
- Why hasn't it sold? Are there any deal-killer items the seller is aware of (foundation, flood, title, zoning, code violations)?
- Is there a deadline driving the sale (1031 exchange, divorce, estate, relocation)? That informs how much negotiation room exists.
- The area grade is low — what's the realistic commute time and amenity access for the typical tenant pool here? Any planned neighborhood developments (good or bad) we should know about?
- What's the average days-on-market for RENTAL listings here right now (not sales)? A rising rental-DOM trend means longer vacancies and softer asking-rent achievability than the comps imply.
- What's the recent tenant-quality profile in this submarket — average credit score on applications, eviction rate, late-payment / NSF rate, and stable-employment percentage? A property-management company in the area should have these aggregated.
- How much new apartment / multifamily construction is in the pipeline within 1–3 miles? Heavy new supply (>2% of stock underway) typically softens rents 12–24 months out; light construction supports rent growth.
Investment metrics
- 1% rule
- 0.90% ✗
- Cap rate
- 4.71%
- Cash-on-cash
- -5.65%
- DSCR
- 0.75
- GRM
- 9.2
CMA / ARV
No comps found within radius.
Projected returns pro-forma
0.29% appreciation · 0.92% rent growth · sell at horizon
- IRR
- -8.8%
- Equity multiple
- 0.58×
- Total profit
- $-38,410
- Equity at exit
- $100,411
- IRR
- -4.4%
- Equity multiple
- 0.53×
- Total profit
- $-43,129
- Equity at exit
- $124,665
Cash invested: $92,120 (down + closing). Projections, not guarantees.
Landlord ↔ Tenant lean methodology
- Overall (STATE)
- 87 Strongly Landlord-Friendly
- State Florida
- 87 Strongly Landlord-Friendly · R+3
- County
- — inherits STATE
- City
- — inherits STATE
ZIP-level market 34109
- Home prices YoY
- 0.1%
- Rents YoY
- 0.9%
- Active inventory
- 425
- Price-to-rent
- 9.2×
Monthly cashflow live
- Estimated rent
- $2,965 high interval (Pro) →
- Mortgage (P&I)
- −$1,725
- Tax from tax record
- −$227 /mo · $2,728/yr
- Insurance
- −$137
- HOA
- −$687
- Vacancy / Maint / Mgmt
- −$623
- Net cashflow
- $-434
Break-even live
Sensitivity live
| Price | -10% $-248 | -5% $-341 | +0% $-434 | +5% $-527 | +10% $-620 |
|---|---|---|---|---|---|
| Rent | -10% $-668 | -5% $-551 | +0% $-434 | +5% $-317 | +10% $-200 |
| Rate | -1.0pp $-268 | -0.5pp $-350 | base $-434 | +0.5pp $-519 | +1.0pp $-606 |
UW: 25.0% down · 7.5% · 30yr · 1.5% tax · 5.0% vac · 8.0% maint · 8.0% mgmt
Financing live
Cash to close
- Down payment
- $82,250
- Closing costs
- $9,870
- Reserves months
- —
- Total cash needed
- —
Loan-product check · same deal, 3 products live
Conventional
25% down · 7.5% · 30yr
- Down + closing
- —
- Monthly P&I
- —
- Monthly cashflow
- —
- DSCR
- —
- Eligible?
- —
Personal DTI + credit; lowest rate.
DSCR
20% down · 8.5% · 30yr
- Down + closing
- —
- Monthly P&I
- —
- Monthly cashflow
- —
- DSCR
- —
- Eligible?
- —
No personal income docs; deal must DSCR.
Hard money
10% down · 12.0% · 12mo
- Down + closing
- —
- Monthly P&I
- —
- Monthly cashflow
- —
- DSCR
- —
- Eligible?
- —
Short-term bridge; refi at stabilization.
Rent comps 40 comps
| Address | Beds | Baths | Sqft | Rent | $/sqft | DOM | Units | Dist |
|---|---|---|---|---|---|---|---|---|
| 3268 Amanda Ln #3 Naples, FL | 3.0 | 2.5 | 1437 | $2,350 | $1.64 | 15d | 1 | 0.05mi |
| 3304 Lisa Ln Unit 102 Naples, FL | 2.0 | 2.5 | 1272 | $2,350 | $1.85 | 15d | 1 | 0.08mi |
| 3250 Cypress Glen Way Naples, FL | 2.0 | 2.0 | 1191 | $3,488 | $2.93 | 24d | 2 | 0.08mi |
| 3250 Cypress Glen Way Naples, FL | 2.0 | 2.0 | 1242 | $3,300 | $2.66 | 22d | 3 | 0.08mi |
| 3225 Cypress Glen Way #105 Naples, FL | 2.0 | 2.0 | 1191 | $2,900 | $2.43 | 24d | 1 | 0.12mi |
| 3255 Tamara Dr #4 Naples, FL | 3.0 | 2.5 | 1437 | $2,500 | $1.74 | 15d | 1 | 0.13mi |
| 5301 Summerwind Dr Naples, FL | 1.0–2.0 | 1.0–2.0 | 836 | $1,864 | $2.23 | 15d | 12 | 0.35mi |
| 3105 La Costa Cir Naples, FL | 1.0–3.0 | 1.0–2.0 | 1050 | $2,235 | $2.13 | 15d | 20 | 0.37mi |
| 12832 Brynwood Way Naples, FL | 3.0 | 2.0 | 1714 | $5,250 | $3.06 | 15d | 1 | 0.72mi |
| 12914 Brynwood Preserve Ln Naples, FL | 2.0 | 2.0 | 1720 | $7,000 | $4.07 | 24d | 1 | 0.74mi |
| 13466 Sumter Ln Naples, FL | 3.0 | 2.0 | 1837 | $8,700 | $4.74 | 24d | 1 | 0.80mi |
| 13441 Coronado Dr Naples, FL | 3.0 | 2.0 | 1837 | $10,000 | $5.44 | 24d | 1 | 0.82mi |
| 13435 Silktail Dr Naples, FL | 2.0 | 2.0 | 1837 | $8,950 | $4.87 | 24d | 1 | 0.85mi |
| 13423 Silktail Dr Naples, FL | 2.0 | 2.0 | 1831 | $2,200 | $1.20 | 24d | 1 | 0.86mi |
| 13379 Silktail Dr Naples, FL | 3.0 | 2.0 | 1837 | $4,400 | $2.40 | 24d | 1 | 0.91mi |
| 6654 Tannin Ln Unit B Naples, FL | 2.0 | 2.0 | 1441 | $3,100 | $2.15 | 24d | 1 | 0.92mi |
| 1860 Bald Eagle Dr Unit 403B Naples, FL | 2.0 | 2.0 | 1325 | $3,000 | $2.26 | 15d | 1 | 0.93mi |
| 2602 Fountain View Cir Naples, FL | 1.0–2.0 | 1.0–2.0 | 995 | $2,277 | $2.29 | 14d | 41 | 0.93mi |
| 1105 Reserve Ct #206 Naples, FL | 2.0 | 2.0 | 1100 | $2,000 | $1.82 | 15d | 1 | 0.96mi |
| 1105 Reserve Ct #307 Naples, FL | 3.0 | 2.0 | 1239 | $1,995 | $1.61 | 15d | 1 | 0.96mi |
| 1115 Reserve Ct Unit 2 Naples, FL | 2.0 | 2.0 | 1100 | $1,800 | $1.64 | 15d | 1 | 0.97mi |
| 1629 Spoonbill Ln Unit 1629-A Naples, FL | 2.0 | 2.0 | 1250 | $2,000 | $1.60 | 15d | 1 | 0.99mi |
| 1554 Oyster Catcher Pt Unit C Naples, FL | 2.0 | 2.0 | 1124 | $2,900 | $2.58 | 24d | 1 | 1.04mi |
| 1256 Carpazi Ct #502 Naples, FL | 3.0 | 2.0 | 1744 | $2,495 | $1.43 | 24d | 1 | 1.05mi |
| 1256 Carpazi Ct Unit 502 Naples, FL | 3.0 | 2.0 | 1744 | $2,495 | $1.43 | 15d | 1 | 1.05mi |
| 501 Forest Lakes Blvd #111 Naples, FL | 2.0 | 2.0 | 919 | $2,300 | $2.50 | 15d | 1 | 1.08mi |
| 1545 Oyster Catcher Pt Unit A Naples, FL | 2.0 | 2.0 | 1124 | $2,200 | $1.96 | 15d | 1 | 1.09mi |
| 1170 Reserve Way #205 Naples, FL | 2.0 | 1.0 | 894 | $1,700 | $1.90 | 24d | 1 | 1.15mi |
| 3308 Europa Dr #30 Naples, FL | 2.0 | 2.0 | 1205 | $5,500 | $4.56 | 24d | 1 | 1.16mi |
| 1180 Reserve Way Naples, FL | 1.0–2.0 | 1.0–2.0 | 912 | $1,990 | $2.18 | 15d | 3 | 1.16mi |
| 1180 Reserve Way Naples, FL | 1.0–2.0 | 1.0–2.0 | 954 | $2,000 | $2.10 | 24d | 2 | 1.16mi |
| 1205 Reserve Way #302 Naples, FL | 3.0 | 2.0 | 1239 | $2,300 | $1.86 | 15d | 1 | 1.17mi |
| 6941 Hunters Rd Naples, FL | 4.0 | 2.0 | 1866 | $7,500 | $4.02 | 24d | 1 | 1.19mi |
| 1235 Reserve Way #103 Naples, FL | 2.0 | 1.0 | 894 | $1,995 | $2.23 | 15d | 1 | 1.20mi |
| 1235 Reserve Way Naples, FL | 2.0 | 1.0 | 894 | $2,300 | $2.57 | 24d | 1 | 1.20mi |
| 499 Forest Lakes Blvd #105 Naples, FL | 2.0 | 2.0 | 919 | $1,950 | $2.12 | 15d | 1 | 1.20mi |
| 1350 Misty Pines Cir Unit E-204 Naples, FL | 2.0 | 2.0 | 1200 | $7,500 | $6.25 | 15d | 1 | 1.20mi |
| 1220 Reserve Way #305 Naples, FL | 2.0 | 2.0 | 1059 | $1,950 | $1.84 | 24d | 1 | 1.21mi |
| 1190 Reserve Way #304 Naples, FL | 2.0 | 2.0 | 1059 | $2,900 | $2.74 | 24d | 1 | 1.21mi |
| 1299 Verde Dr Unit 1503 Naples, FL | 3.0 | 2.0 | 1744 | $4,200 | $2.41 | 15d | 1 | 1.23mi |
HOA detail condo
- Monthly dues
- $687 · $8,244/yr
- Likely covers
- waterpool
- Assessments
- None detected in remarks — confirm with the listing agent.
Listing history 14 events
-
2026-06-21days on market $329,000 Active 151 DOM
-
2026-06-18days on market $329,000 Active 148 DOM
-
2026-06-17days on market $329,000 Active 147 DOM
-
2026-06-16pricedays on market $329,000 Active 146 DOM
-
2026-06-15days on market $344,000 Active 145 DOM
-
2026-06-14remarks 673-char remark
-
2026-06-14days on market $344,000 Active 143 DOM
-
2026-06-10days on market $344,000 Active 140 DOM
-
2026-06-09days on market $344,000 Active 139 DOM
-
2026-06-08days on market $344,000 Active 138 DOM
-
2026-06-07days on market $344,000 Active 137 DOM
-
2026-06-03days on market $344,000 Active 133 DOM
-
2026-06-03remarks 664-char remark
-
2026-06-03$344,000 Active 132 DOM
ⓘ Source: listings_history table (triggers on properties + properties_extension) + one-shot
backfill from property_details.listing_events for pre-trigger history.
Tax reassessment forecast FL · Resets to sale price
- Current annual tax
- $2,728 · $227/mo
- Projected year-2 tax
- $2,731 · $228/mo
- Expected delta
- +$2/yr ($0/mo · 0.1%)
ⓘ Screening estimate from a state-policy table — verify with the county assessor before closing.
Climate risk First Street
- Flood 6/10 Major FEMA zone X (unshaded) · 72% chance over 30 yrs
- Wildfire 1/10 Low
- Heat 10/10 Extreme 7 d/yr ≥107°F today · 30 d/yr by 30 yrs out
- Wind 10/10 Extreme 99% chance of damaging wind over 30 yrs
- Air quality 2/10 Low 2 unhealthy d/yr today · 2 by 30 yrs out
Nearby sold comps map
Loading sold comps map…
Walkable amenities ~0.75 mi
Loading nearby amenities…
Taxation est. · year 1
- Rental income
- $35,585
- − Mortgage interest
- −$18,429
- − Property taxes
- −$2,728
- − Insurance
- −$1,645
- − Repairs & maintenance
- −$2,847
- − Management
- −$2,847
- − HOA
- −$8,244
- − Depreciation
- −$9,571
- Taxable loss
- −$10,726
- Est. tax savings @ 24.0%
- +$2,574
- After-tax cash flow
- $-2,635/yr
For passive investors: Depreciation is non-cash, so a rental often shows a tax loss while cash-flowing — sheltering income. Rental losses are passive: they offset passive income freely, and up to $25,000/yr can offset ordinary (W-2) income if you actively participate and your MAGI is under $100k (phasing out to $0 by $150k); unused losses carry forward. On sale, claimed depreciation is recaptured at up to 25%, and gains may owe capital-gains tax (a 1031 exchange can defer both). Figures are a year-1 estimate at your 24.0% rate — not tax advice; consult a CPA.
Schools (NCES district)
- District
- Collier
- NCES district ID
- 1200330
- Math proficiency
- 60% ▼ -4.00%
- Reading proficiency
- 56% ▼ -2.00%
- Median HH income
- $58,275
- Composite
- 50.23/100
- National rank
- #1892
- State rank
- #16 of 73 in FL
Livability — Vineyards
- Score
- 64/100
- State rank
- #679
- US rank
- #14101
Category grades
Schools grade is shown separately in the Schools card above.
Census & demographics
- County
- Collier County · 396,295 people
- Metro
- Naples-Marco Island, FL
- Population (ZIP)
- 27,273
- Household income
- $92,259
- Rent vs Own
- Severe rent burden
- 1712.0
Population outlook (Collier County) Hauer SSP2
- Today (2025)
- 420,858 people
- By 2030
- 450,054 · +6.9%
- By 2040
- 502,232 · +19.3%
- By 2050
- 544,932 · +29.5%
- By 2075
- 627,203 · +49.0%
- By 2100
- 659,015 · +56.6%
Race, ethnicity, and origin ACS 2023
- Neighborhood character
- Predominantly White (78%)
- Race & ethnicity
- White 78% Hispanic / Latino 11% Two or more races 9% Black 4% Asian 4%
- Hispanic origin (detail)
- Mexican 1% Puerto Rican 1% Cuban 3%
- Common ancestry
- Romanian 5% Scotch-Irish 3% Lithuanian 2%
- Foreign-born
- 20% · Canada, Jamaica, Vietnam
- Languages at home
- 77% English-only · Spanish 10% Other Indo-European 5% Russian/Polish/Slavic 3%
Political lean MEDSL · Collier
- 2024 margin
- Solid R (+33.1) · D 33.1% · R 66.2%
- 2008→2024 swing
- -10.6pp toward R · 2008: -22.5pp · 2024: -33.1pp
- All cycles
- 2024: R+33.1 2020: R+24.7 2016: R+26.0 2012: R+30.1 2008: R+22.5
Not yet ingested
- Civics
- —
Market trends
- HPI YoY
- ▲ 0.29%
- Current HPI
- 279.357
- Rent YoY
- ▲ 0.92%
- Metro
- Naples-Marco Island, FL
- State GDP YoY
- ▲ 3.28%
- F500 in state
- 36
Industry mix (Fortune 500 HQ in FL)
| Industry | F500 HQs | Revenue |
|---|---|---|
| Industrial Technology | 2 | $29B |
|
||
| Insurance | 2 | $17B |
|
||
| Retail | 1 | $60B |
|
||
| Technology Distribution | 1 | $58B |
|
||
| Homebuilding | 1 | $35B |
|
||
| Technology Manufacturing | 1 | $35B |
|
||
Price history
+5.8% since first listed11 events — show timeline
- 2026-05-22 Price Changed $344,000 NAPLESMLS
- 2026-03-23 Price Changed $349,000 NAPLESMLS
- 2026-03-10 Price Changed $369,000 NAPLESMLS
- 2026-03-02 Price Changed $389,250 NAPLESMLS
- 2026-02-13 Price Changed $399,000 NAPLESMLS
- 2026-01-21 Listed $425,000 NAPLESMLS
- 2026-01-20 Rental Removed $2,500 FGCMLS
- 2026-01-08 Listed for Rent $2,500 FGCMLS
- 2026-01-08 Rental Removed $2,500 NAPLESMLS
- 2025-11-18 Listed for Rent $2,500 NAPLESMLS
- 2006-03-15 Sold (Public Records) $325,000 Public Records
Property tax history
+15.1%/yrLatest (2025): $2,728 · +1.0% YoY. Source: county tax records.
Cash-flow waterfall
monthlySold comps — $/sqft
last 12 mo · ≤1 miLoading sold comps…