 🏷️ Likely Rental
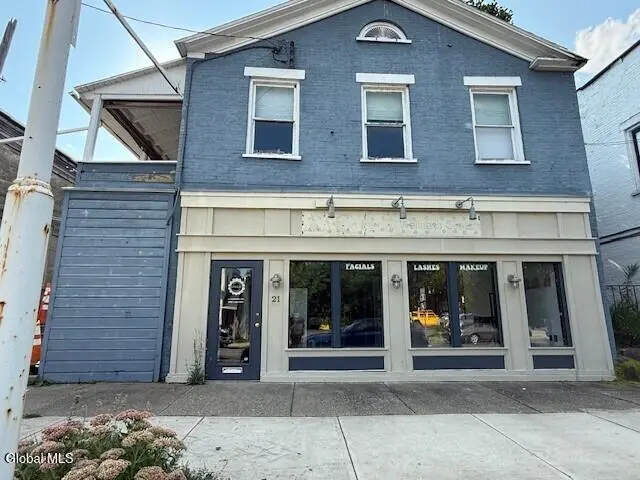
21 Broad St · Schuylerville, NY
Flood risk No data
- FEMA flood zone
- —
- Chance of flooding over 30 yrs
- —
- Est. flood insurance / yr
- —
Fire risk No data
- Est. fire insurance / yr
- —
Heat risk No data
- Hot days now (above threshold)
- —
- Hot days in 30 yrs
- —
Wind risk No data
- Chance of severe wind over 30 yrs
- —
Air-quality risk No data
- Unhealthy air days now
- —
- Unhealthy air days in 30 yrs
- —
Risk factors via First Street. Map © Google.
Why this score? — see what drove the B grade
The composite is a weighted blend of 9 inputs, each scored 0–100. Each bar is that input's sub-score; the figure is the points it added to the 100-point composite (weight × sub-score).
- Cash flow +19.7/30.0
- ARV discount +15.0/15.0
- Appreciation +10.0/10.0
- DSCR +6.2/10.0
- Schools +5.4/10.0
- 1% rule +5.2/10.0
- Livability +3.9/5.0
- Condition / age +3.8/5.0
- Rent growth +2.5/5.0
$320,000
🖨 Deal sheet (PDF) 📄 Offer letter ✓ Due diligence
Multi-family units
County records classify this as Multi-Family (2-4 Unit). Listing-text estimate: 1 unit. estimate disagrees with records
Listing remarks MLS
Don't miss this excellent investment opportunity! This well-maintained mixed-use building offers both commercial and residential income streams in one of the area's most desirable location in the Village of Schuylerville. GROUND FLOOR - Retail Space is approximately 706 sq. ft and features large display windows, high foot traffic visibility, and an open layout suitable for a wide variety of businesses. Ideal for owner-operators or to lease to new tenants. Currently for Rent for $1100/month. SECOND FLOOR - Residential Units: The upper level includes two fully rented apartments, each with private entrances. Tenants are on annual leases, providing immediate rental income. Zoned for commercial/residential use. Separate utility meters for each unit.
Key facts
- Mixed-use building
- Open layout
- 6,098 sq ft lot
Tags
Neighborhood map
What this means for you Summary
Snapshot
- This is a 5-bed/2.5-bath multifamily listed at $320k. Condition is rated good.
Deal economics
- At list price, monthly cash flow is $377 ($5k/yr) — positive.
- The deal already cash-flows at list — no discount required.
- Meets the 1% rule at list price ($3k rent vs $320k).
- Recommended offer: $282k (12.0% below list) — sets the bar for market timing.
Location & tenants
- Location reads 77/100 on livability (#186 in NY, #2,863 nationally) — a middle-class / working-renter tenant base. Strengths: housing A+, health & safety A+, crime A; Watch: amenities D, commute F.
- Schuylerville Central School District (rural): math 58% / reading 64% proficiency, ranked #201 of 590 in NY (top 34%) — acceptable for families but not a draw, mixed tenant base, ~2y average lease; only 19% free/reduced lunch — higher-income household profile.
- Zoned schools: Schuylerville Elementary School (math 60% / reading 66%, grade B, #669 of 2,108 statewide, top 32%, 597 students, 36% FRL); Schuylerville Middle School (math 42% / reading 63%, grade C+, #235 of 729 statewide, top 33%, 290 students, 28% FRL); Schuylerville High School (math 92% / reading 70%, grade A, #495 of 1,100 statewide, top 46%, 482 students, 29% FRL).
- Market conditions: 32 active listings in the ZIP; 1,132 units permitted in Saratoga County in 2024 (378 in 5+ unit buildings).
Forward outlook
- In year one you build about $34k of equity ($2k loan paydown + $32k appreciation (10.0% local appreciation)).
- Saratoga County population projected at +4% by 2050 — modest demand growth; plan on rents tracking national, not racing it.
- At projected returns (10.0% appreciation + 3.0% rent growth), your $90k cash investment doubles in ~3 years — after that, you're playing with house money.
- By year 2, paydown + projected appreciation supports a ~$55k cash-out refi (75% LTV) — recoverable capital for the next deal without selling this one.
Negotiation context
- It's been on market 139 days — a 12% lower offer ($282k) is reasonable based on typical stale-listing flexibility.
- 2 sale attempts with the ask held roughly flat each time — persistent listings suggest the price (not the market) is what's stuck; bring a comps-based counter.
Questions for the listing agent
- It's been on market 139 days. Have you received any prior offers? Is the seller open to a 12% concession, seller financing, or rate buy-down credit?
- Built in 1960 — when were the roof, HVAC, electrical panel, plumbing, and water heater last replaced?
- Why hasn't it sold? Are there any deal-killer items the seller is aware of (foundation, flood, title, zoning, code violations)?
- Is there a deadline driving the sale (1031 exchange, divorce, estate, relocation)? That informs how much negotiation room exists.
- Schools are B-rated — typically a magnet for longer-tenancy family renters. What's the average tenant stay here, and is there a school-zone premium baked into asking?
- What's the average days-on-market for RENTAL listings here right now (not sales)? A rising rental-DOM trend means longer vacancies and softer asking-rent achievability than the comps imply.
- What's the recent tenant-quality profile in this submarket — average credit score on applications, eviction rate, late-payment / NSF rate, and stable-employment percentage? A property-management company in the area should have these aggregated.
- How much new apartment / multifamily construction is in the pipeline within 1–3 miles? Heavy new supply (>2% of stock underway) typically softens rents 12–24 months out; light construction supports rent growth.
Investment metrics
- 1% rule
- 1.02% ✓
- Cap rate
- 7.71%
- Cash-on-cash
- 5.05%
- DSCR
- 1.22
- GRM
- 8.1
CMA / ARV
- ARV (median comp)
- $626,753
- List price
- $320,000
- Delta
- -48.94%
- Verdict
- UNDERPRICED
- Comps
- 7 within 1.0 mi
Projected returns pro-forma
10.0% appreciation · 3.0% rent growth · sell at horizon
- IRR
- 27.9%
- Equity multiple
- 3.21×
- Total profit
- $198,366
- Equity at exit
- $288,281
- IRR
- 24.4%
- Equity multiple
- 7.31×
- Total profit
- $565,351
- Equity at exit
- $621,690
Cash invested: $89,600 (down + closing). Projections, not guarantees.
Landlord ↔ Tenant lean methodology
- Overall (STATE)
- 15 Strongly Tenant-Friendly
- State New York
- 15 Strongly Tenant-Friendly · D+10
- County
- — inherits STATE
- City
- — inherits STATE
ZIP-level market 12871
- Home prices YoY
- 4.0%
- Active inventory
- 32
- Price-to-rent
- 16.3×
Monthly cashflow live
- Estimated rent
- $3,277 medium interval (Pro) →
- Mortgage (P&I)
- −$1,678
- Tax est. 1.5%
- −$400 /mo · $4,800/yr
- Insurance
- −$133
- HOA
- −$0
- Vacancy / Maint / Mgmt
- −$688
- Net cashflow
- $377
Break-even live
Sensitivity live
| Price | -10% $599 | -5% $488 | +0% $377 | +5% $267 | +10% $156 |
|---|---|---|---|---|---|
| Rent | -10% $118 | -5% $248 | +0% $377 | +5% $507 | +10% $636 |
| Rate | -1.0pp $539 | -0.5pp $459 | base $377 | +0.5pp $294 | +1.0pp $210 |
2-unit breakdown (identical units grouped — click to expand)
| Units | Beds | Baths | Est. rent |
|---|---|---|---|
| 2× units | 2 | 1 | $3,278 |
| #1 | 2 | 1 | $1,639 |
| #2 | 2 | 1 | $1,639 |
| Total (2 units) | $3,277 | ||
UW: 25.0% down · 7.5% · 30yr · 1.5% tax · 5.0% vac · 8.0% maint · 8.0% mgmt
Financing live
Cash to close
- Down payment
- $80,000
- Closing costs
- $9,600
- Reserves months
- —
- Total cash needed
- —
Loan-product check · same deal, 3 products live
Conventional
25% down · 7.5% · 30yr
- Down + closing
- —
- Monthly P&I
- —
- Monthly cashflow
- —
- DSCR
- —
- Eligible?
- —
Personal DTI + credit; lowest rate.
DSCR
20% down · 8.5% · 30yr
- Down + closing
- —
- Monthly P&I
- —
- Monthly cashflow
- —
- DSCR
- —
- Eligible?
- —
No personal income docs; deal must DSCR.
Hard money
10% down · 12.0% · 12mo
- Down + closing
- —
- Monthly P&I
- —
- Monthly cashflow
- —
- DSCR
- —
- Eligible?
- —
Short-term bridge; refi at stabilization.
Listing history 19 events
-
2026-06-21days on market $320,000 Active 139 DOM
-
2026-06-18days on market $320,000 Active 136 DOM
-
2026-06-17days on market $320,000 Active 135 DOM
-
2026-06-16days on market $320,000 Active 134 DOM
-
2026-06-15days on market $320,000 Active 133 DOM
-
2026-06-14days on market $320,000 Active 131 DOM
-
2026-06-10days on market $320,000 Active 128 DOM
-
2026-06-09days on market $320,000 Active 127 DOM
-
2026-06-08days on market $320,000 Active 126 DOM
-
2026-06-07days on market $320,000 Active 125 DOM
-
2026-06-05days on market $320,000 Active 122 DOM
-
2026-06-03days on market $320,000 Active 121 DOM
-
2026-06-02days on market $320,000 Active 120 DOM
-
2026-06-01days on market $320,000 Active 119 DOM
-
2026-05-31days on market $320,000 Active 118 DOM
-
2026-05-31days on market $320,000 Active 117 DOM
-
2026-02-02$320,000 Active 769-char remark
Show marketing remark (769 chars)
Don't miss this excellent investment opportunity! This well-maintained mixed-use building offers both commercial and residential income streams in one of the area's most desirable location in the Village of Schuylerville. GROUND FLOOR - Retail Space is approximately 706 sq. ft and features large display windows, high foot traffic visibility, and an open layout suitable for a wide variety of businesses. Ideal for owner-operators or to lease to new tenants. Currently for Rent for $1100/month. SECOND FLOOR - Residential Units: The upper level includes two fully rented apartments, each with private entrances. Tenants are on annual leases, providing immediate rental income. Zoned for commercial/residential use. Separate utility meters for each unit.
-
2026-01-25historical
-
2025-08-06$340,000 Active
ⓘ Source: listings_history table (triggers on properties + properties_extension) + one-shot
backfill from property_details.listing_events for pre-trigger history.
Nearby sold comps map
Loading sold comps map…
Walkable amenities ~0.75 mi
Loading nearby amenities…
Taxation est. · year 1
- Rental income
- $39,324
- − Mortgage interest
- −$17,925
- − Property taxes
- −$4,800
- − Insurance
- −$1,600
- − Repairs & maintenance
- −$3,146
- − Management
- −$3,146
- − Depreciation
- −$9,309
- Taxable loss
- −$602
- Est. tax savings @ 24.0%
- +$144
- After-tax cash flow
- $4,673/yr
For passive investors: Depreciation is non-cash, so a rental often shows a tax loss while cash-flowing — sheltering income. Rental losses are passive: they offset passive income freely, and up to $25,000/yr can offset ordinary (W-2) income if you actively participate and your MAGI is under $100k (phasing out to $0 by $150k); unused losses carry forward. On sale, claimed depreciation is recaptured at up to 25%, and gains may owe capital-gains tax (a 1031 exchange can defer both). Figures are a year-1 estimate at your 24.0% rate — not tax advice; consult a CPA.
Condition & rehab AI · 13 photos
This well-maintained mixed-use building offers both commercial and residential income streams. The property is in good condition with minor repairs and maintenance needed, and updates to the kitchen and landscaping can significantly increase its value.
Repairs flagged
- Minor Paint — The kitchen and possibly other areas may benefit from a fresh coat of paint.
- Minor Landscaping — The landscaping could be updated to enhance curb appeal and attract tenants or buyers.
- Minor Appliances — The countertops and cabinets may benefit from a fresh coat of paint to improve the overall appearance of the kitchen.
Value-add opportunities
- Both Paint the kitchen cabinets and countertops — Fresh paint can improve the appearance and value of the property.
- Both Update the landscaping — Enhanced landscaping can improve curb appeal and attract potential tenants or buyers.
- Rental Inspect and clean the HVAC system — A clean and functioning HVAC system is essential for tenant satisfaction and can prevent costly repairs in the future.
Renovation cost estimate screening
| Repair item | Severity | Est. cost |
|---|---|---|
| Paint · The kitchen and possibly other areas may benefit from a fresh coat of paint. | Minor | $500–3,000 |
| Landscaping · The landscaping could be updated to enhance curb appeal and attract tenants or buyers. | Minor | $500–3,000 |
| Appliances · The countertops and cabinets may benefit from a fresh coat of paint to improve the overall appearance of the kitchen. | Minor | $500–3,000 |
| Total estimated repair cost · 3 items | $1,500–9,000 |
Value-add ROI direction
- Both Paint the kitchen cabinets and countertops — Fresh paint can improve the appearance and value of the property. ↑
- Both Update the landscaping — Enhanced landscaping can improve curb appeal and attract potential tenants or buyers. ↑
- Rental Inspect and clean the HVAC system — A clean and functioning HVAC system is essential for tenant satisfaction and can prevent costly repairs in the future. ↑
ⓘ Cost ranges are severity-bucket heuristics (US national rule-of-thumb). Get contractor quotes + a written scope before underwriting a rehab budget.
Schools (NCES district)
- District
- Schuylerville Central School District
- NCES district ID
- 3626160
- Math proficiency
- 58% ▼ -8.00%
- Reading proficiency
- 64% ▲ 6.00%
- Median HH income
- $69,011
- Composite
- 53.71/100
- National rank
- #1423
- State rank
- #201 of 590 in NY
Livability — Schuylerville
- Score
- 77/100
- State rank
- #186
- US rank
- #2863
Category grades
Schools grade is shown separately in the Schools card above.
Census & demographics
- Census place
- Schuylerville, NY
- Population (ZIP)
- 3,997
Population outlook (Saratoga County) Hauer SSP2
- Today (2025)
- 238,889 people
- By 2030
- 243,681 · +2.0%
- By 2040
- 249,118 · +4.3%
- By 2050
- 248,638 · +4.1%
- By 2075
- 241,675 · +1.2%
- By 2100
- 213,150 · -10.8%
Race, ethnicity, and origin ACS 2023
- Neighborhood character
- Predominantly White (91%)
- Race & ethnicity
- White 91% Hispanic / Latino 5% Two or more races 3%
- Common ancestry
- Romanian 9% Lithuanian 9% Slovak 4%
- Foreign-born
- 4% · Canada
- Languages at home
- 95% English-only · Spanish 4%
Political lean MEDSL · Saratoga
- 2024 margin
- Toss-up / Even · D 50.9% · R 49.1%
- 2008→2024 swing
- -1.6pp toward R · 2008: 3.4pp · 2024: 1.8pp
- All cycles
- 2024: D+1.8 2020: D+5.4 2016: R+4.4 2012: D+2.1 2008: D+3.4
Not yet ingested
- Civics
- —
Market trends
- HPI YoY
- ▲ 12.21%
- Current HPI
- 320.1965
- Rent YoY
- —
- Metro
- —
- State GDP YoY
- ▲ 2.60%
- F500 in state
- 92
Industry mix (Fortune 500 HQ in NY)
| Industry | F500 HQs | Revenue |
|---|---|---|
| Financial Services | 10 | $950B |
|
||
| Consumer Goods | 9 | $162B |
|
||
| Insurance | 4 | $225B |
|
||
| Telecommunications | 2 | $144B |
|
||
| Pharmaceuticals | 2 | $112B |
|
||
| Media / Entertainment | 2 | $69B |
|
||
Price history
-5.9% since first listed3 events — show timeline
- 2026-02-02 Listed $320,000 Global MLS
- 2026-01-25 Listing Removed — Global MLS
- 2025-08-06 Listed $340,000 Global MLS
Cash-flow waterfall
monthlySold comps — $/sqft
last 12 mo · ≤1 miLoading sold comps…