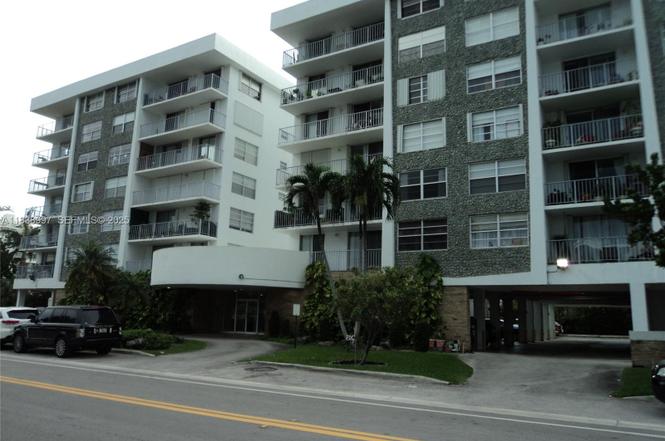
1050 93rd St Unit 6F · Bay Harbor Islands, FL
Flood risk 9/10 · Severe
- FEMA flood zone
- AE
- Chance of flooding over 30 yrs
- 0.99%
- Est. flood insurance / yr
- $1,737 – $8,500
Fire risk 1/10 · Minimal
- Est. fire insurance / yr
- $947 – $1,759
Heat risk 10/10 · Severe
- Hot days now (above 103°F)
- 7 days/yr
- Hot days in 30 yrs
- 30 days/yr
Wind risk 10/10 · Severe
- Chance of severe wind over 30 yrs
- 99.0%
Air-quality risk 2/10 · Minimal
- Unhealthy air days now
- 1 days/yr
- Unhealthy air days in 30 yrs
- 2 days/yr
Risk factors via First Street. Map © Google.
Why this score? — see what drove the C- grade
The composite is a weighted blend of 9 inputs, each scored 0–100. Each bar is that input's sub-score; the figure is the points it added to the 100-point composite (weight × sub-score).
- Cash flow +12.1/30.0
- Appreciation +8.1/10.0
- ARV discount +7.5/15.0
- 1% rule +5.8/10.0
- Livability +4.3/5.0
- Schools +4.2/10.0
- DSCR +3.6/10.0
- Condition / age +2.5/5.0
- Rent growth +2.2/5.0
$415,000
🖨 Deal sheet (PDF) 📄 Offer letter ✓ Due diligence
Listing remarks
UPDATED 2/2 IN VERY GOOD CONDITION PRESTIGIOUS BAY HARBOR ISLANDS, RENOVATED KITCHEN & EAT-IN, PARKING FOR SECOND VEHICLES, IMPACT WINDOWS OR SHUTTERS ON ALL WINDOWS, BIG TERRACE, EXERCISE ROOM, ACTIVITIES ROOM. BIG LIVING ROOM, BIG MASTER ROOM & BIG CLOSETS, APT 1,230 SQFT, PORCELAIN TILES (ONLY LIKE A YEAR OLD), APT HAS AN ASSESMENT, CABLE & INTERNET INCLUDED IN MAINTENANCE. High-ranking Ruth Broad K-8 School. Buy Now , prices will go up because of the construction in the area. Call & TEXT Listing Agent for showing instructions. Price can negotiable. Equal Housing Opportunity!
Key facts
- Exercise room
- Activities room
- Renovated kitchen
Tags
Property features AI
Finance
- Financial info: Pets allowed with restrictions or conditions
- HOA & community: Monthly association fee of $850; Association covers cable TV, hot water, insurance, laundry, building maintenance, parking, pest control, pool(s), trash and water; Community amenities: clubhouse, laundry facilities, elevators; 54 units in the community
Exterior
- Parking: Attached carport; One covered space; Two or more parking spaces total
- Security: Intercom; Smoke detectors
- Utilities: Cable available
- Home design: Condo in a 7-story building; Unit entry on level 6; Faces north; Updated/remodeled; Attached property
- Construction: Block construction; Resale unit
- Exterior features: Balcony (open); Storm/security shutters
Interior
- Kitchen: Dishwasher; Electric range; Refrigerator; Eat-in kitchen layout
- Bedrooms: Bedroom (14 x 11); Second bedroom (18 x 12)
- Bathrooms: 2 full bathrooms
- Interior features: Impact glass windows; Entrance foyer; Eat-in kitchen; Combined living/dining area; Elevator access; Bedroom on main level
- Laundry & utility: Common area laundry; Utility room
Neighborhood map
What this means for you Summary
Snapshot
- This is a 2-bed/2.0-bath condo listed at $415k.
Deal economics
- At list price, monthly cash flow is $-514 ($-6k/yr) — negative.
- To cash-flow at today's rent, offer at most $324k (21.9% below list).
- Meets the 1% rule at list price ($4k rent vs $415k).
- Recommended offer: $324k (21.9% below list) — sets the bar for cash-flow.
Location & tenants
- Location reads 86/100 on livability (#13 in FL, #362 nationally) — a professional / high-income tenant draw. Strengths: crime A+, commute A+, employment A+; Watch: amenities F, cost of living F.
- Miami-Dade (suburban): math 45% / reading 54% proficiency, ranked #40 of 73 in FL (top 55%) — families likely to look elsewhere, expect single-tenant / working-renter base with shorter leases; 64% free/reduced lunch — lower-income household profile, screen leases tightly.
- Zoned schools: Ruth K. Broad Bay Harbor K-8 Center (math 76% / reading 76%, grade A, #198 of 2,144 statewide, top 10%, 1,249 students, 29% FRL); Miami Beach Nautilus Middle School (math 46% / reading 58%, grade C+, #217 of 571 statewide, top 40%, 918 students, 44% FRL); Miami Beach Senior High School (math 21% / reading 48%, grade F, #386 of 667 statewide, top 59%, 2,175 students, 40% FRL) — zoned schools average 38% FRL vs 64% district-wide (26 pts lower); this property's tenant base skews higher-income than the district average.
- Market conditions: Rents soft (-1.3%/yr); 523 active listings in the ZIP; 4 comparable units currently listed for rent nearby; rentals at typical pace (median 26d on market — plan ~3-4 weeks tenant-placement turnaround); solid renter incomes; 10,051 units permitted in Miami-Dade County in 2024 (7,758 in 5+ unit buildings).
- At $4,473/mo this rent would consume 60% of the median local household income ($90k/yr) (locally 774% of renters already pay >50% of income on rent) — very limited rent-growth headroom before tenants either downsize or default.
Forward outlook
- In year one you build about $28k of equity ($3k loan paydown + $25k appreciation (6.1% local appreciation)).
- Miami-Dade County population projected at +28% by 2050 — long-run rental-demand tailwind backs the buy-and-hold thesis.
- By year 2, paydown + projected appreciation supports a ~$45k cash-out refi (75% LTV) — recoverable capital for the next deal without selling this one.
Negotiation context
- It's been on market 298 days — a 12% lower offer ($365k) is reasonable based on typical stale-listing flexibility.
- 3 sale attempts since 3y ago; this cycle's ask has dropped $25k (6%) from the opening price — seller is motivated, your offer sets the floor, not the list.
- Current owner paid $90k; list at $415k implies a 361% gain — meaningful room to come down on a strong offer.
Risks & watch-outs
- Watch-outs: flood insurance adds $427/mo.
- Climate carrying-cost: in FEMA flood zone AE (mandatory federal flood insurance); severe wind risk, 99% chance of damaging wind over 30y; extreme-heat days projected 7→30/yr by 2055 (HVAC capex compounding) — expect insurance premiums to compound above CPI over the hold.
Questions for the listing agent
- What do current leases actually rent for vs. the listed asking? Can we see a recent rent roll and the last 12 months of T-12 income?
- It's been on market 298 days. Have you received any prior offers? Is the seller open to a 22% concession, seller financing, or rate buy-down credit?
- Built in 1973 — when were the roof, HVAC, electrical panel, plumbing, and water heater last replaced?
- What's the actual annual flood-insurance premium (NFIP or private), and is the property in a SFHA with mandatory coverage?
- What does the HOA fee cover, when was the last increase, and are there any pending special assessments or reserve-fund shortfalls?
- Any open or pending special assessments — roof, HVAC, plumbing, elevator, façade? What's the per-unit balance and payoff schedule, and is the seller paying it off at close or rolling it to the buyer?
- Why hasn't it sold? Are there any deal-killer items the seller is aware of (foundation, flood, title, zoning, code violations)?
- Is there a deadline driving the sale (1031 exchange, divorce, estate, relocation)? That informs how much negotiation room exists.
- Schools are A-rated — typically a magnet for longer-tenancy family renters. What's the average tenant stay here, and is there a school-zone premium baked into asking?
- What's the average days-on-market for RENTAL listings here right now (not sales)? A rising rental-DOM trend means longer vacancies and softer asking-rent achievability than the comps imply.
- What's the recent tenant-quality profile in this submarket — average credit score on applications, eviction rate, late-payment / NSF rate, and stable-employment percentage? A property-management company in the area should have these aggregated.
- How much new apartment / multifamily construction is in the pipeline within 1–3 miles? Heavy new supply (>2% of stock underway) typically softens rents 12–24 months out; light construction supports rent growth.
Investment metrics
- 1% rule
- 1.08% ✓
- Cap rate
- 6.04%
- Cash-on-cash
- -0.91%
- DSCR
- 0.96
- GRM
- 7.7
CMA / ARV
No comps found within radius.
Projected returns pro-forma
6.12% appreciation · 0.0% rent growth · sell at horizon
- IRR
- 9.9%
- Equity multiple
- 1.67×
- Total profit
- $77,809
- Equity at exit
- $264,146
- IRR
- 10.0%
- Equity multiple
- 2.99×
- Total profit
- $231,782
- Equity at exit
- $481,856
Cash invested: $116,200 (down + closing). Projections, not guarantees.
Landlord ↔ Tenant lean methodology
- Overall (STATE)
- 87 Strongly Landlord-Friendly
- State Florida
- 87 Strongly Landlord-Friendly · R+3
- County
- — inherits STATE
- City
- — inherits STATE
ZIP-level market 33154
- Home prices YoY
- 1.4%
- Rents YoY
- -1.3%
- Active inventory
- 523
- Price-to-rent
- 7.7×
Monthly cashflow live
- Estimated rent
- $4,473 medium interval (Pro) →
- Mortgage (P&I)
- −$2,176
- Tax from tax record
- −$422 /mo · $5,070/yr
- Insurance
- −$173
- Flood insurance flood zone
- −$427 /mo · $5,118/yr
- HOA
- −$850
- Vacancy / Maint / Mgmt
- −$939
- Net cashflow
- $-514
Break-even live
Sensitivity live
| Price | -10% $-279 | -5% $-397 | +0% $-514 | +5% $-632 | +10% $-749 |
|---|---|---|---|---|---|
| Rent | -10% $-868 | -5% $-691 | +0% $-514 | +5% $-338 | +10% $-161 |
| Rate | -1.0pp $-305 | -0.5pp $-409 | base $-514 | +0.5pp $-622 | +1.0pp $-731 |
UW: 25.0% down · 7.5% · 30yr · 1.5% tax · 5.0% vac · 8.0% maint · 8.0% mgmt
Financing live
Cash to close
- Down payment
- $103,750
- Closing costs
- $12,450
- Reserves months
- —
- Total cash needed
- —
Loan-product check · same deal, 3 products live
Conventional
25% down · 7.5% · 30yr
- Down + closing
- —
- Monthly P&I
- —
- Monthly cashflow
- —
- DSCR
- —
- Eligible?
- —
Personal DTI + credit; lowest rate.
DSCR
20% down · 8.5% · 30yr
- Down + closing
- —
- Monthly P&I
- —
- Monthly cashflow
- —
- DSCR
- —
- Eligible?
- —
No personal income docs; deal must DSCR.
Hard money
10% down · 12.0% · 12mo
- Down + closing
- —
- Monthly P&I
- —
- Monthly cashflow
- —
- DSCR
- —
- Eligible?
- —
Short-term bridge; refi at stabilization.
Rent comps 4 comps
| Address | Beds | Baths | Sqft | Rent | $/sqft | DOM | Units | Dist |
|---|---|---|---|---|---|---|---|---|
| 9703 Collins Ave Bal Harbour, FL | 1.0–2.0 | 1.0–2.0 | 1401 | $26,000 | $18.56 | 26d | 2 | 0.57mi |
| 9703 Collins Ave #1006 Bal Harbour, FL | 1.0 | 1.0 | 1261 | $26,000 | $20.62 | 23d | 1 | 0.57mi |
| 8701 Collins Ave #304 Surfside, FL | 2.0 | 2.5 | 1457 | $25,000 | $17.16 | 26d | 1 | 0.96mi |
| 10295 Collins Ave #1613 Bal Harbour, FL | 1.0 | 1.5 | 1147 | $27,500 | $23.98 | 26d | 1 | 1.11mi |
HOA detail condo
- Monthly dues
- $850 · $10,200/yr
- Likely covers
- internetcable
- Assessments
- None detected in remarks — confirm with the listing agent.
Listing history 12 events
-
2026-05-05status Pending
-
2026-01-16price $415,000
-
2025-12-19status Active
-
2025-12-19historical
-
2025-07-11$440,000 Active
-
2023-08-29historical $2,700
-
2023-08-24historical
-
2023-07-17price $439,000
-
2023-07-17price $2,700
-
2023-06-30$449,000 Active
-
1999-12-01soldstatus $90,000
-
1973-06-01soldstatus $47,000
ⓘ Source: listings_history table (triggers on properties + properties_extension) + one-shot
backfill from property_details.listing_events for pre-trigger history.
Tax reassessment forecast FL · Resets to sale price
- Current annual tax
- $5,070 · $422/mo
- Projected year-2 tax
- $5,070 · $422/mo
- Expected delta
- $0/yr ($0/mo · 0.0%)
ⓘ Screening estimate from a state-policy table — verify with the county assessor before closing.
Climate risk First Street
- Flood 9/10 Extreme FEMA zone AE · 99% chance over 30 yrs
- Wildfire 1/10 Low
- Heat 10/10 Extreme 7 d/yr ≥103°F today · 30 d/yr by 30 yrs out
- Wind 10/10 Extreme 99% chance of damaging wind over 30 yrs
- Air quality 2/10 Low 1 unhealthy d/yr today · 2 by 30 yrs out
Nearby sold comps map
Loading sold comps map…
Walkable amenities ~0.75 mi
Loading nearby amenities…
Taxation est. · year 1
- Rental income
- $53,679
- − Mortgage interest
- −$23,246
- − Property taxes
- −$5,070
- − Insurance
- −$7,194
- − Repairs & maintenance
- −$4,294
- − Management
- −$4,294
- − HOA
- −$10,200
- − Depreciation
- −$12,073
- Taxable loss
- −$12,692
- Est. tax savings @ 24.0%
- +$3,046
- After-tax cash flow
- $-3,126/yr
For passive investors: Depreciation is non-cash, so a rental often shows a tax loss while cash-flowing — sheltering income. Rental losses are passive: they offset passive income freely, and up to $25,000/yr can offset ordinary (W-2) income if you actively participate and your MAGI is under $100k (phasing out to $0 by $150k); unused losses carry forward. On sale, claimed depreciation is recaptured at up to 25%, and gains may owe capital-gains tax (a 1031 exchange can defer both). Figures are a year-1 estimate at your 24.0% rate — not tax advice; consult a CPA.
Schools (NCES district)
- District
- Miami-Dade
- NCES district ID
- 1200390
- Math proficiency
- 45% ▼ -16.00%
- Reading proficiency
- 54% ▼ -5.00%
- Median HH income
- $43,928
- Composite
- 41.76/100
- National rank
- #3397
- State rank
- #40 of 73 in FL
Livability — Bay Harbor Islands
- Score
- 86/100
- State rank
- #13
- US rank
- #362
Category grades
Schools grade is shown separately in the Schools card above.
Census & demographics
- Census place
- Bay Harbor Islands, FL
- County
- Miami-Dade County · 2,697,751 people
- City population
- 14,435
- Metro
- Miami-Fort Lauderdale-Pompano Beach, FL
- Population (ZIP)
- 14,572
- Household income
- $89,563
- Rent vs Own
- Severe rent burden
- 774.0
Population outlook (Miami-Dade County) Hauer SSP2
- Today (2025)
- 3,126,439 people
- By 2030
- 3,325,765 · +6.4%
- By 2040
- 3,697,561 · +18.3%
- By 2050
- 4,012,134 · +28.3%
- By 2075
- 4,605,612 · +47.3%
- By 2100
- 4,866,598 · +55.7%
Race, ethnicity, and origin ACS 2023
- Neighborhood character
- Majority White (53%)
- Race & ethnicity
- White 53% Hispanic / Latino 41% Two or more races 25% Black 2%
- Hispanic origin (detail)
- Puerto Rican 2% Cuban 12% Salvadoran 2%
- Common ancestry
- Scotch-Irish 7% Romanian 5% Lithuanian 4%
- Foreign-born
- 46% · Canada, Jamaica, Dominican Republic
- Languages at home
- 36% English-only · Spanish 41% French/Haitian/Cajun 7% Other Indo-European 5%
Political lean MEDSL · Miami-Dade
- 2024 margin
- R (+11.4) · D 43.9% · R 55.4%
- 2008→2024 swing
- -27.6pp toward R · 2008: 16.1pp · 2024: -11.4pp
- All cycles
- 2024: R+11.4 2020: D+7.3 2016: D+29.6 2012: D+23.7 2008: D+16.1
Not yet ingested
- Civics
- —
Market trends
- HPI YoY
- ▲ 6.12%
- Current HPI
- 454.1747
- Rent YoY
- ▼ -1.30%
- Metro
- Miami-Fort Lauderdale-Pompano Beach, FL
- State GDP YoY
- ▲ 3.28%
- F500 in state
- 36
Industry mix (Fortune 500 HQ in FL)
| Industry | F500 HQs | Revenue |
|---|---|---|
| Industrial Technology | 2 | $29B |
|
||
| Insurance | 2 | $17B |
|
||
| Retail | 1 | $60B |
|
||
| Technology Distribution | 1 | $58B |
|
||
| Homebuilding | 1 | $35B |
|
||
| Technology Manufacturing | 1 | $35B |
|
||
Price history
+783.0% since first listed12 events — show timeline
- 2026-05-05 Pending — MARMLS
- 2026-01-16 Price Changed $415,000 MARMLS
- 2025-12-19 Relisted — MARMLS
- 2025-12-19 Listing Removed — MARMLS
- 2025-07-11 Listed $440,000 MARMLS
- 2023-08-29 Rental Removed $2,700 MARMLS
- 2023-08-24 Listing Removed — MARMLS
- 2023-07-17 Price Changed $439,000 MARMLS
- 2023-07-17 Price Changed $2,700 MARMLS
- 2023-06-30 Listed $449,000 MARMLS
- 1999-12-01 Sold (Public Records) $90,000 Public Records
- 1973-06-01 Sold (Public Records) $47,000 Public Records
Property tax history
+13.1%/yrLatest (2025): $5,070 · +17.1% YoY. Source: county tax records.
Cash-flow waterfall
monthlySold comps — $/sqft
last 12 mo · ≤1 miLoading sold comps…