4500 N Federal Hwy Unit 125c · Lighthouse Point, FL
Flood risk 6/10 · Moderate
- FEMA flood zone
- AH
- Chance of flooding over 30 yrs
- 0.64%
- Est. flood insurance / yr
- $1,142 – $2,507
Fire risk 1/10 · Minimal
- Est. fire insurance / yr
- $947 – $1,759
Heat risk 10/10 · Severe
- Hot days now (above 106°F)
- 7 days/yr
- Hot days in 30 yrs
- 26 days/yr
Wind risk 10/10 · Severe
- Chance of severe wind over 30 yrs
- 99.0%
Air-quality risk 2/10 · Minimal
- Unhealthy air days now
- 1 days/yr
- Unhealthy air days in 30 yrs
- 3 days/yr
Risk factors via First Street. Map © Google.
Why this score? — see what drove the C- grade
The composite is a weighted blend of 9 inputs, each scored 0–100. Each bar is that input's sub-score; the figure is the points it added to the 100-point composite (weight × sub-score).
- Cash flow +16.3/30.0
- 1% rule +9.0/10.0
- ARV discount +7.5/15.0
- DSCR +5.0/10.0
- Schools +4.1/10.0
- Condition / age +3.8/5.0
- Livability +3.6/5.0
- Rent growth +2.9/5.0
- Appreciation +0.0/10.0
$167,999
🖨 Deal sheet (PDF) 📄 Offer letter ✓ Due diligence
Listing remarks
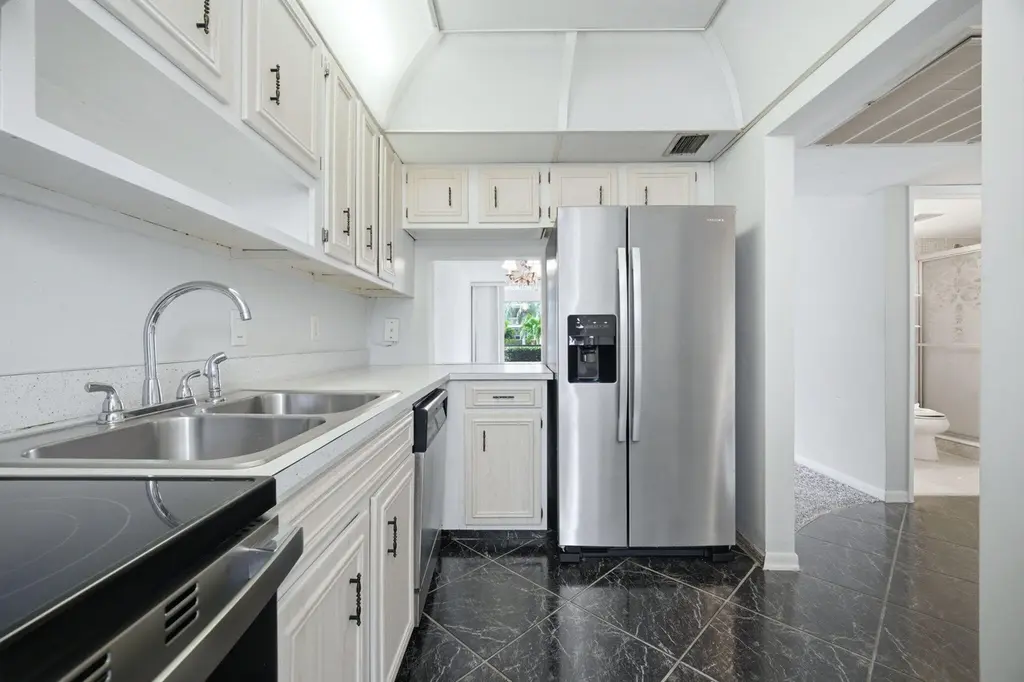
Live the lighthouse point lifestyle in this bright, ground-floor 2/2 condo! All ages welcome. This home features a spacious open layout with striking marble-patterned tile in the kitchen, entry, and patio, paired with carpet in the living and bedroom areas. The kitchen features stainless appliances and a breakfast bar. Relax on your oversized screened patio overlooking peaceful garden views. Highlights: two large walk-in closets, accordion hurricane shutters, and extra storage. Amenities include: heated pool, gym, and clubhouse. Steps from dan Witt park and minutes to the beach. Boat dockage with ocean access available via waiting list! Rentable after 2 years. 640 min credit required. Coast
Key facts
- Stainless appliances
- Ground-floor condo
- Spacious open layout
Tags
Property features AI
Finance
- Other: Land is not leased; Pets not allowed
- HOA & community: Association with clubhouse, car wash area, elevator(s), fitness center, laundry, parking, pool (heated), shuffleboard court, storage; HOA fee collected monthly
Exterior
- Parking: Assigned parking (1 space)
- Utilities: Public water; Public sewer; Electricity connected; Cable available; Sewer connected; Water available
- Home design: Condominium; One story / One level; Entry at level 1; Faces west
- Construction: Built with stucco and CBS construction; Composition/shingle/other roof
- Exterior features: No waterfront; Ocean access (no fixed bridge listed)
Interior
- Kitchen: Dishwasher; Electric range; Microwave; Refrigerator (ENERGY STAR qualified refrigerator listed)
- Bedrooms: 2 bedrooms on the main level
- Flooring: Carpet; Ceramic tile; Tile
- Bathrooms: 2 full bathrooms
- Heating & cooling: Central heating; Central air conditioning; Ceiling fan(s)
- Interior features: Walk-in closets
- Laundry & utility: Laundry facilities in the building (association amenity)
Neighborhood map
What this means for you Summary
Snapshot
- This is a 2-bed/2.0-bath condo listed at $168k. Condition is rated good.
Deal economics
- At list price, monthly cash flow is $-60 ($-724/yr) — negative.
- To cash-flow at today's rent, offer at most $159k (5.2% below list).
- Meets the 1% rule at list price ($2k rent vs $168k).
- Recommended offer: $159k (5.2% below list) — sets the bar for cash-flow.
- Cap rate 6.9% vs local median 2.4% in Lighthouse Point — top-decile yield for the area; either an underpriced asset or a hidden risk that comps aren't pricing in. Stress-test before assuming the spread holds.
Location & tenants
- Location reads 71/100 on livability (#384 in FL) — a middle-class / working-renter tenant base. Strengths: crime A+, employment A+, health & safety A+; Watch: amenities F, commute F, cost of living F.
- Broward (suburban): math 42% / reading 53% proficiency, ranked #46 of 73 in FL (top 63%) — families likely to look elsewhere, expect single-tenant / working-renter base with shorter leases.
- Zoned schools: Norcrest Elementary School (math 39% / reading 43%, grade F, #1,454 of 2,144 statewide, top 69%, 672 students, 71% FRL); Deerfield Beach Middle School (math 30% / reading 39%, grade F, #421 of 571 statewide, top 74%, 1,140 students, 72% FRL); Deerfield Beach High School (math 12% / reading 37%, grade F, #505 of 667 statewide, top 79%, 2,251 students, 69% FRL) — zoned schools average 71% FRL vs 51% district-wide (19 pts higher); higher-poverty schools than district average — tighter screening recommended.
- Zoned-school proficiency averages 33% at this address vs 48% district-wide (-14 pts) — the specific schools serving this property underperform the Broward average; the district grade overstates school quality for this exact location.
- Market conditions: Rents rising (+1.8%/yr); 595 active listings in the ZIP; 40 comparable units currently listed for rent nearby; rentals at typical pace (median 26d on market — plan ~3-4 weeks tenant-placement turnaround); 2,111 units permitted in Broward County in 2024 (1,265 in 5+ unit buildings).
- This rent runs 40% of the median local income ($71k/yr) — at the standard rent-burdened threshold; future hikes will face affordability resistance.
Forward outlook
- Local home prices are declining (-3.0%/yr); year-one equity from $1k of loan paydown is wiped out by about $5k of value loss. Plan a longer hold.
- Broward County population projected at +34% by 2050 — long-run rental-demand tailwind backs the buy-and-hold thesis.
Negotiation context
- It's been on market 57 days — a 3% lower offer ($163k) is reasonable based on typical stale-listing flexibility.
Risks & watch-outs
- Watch-outs: flood insurance adds $152/mo; HOA is 26% of rent.
- Climate carrying-cost: in FEMA flood zone AH (mandatory federal flood insurance); severe wind risk, 99% chance of damaging wind over 30y; extreme-heat days projected 7→26/yr by 2055 (HVAC capex compounding) — expect insurance premiums to compound above CPI over the hold.
Questions for the listing agent
- What do current leases actually rent for vs. the listed asking? Can we see a recent rent roll and the last 12 months of T-12 income?
- It's been on market 57 days. Have you received any prior offers? Is the seller open to a 5% concession, seller financing, or rate buy-down credit?
- Built in 1970 — when were the roof, HVAC, electrical panel, plumbing, and water heater last replaced?
- What's the actual annual flood-insurance premium (NFIP or private), and is the property in a SFHA with mandatory coverage?
- What does the HOA fee cover, when was the last increase, and are there any pending special assessments or reserve-fund shortfalls?
- Any open or pending special assessments — roof, HVAC, plumbing, elevator, façade? What's the per-unit balance and payoff schedule, and is the seller paying it off at close or rolling it to the buyer?
- Is there a deadline driving the sale (1031 exchange, divorce, estate, relocation)? That informs how much negotiation room exists.
- What's the average days-on-market for RENTAL listings here right now (not sales)? A rising rental-DOM trend means longer vacancies and softer asking-rent achievability than the comps imply.
- What's the recent tenant-quality profile in this submarket — average credit score on applications, eviction rate, late-payment / NSF rate, and stable-employment percentage? A property-management company in the area should have these aggregated.
- How much new apartment / multifamily construction is in the pipeline within 1–3 miles? Heavy new supply (>2% of stock underway) typically softens rents 12–24 months out; light construction supports rent growth.
Investment metrics
- 1% rule
- 1.40% ✓
- Cap rate
- 6.95%
- Cash-on-cash
- 2.34%
- DSCR
- 1.10
- GRM
- 6.0
CMA / ARV
No comps found within radius.
Projected returns pro-forma
-3.0% appreciation · 1.75% rent growth · sell at horizon
- IRR
- -20.8%
- Equity multiple
- 0.29×
- Total profit
- $-33,486
- Equity at exit
- $25,049
- IRR
- -18.8%
- Equity multiple
- 0.07×
- Total profit
- $-43,764
- Equity at exit
- $14,525
Cash invested: $47,040 (down + closing). Projections, not guarantees.
Landlord ↔ Tenant lean methodology
- Overall (STATE)
- 87 Strongly Landlord-Friendly
- State Florida
- 87 Strongly Landlord-Friendly · R+3
- County
- — inherits STATE
- City
- — inherits STATE
ZIP-level market 33064
- Home prices YoY
- -18.7%
- Rents YoY
- 1.8%
- Active inventory
- 595
- Price-to-rent
- 6.0×
Monthly cashflow live
- Estimated rent
- $2,353 high interval (Pro) →
- Mortgage (P&I)
- −$881
- Tax est. 1.5%
- −$210 /mo · $2,520/yr
- Insurance
- −$70
- Flood insurance flood zone
- −$152 /mo · $1,824/yr
- HOA
- −$606
- Vacancy / Maint / Mgmt
- −$494
- Net cashflow
- $-60
Break-even live
Sensitivity live
| Price | -10% $56 | -5% $-2 | +0% $-60 | +5% $-118 | +10% $-176 |
|---|---|---|---|---|---|
| Rent | -10% $-246 | -5% $-153 | +0% $-60 | +5% $33 | +10% $126 |
| Rate | -1.0pp $24 | -0.5pp $-18 | base $-60 | +0.5pp $-104 | +1.0pp $-148 |
UW: 25.0% down · 7.5% · 30yr · 1.5% tax · 5.0% vac · 8.0% maint · 8.0% mgmt
Financing live
Cash to close
- Down payment
- $42,000
- Closing costs
- $5,040
- Reserves months
- —
- Total cash needed
- —
Loan-product check · same deal, 3 products live
Conventional
25% down · 7.5% · 30yr
- Down + closing
- —
- Monthly P&I
- —
- Monthly cashflow
- —
- DSCR
- —
- Eligible?
- —
Personal DTI + credit; lowest rate.
DSCR
20% down · 8.5% · 30yr
- Down + closing
- —
- Monthly P&I
- —
- Monthly cashflow
- —
- DSCR
- —
- Eligible?
- —
No personal income docs; deal must DSCR.
Hard money
10% down · 12.0% · 12mo
- Down + closing
- —
- Monthly P&I
- —
- Monthly cashflow
- —
- DSCR
- —
- Eligible?
- —
Short-term bridge; refi at stabilization.
Rent comps 40 comps
| Address | Beds | Baths | Sqft | Rent | $/sqft | DOM | Units | Dist |
|---|---|---|---|---|---|---|---|---|
| 4502 N Federal Hwy Unit 167H Lighthouse Point, FL | 2.0 | 2.0 | 984 | $2,800 | $2.85 | 13d | 1 | 0.03mi |
| 4502 N Federal Hwy Unit 336D Lighthouse Point, FL | 2.0 | 2.0 | 984 | $2,830 | $2.88 | 26d | 1 | 0.03mi |
| 4500 N Federal Hwy Unit 316B Lighthouse Point, FL | 2.0 | 2.0 | 984 | $1,950 | $1.98 | 26d | 1 | 0.03mi |
| 4611 N Federal Hwy Pompano Beach, FL | 1.0–3.0 | 1.0–2.0 | 969 | $2,691 | $2.78 | 1d | 8 | 0.14mi |
| 2115 NE 42nd Ct Unit 206N Lighthouse Point, FL | 1.0 | 1.0 | 560 | $1,600 | $2.86 | 26d | 1 | 0.16mi |
| 4411 N Federal Hwy Pompano Beach, FL | 1.0–3.0 | 1.0–2.0 | 1039 | $2,396 | $2.31 | 0d | 20 | 0.17mi |
| 2121 NE 42nd Ct Unit 103C Lighthouse Point, FL | 2.0 | 2.0 | 960 | $1,795 | $1.87 | 26d | 1 | 0.20mi |
| 1960 NE 48th St Unit 9 Pompano Beach, FL | 1.0 | 1.0 | 700 | $1,500 | $2.14 | 24d | 1 | 0.22mi |
| 1850 NE 48th St Pompano Beach, FL | 1.0–3.0 | 1.0–1.5 | 827 | $1,975 | $2.39 | 26d | 1 | 0.26mi |
| 1933 NE 48th St Pompano Beach, FL | 3.0 | 2.0 | 1081 | $3,000 | $2.78 | 4d | 1 | 0.28mi |
| 1933 NE 48th St Pompano Beach, FL | 3.0 | 2.0 | 1081 | $3,000 | $2.78 | 9d | 1 | 0.28mi |
| 4350 NE 18th Ave Pompano Beach, FL | 2.0 | 1.0 | 920 | $2,500 | $2.72 | 18d | 1 | 0.30mi |
| 2120 NE 41st St Unit C Lighthouse Point, FL | 1.0 | 1.0 | 650 | $1,675 | $2.58 | 26d | 1 | 0.39mi |
| 3850 NE 21st Way #53 Lighthouse Point, FL | 2.0 | 2.0 | 780 | $1,900 | $2.44 | 26d | 1 | 0.58mi |
| 1400 NE 43rd Ct Unit 1400 Pompano Beach, FL | 3.0 | 1.0 | 1098 | $2,900 | $2.64 | 26d | 1 | 0.60mi |
| 3837 NE 17th Ave Pompano Beach, FL | 1.0 | 1.0 | 800 | $2,100 | $2.62 | 13d | 1 | 0.69mi |
| 3700 NE 22nd Ave Unit 3720-11 Lighthouse Point, FL | 1.0 | 1.0 | 650 | $1,825 | $2.81 | 26d | 1 | 0.73mi |
| 2121 NE 36th Ct Lighthouse Point, FL | 1.0 | 1.0 | 800 | $1,975 | $2.47 | 13d | 1 | 0.80mi |
| 2121 NE 36th Ct Lighthouse Point, FL | 1.0 | 1.0 | 800 | $1,975 | $2.47 | 26d | 1 | 0.80mi |
| 1633 NE 53rd Ct Pompano Beach, FL | 3.0 | 1.0 | 1100 | $2,400 | $2.18 | 16d | 1 | 0.80mi |
| 1597 NE 53rd Ct Pompano Beach, FL | 2.0 | 1.0 | 930 | $2,775 | $2.98 | 1d | 1 | 0.82mi |
| 1417 SE 3rd Ter Deerfield Beach, FL | 1.0 | 1.0 | 570 | $1,300 | $2.28 | 13d | 1 | 0.82mi |
| 1404 SE 3rd Ter Deerfield Beach, FL | 2.0 | 1.0 | 955 | $2,400 | $2.51 | 18d | 1 | 0.85mi |
| 3150 NE 48th Ct #104 Lighthouse Point, FL | 2.0 | 2.0 | 1020 | $3,000 | $2.94 | 26d | 1 | 0.90mi |
| 3100 NE 48th Ct Lighthouse Point, FL | 2.0 | 2.0 | 1020 | $2,725 | $2.67 | 26d | 2 | 0.91mi |
| 1325 SE 8th Ave Deerfield Beach, FL | 2.0 | 1.0 | 800 | $1,900 | $2.38 | 26d | 4 | 0.91mi |
| 3180 NE 48th Ct #412 Lighthouse Point, FL | 2.0 | 2.0 | 1020 | $3,300 | $3.24 | 26d | 1 | 0.97mi |
| 1480 E Sample Rd Pompano Beach, FL | 1.0 | 1.0 | 640 | $1,550 | $2.42 | 17d | 2 | 0.98mi |
| 1480 E Sample Rd #207 Pompano Beach, FL | 1.0 | 1.0 | 640 | $1,600 | $2.50 | 26d | 1 | 0.98mi |
| 941 NE 50th St Deerfield Beach, FL | 3.0 | 2.0 | 1105 | $2,850 | $2.58 | 26d | 1 | 1.01mi |
| 1069 Hillsboro Mile #507 Hillsboro Beach, FL | 2.0 | 2.0 | 1026 | $3,100 | $3.02 | 26d | 1 | 1.01mi |
| 431 SE 13th Ct Deerfield Beach, FL | 2.0 | 2.0 | 1100 | $2,255 | $2.05 | 22d | 1 | 1.04mi |
| 431 SE 13th Ct Deerfield Beach, FL | 1.0 | 2.0 | 850 | $1,805 | $2.12 | 7d | 1 | 1.04mi |
| 431 SE 13th Ct Deerfield Beach, FL | 2.0 | 2.0 | 1100 | $2,225 | $2.02 | 26d | 1 | 1.04mi |
| 431 SE 13th Ct Deerfield Beach, FL | 2.0 | 2.0 | 1100 | $2,160 | $1.96 | 16d | 1 | 1.04mi |
| 1444 SE 15th Ct #103 Deerfield Beach, FL | 1.0 | 1.5 | 810 | $2,900 | $3.58 | 26d | 1 | 1.04mi |
| 1671 NE 33rd St Unit 3 Pompano Beach, FL | 2.0 | 2.0 | 750 | $2,200 | $2.93 | 26d | 1 | 1.05mi |
| 1671 NE 33rd St Apt 1 Pompano Beach, FL | 1.0 | 1.0 | 750 | $1,650 | $2.20 | 26d | 1 | 1.05mi |
| 1147 Hillsboro Mile #1006 Hillsboro Beach, FL | 1.0 | 1.5 | 940 | $2,950 | $3.14 | 26d | 1 | 1.08mi |
| 1051 Hillsboro Mile Unit 507E Hillsboro Beach, FL | 2.0 | 2.0 | 1000 | $2,900 | $2.90 | 26d | 1 | 1.09mi |
HOA detail condo
- Monthly dues
- $606 · $7,272/yr
- Likely covers
- poolgym
- Assessments
- None detected in remarks — confirm with the listing agent.
Listing history 16 events
-
2026-06-21days on market $167,999 Active 57 DOM
-
2026-06-18days on market $167,999 Active 54 DOM
-
2026-06-17days on market $167,999 Active 53 DOM
-
2026-06-16days on market $167,999 Active 52 DOM
-
2026-06-15price $167,999 Active 51 DOM
-
2026-06-15days on market $170,000 Active 51 DOM
-
2026-06-13days on market $170,000 Active 49 DOM
-
2026-06-09days on market $170,000 Active 45 DOM
-
2026-06-08days on market $170,000 Active 44 DOM
-
2026-06-07days on market $170,000 Active 43 DOM
-
2026-06-04days on market $170,000 Active 40 DOM
-
2026-06-03days on market $170,000 Active 39 DOM
-
2026-06-02days on market $170,000 Active 38 DOM
-
2026-06-01days on market $170,000 Active 37 DOM
-
2026-05-31days on market $170,000 Active 36 DOM
-
2026-04-25$170,000 Active
ⓘ Source: listings_history table (triggers on properties + properties_extension) + one-shot
backfill from property_details.listing_events for pre-trigger history.
Climate risk First Street
- Flood 6/10 Major FEMA zone AH · 64% chance over 30 yrs
- Wildfire 1/10 Low
- Heat 10/10 Extreme 7 d/yr ≥106°F today · 26 d/yr by 30 yrs out
- Wind 10/10 Extreme 99% chance of damaging wind over 30 yrs
- Air quality 2/10 Low 1 unhealthy d/yr today · 3 by 30 yrs out
Nearby sold comps map
Loading sold comps map…
Walkable amenities ~0.75 mi
Loading nearby amenities…
Taxation est. · year 1
- Rental income
- $28,234
- − Mortgage interest
- −$9,411
- − Property taxes
- −$2,520
- − Insurance
- −$2,664
- − Repairs & maintenance
- −$2,259
- − Management
- −$2,259
- − HOA
- −$7,272
- − Depreciation
- −$4,887
- Taxable loss
- −$3,038
- Est. tax savings @ 24.0%
- +$729
- After-tax cash flow
- $5/yr
For passive investors: Depreciation is non-cash, so a rental often shows a tax loss while cash-flowing — sheltering income. Rental losses are passive: they offset passive income freely, and up to $25,000/yr can offset ordinary (W-2) income if you actively participate and your MAGI is under $100k (phasing out to $0 by $150k); unused losses carry forward. On sale, claimed depreciation is recaptured at up to 25%, and gains may owe capital-gains tax (a 1031 exchange can defer both). Figures are a year-1 estimate at your 24.0% rate — not tax advice; consult a CPA.
Condition & rehab AI · 12 photos
This bright, ground-floor 2/2 condo is in good condition with a good rehab level, featuring marble-patterned tile, stainless steel appliances, and a spacious layout. It has a good curb appeal and is ready for a new owner.
Value-add opportunities
- Both Paint chandelier — Enhances curb appeal and interior aesthetics
- Both Replace carpet with hardwood or tile — Improves durability and adds value
- Both Install smart home devices — Enhances convenience and adds modern appeal
Renovation cost estimate screening
Value-add ROI direction
- Both Paint chandelier — Enhances curb appeal and interior aesthetics ↑
- Both Replace carpet with hardwood or tile — Improves durability and adds value ↑
- Both Install smart home devices — Enhances convenience and adds modern appeal ↑
ⓘ Cost ranges are severity-bucket heuristics (US national rule-of-thumb). Get contractor quotes + a written scope before underwriting a rehab budget.
Schools (NCES district)
- District
- Broward
- NCES district ID
- 1200180
- Math proficiency
- 42% ▼ -18.00%
- Reading proficiency
- 53% ▼ -5.00%
- Median HH income
- $52,139
- Composite
- 40.88/100
- National rank
- #3621
- State rank
- #46 of 73 in FL
Livability — Lighthouse Point
- Score
- 71/100
- State rank
- #384
- US rank
- #6803
Category grades
Schools grade is shown separately in the Schools card above.
Census & demographics
- Census place
- Lighthouse Point, FL
- County
- Broward County · 1,963,430 people
- Metro
- Miami-Fort Lauderdale-Pompano Beach, FL
- Population (ZIP)
- 64,563
- Household income
- $71,301
- Rent vs Own
- Severe rent burden
- 2907.0
Population outlook (Broward County) Hauer SSP2
- Today (2025)
- 2,207,033 people
- By 2030
- 2,360,704 · +7.0%
- By 2040
- 2,661,208 · +20.6%
- By 2050
- 2,946,698 · +33.5%
- By 2075
- 3,602,273 · +63.2%
- By 2100
- 3,970,984 · +79.9%
Race, ethnicity, and origin ACS 2023
- Neighborhood character
- Highly diverse neighborhood (Simpson 0.75)
- Race & ethnicity
- White 34% Hispanic / Latino 27% Black 25% Two or more races 24% Asian 2%
- Hispanic origin (detail)
- Mexican 4% Puerto Rican 4% Cuban 4% Dominican 2%
- Common ancestry
- Hispanic 13% Estonian 10% Romanian 1%
- Foreign-born
- 43% · Canada, Jamaica, Dominican Republic
- Languages at home
- 45% English-only · Spanish 23% French/Haitian/Cajun 16% Other Indo-European 13%
Political lean MEDSL · Broward
- 2024 margin
- D (+17.0) · D 58.0% · R 41.0%
- 2008→2024 swing
- -17.8pp toward R · 2008: 34.7pp · 2024: 17.0pp
- All cycles
- 2024: D+17.0 2020: D+29.8 2016: D+35.0 2012: D+34.9 2008: D+34.7
Not yet ingested
- Civics
- —
Market trends
- HPI YoY
- ▼ -109.09%
- Current HPI
- 474.7007
- Rent YoY
- ▲ 1.75%
- Metro
- Miami-Fort Lauderdale-Pompano Beach, FL
- State GDP YoY
- ▲ 3.28%
- F500 in state
- 36
Industry mix (Fortune 500 HQ in FL)
| Industry | F500 HQs | Revenue |
|---|---|---|
| Industrial Technology | 2 | $29B |
|
||
| Insurance | 2 | $17B |
|
||
| Retail | 1 | $60B |
|
||
| Technology Distribution | 1 | $58B |
|
||
| Homebuilding | 1 | $35B |
|
||
| Technology Manufacturing | 1 | $35B |
|
||
Price history
1 event — show timeline
- 2026-04-25 Listed $170,000 Beaches MLS
Cash-flow waterfall
monthlySold comps — $/sqft
last 12 mo · ≤1 miLoading sold comps…