 🏗️ New Construction
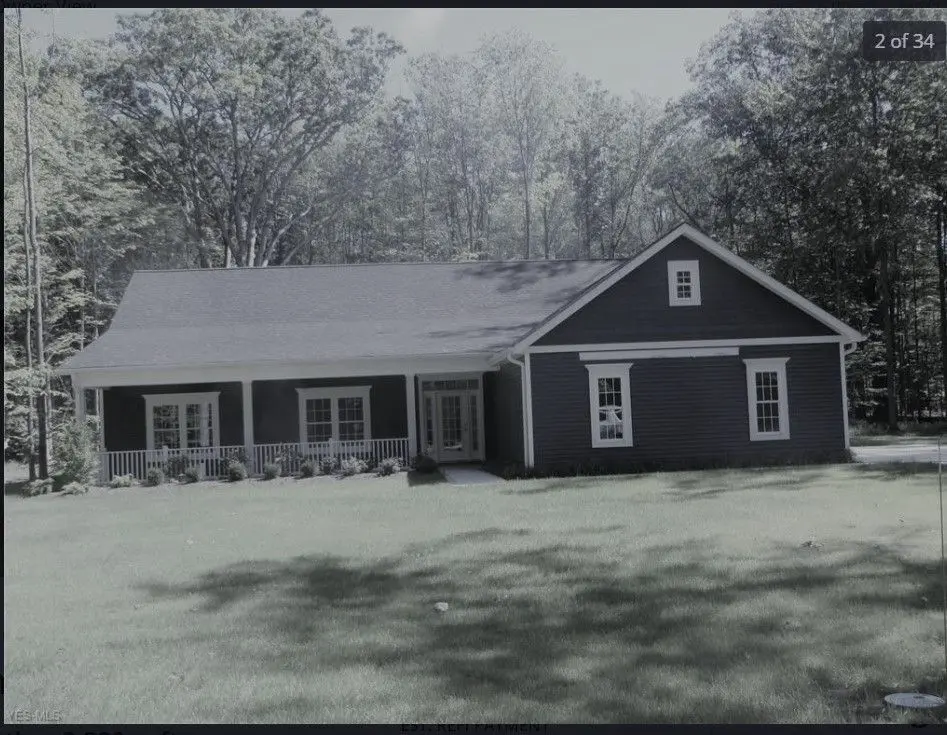
Ranch example. Cost is for LOT only Plan · Jefferson, OH
Flood risk 1/10 · Minimal
- FEMA flood zone
- X (unshaded)
- Chance of flooding over 30 yrs
- 0.0%
- Est. flood insurance / yr
- $507 – $1,088
Fire risk 1/10 · Minimal
- Est. fire insurance / yr
- $713 – $1,323
Heat risk 2/10 · Minimal
- Hot days now (above 95°F)
- 7 days/yr
- Hot days in 30 yrs
- 16 days/yr
Wind risk 1/10 · Minimal
- Chance of severe wind over 30 yrs
- —
Air-quality risk 3/10 · Minor
- Unhealthy air days now
- 2 days/yr
- Unhealthy air days in 30 yrs
- 5 days/yr
Risk factors via First Street. Map © Google.
Why this score? — see what drove the F grade
The composite is a weighted blend of 9 inputs, each scored 0–100. Each bar is that input's sub-score; the figure is the points it added to the 100-point composite (weight × sub-score).
- ARV discount +7.5/15.0
- Schools +4.6/10.0
- Condition / age +4.0/5.0
- Livability +3.5/5.0
- Rent growth +2.5/5.0
- Cash flow +2.4/30.0
- 1% rule +0.0/10.0
- DSCR +0.0/10.0
- Appreciation +0.0/10.0
$30,000
🖨 Deal sheet 📄 Offer letter ✓ Due diligence
Listing remarks MLS
Cost is for the LOT only. This represents homes that have been built in the subdivision. Find your own builder and make your dream come true. Enter front foyer with large closet and guest bath in this newly built ranch. Gaze upon huge great room that will dazzle you with it's vaulted ceilings, custom cabinets and woodwork, tile gas fireplace and 8x3' island with stainless steel sink and dishwasher. Cupboards and cabinets are plentiful in this homey ranch. Entry through the garage leads to nice sized mudroom, offset with a 7x11 laundry room with utility sink and cabinets. Bedrooms are spacious. Master bath has his and her closets, his and her vanities and sinks, soaker tub and individual shower. Double doors off master bedroom leads to 10x24' patio which extends past great room. View is open yet woodsy, giving home an enjoyable feel surrounded by nature. Front porch is large enough to accommodate outside relaxation.
Key facts
- Guest bath
- Custom cabinets
- Tile gas fireplace
Tags
Neighborhood map
What this means for you Summary
Snapshot
- This is a 3-bed/2.5-bath single-family listed at $30k. Condition is rated good.
Deal economics
- At list price, monthly cash flow is $-1k ($-12k/yr) — negative.
- The deal already cash-flows at list — no discount required.
- Meets the 1% rule at list price ($1k rent vs $30k).
- Recommended offer: $26k (12.0% below list) — sets the bar for market timing.
Location & tenants
- Location reads 69/100 on livability (#506 in OH) — a middle-class / working-renter tenant base. Strengths: cost of living A+, housing A+, crime A; Watch: health & safety D, amenities F, commute F.
- Jefferson Area Local (rural): math 46% / reading 62% proficiency, ranked #382 of 656 in OH (top 58%) — acceptable for families but not a draw, mixed tenant base, ~2y average lease.
- Market conditions: 23 active listings in the ZIP; 155 units permitted in Ashtabula County in 2024 (0 in 5+ unit buildings).
Forward outlook
- Local home prices are declining (-3.0%/yr); year-one equity from $2k of loan paydown is wiped out by about $9k of value loss. Plan a longer hold.
- Ashtabula County population projected at -22% by 2050 — secular population decline; favor cash flow + early exit over multi-decade hold.
Negotiation context
- It's been on market 403 days — a 12% lower offer ($26k) is reasonable based on typical stale-listing flexibility.
Risks & watch-outs
- Watch-outs: property tax is 14.9% of price.
Questions for the listing agent
- What do current leases actually rent for vs. the listed asking? Can we see a recent rent roll and the last 12 months of T-12 income?
- It's been on market 403 days. Have you received any prior offers? Is the seller open to a 12% concession, seller financing, or rate buy-down credit?
- Property tax is high relative to price — has the assessment been appealed recently, and will the sale trigger a re-assessment?
- Why hasn't it sold? Are there any deal-killer items the seller is aware of (foundation, flood, title, zoning, code violations)?
- Is there a deadline driving the sale (1031 exchange, divorce, estate, relocation)? That informs how much negotiation room exists.
- Schools are B-rated — typically a magnet for longer-tenancy family renters. What's the average tenant stay here, and is there a school-zone premium baked into asking?
- The area grade is low — what's the realistic commute time and amenity access for the typical tenant pool here? Any planned neighborhood developments (good or bad) we should know about?
- What's the average days-on-market for RENTAL listings here right now (not sales)? A rising rental-DOM trend means longer vacancies and softer asking-rent achievability than the comps imply.
- What's the recent tenant-quality profile in this submarket — average credit score on applications, eviction rate, late-payment / NSF rate, and stable-employment percentage? A property-management company in the area should have these aggregated.
- How much new for-sale + rental construction is in the pipeline within 1–3 miles? Heavy new supply typically softens prices + rents 12–24 months out; constrained supply supports both.
Investment metrics
- 1% rule
- 0.43% ✗
- Cap rate
- 2.10%
- Cash-on-cash
- -14.98%
- DSCR
- 0.33
- GRM
- 19.3
CMA / ARV
- ARV (median comp)
- $297,572
- List price
- $30,000
- Delta
- -89.92%
- Verdict
- UNDERPRICED
- Comps
- 20 within 1.0 mi
Show comp detail 3 sales within ~0.75 mi
| Address | Dist | Beds/Ba | Sqft | Sold | Price | $/sf | Match |
|---|---|---|---|---|---|---|---|
| 332 Hillyer | 0.24mi | 4/2.5 (+1) | 2,410 (+9%) | 19mo | $363,000 | $151 | 53 |
| 420 Brittany Ln | 0.51mi | 3/2.5 | 1,944 (-12%) | 7mo | $320,000 | $165 | 50 |
| 184 W Jefferson St | 0.70mi | 4/3.0 (+1) | 2,048 (-8%) | 10mo | $279,900 | $137 | 39 |
Match score weights: distance 35% · size 25% · config 20% · recency 20%. Top-matched comps best support the ARV.
Projected returns pro-forma
-3.0% appreciation · 3.0% rent growth · sell at horizon
- IRR
- -45.1%
- Equity multiple
- -0.37×
- Total profit
- $-114,465
- Equity at exit
- $44,369
- IRR
- -82.1%
- Equity multiple
- -1.22×
- Total profit
- $-184,921
- Equity at exit
- $25,729
Cash invested: $83,320 (down + closing). Projections, not guarantees.
Landlord ↔ Tenant lean methodology
- Overall (STATE)
- 73 Landlord-Friendly
- State Ohio
- 73 Landlord-Friendly · R+6
- County
- — inherits STATE
- City
- — inherits STATE
ZIP-level market 44047
- Home prices YoY
- -23.3%
- Active inventory
- 23
- Price-to-rent
- 1.9×
Monthly cashflow live
- Estimated rent
- $1,286 medium interval (Pro) →
- Mortgage (P&I)
- −$1,560
- Tax est. 1.5%
- −$372 /mo · $4,464/yr
- Insurance
- −$124
- HOA
- −$0
- Vacancy / Maint / Mgmt
- −$270
- Net cashflow
- $-1,040
Break-even live
UW: 25.0% down · 7.5% · 30yr · 1.5% tax · 5.0% vac · 8.0% maint · 8.0% mgmt
Financing live
Cash to close
- Down payment
- $74,393
- Closing costs
- $8,927
- Reserves months
- —
- Total cash needed
- —
Loan-product check · same deal, 3 products live
Conventional
25% down · 7.5% · 30yr
- Down + closing
- —
- Monthly P&I
- —
- Monthly cashflow
- —
- DSCR
- —
- Eligible?
- —
Personal DTI + credit; lowest rate.
DSCR
20% down · 8.5% · 30yr
- Down + closing
- —
- Monthly P&I
- —
- Monthly cashflow
- —
- DSCR
- —
- Eligible?
- —
No personal income docs; deal must DSCR.
Hard money
10% down · 12.0% · 12mo
- Down + closing
- —
- Monthly P&I
- —
- Monthly cashflow
- —
- DSCR
- —
- Eligible?
- —
Short-term bridge; refi at stabilization.
Listing history 8 events
-
2026-06-08days on market $30,000 Active 403 DOM
-
2026-06-08days on market $30,000 Active 402 DOM
-
2026-06-05days on market $30,000 Active 400 DOM
-
2026-06-04days on market $30,000 Active 398 DOM
-
2026-06-02days on market $30,000 Active 397 DOM
-
2026-06-01days on market $30,000 Active 396 DOM
-
2026-05-31days on market $30,000 Active 395 DOM
-
2025-05-01$30,000 Active 928-char remark
Show marketing remark (928 chars)
Cost is for the LOT only. This represents homes that have been built in the subdivision. Find your own builder and make your dream come true. Enter front foyer with large closet and guest bath in this newly built ranch. Gaze upon huge great room that will dazzle you with it's vaulted ceilings, custom cabinets and woodwork, tile gas fireplace and 8x3' island with stainless steel sink and dishwasher. Cupboards and cabinets are plentiful in this homey ranch. Entry through the garage leads to nice sized mudroom, offset with a 7x11 laundry room with utility sink and cabinets. Bedrooms are spacious. Master bath has his and her closets, his and her vanities and sinks, soaker tub and individual shower. Double doors off master bedroom leads to 10x24' patio which extends past great room. View is open yet woodsy, giving home an enjoyable feel surrounded by nature. Front porch is large enough to accommodate outside relaxation.
ⓘ Source: listings_history table (triggers on properties + properties_extension) + one-shot
backfill from property_details.listing_events for pre-trigger history.
Climate risk First Street
- Flood 1/10 Low FEMA zone X (unshaded) · 0% chance over 30 yrs
- Wildfire 1/10 Low
- Heat 2/10 Low 7 d/yr ≥95°F today · 16 d/yr by 30 yrs out
- Wind 1/10 Low
- Air quality 3/10 Moderate 2 unhealthy d/yr today · 5 by 30 yrs out
Nearby sold comps map
Loading sold comps map…
Walkable amenities ~0.75 mi
Loading nearby amenities…
Taxation est. · year 1
- Rental income
- $15,433
- − Mortgage interest
- −$16,669
- − Property taxes
- −$4,464
- − Insurance
- −$1,488
- − Repairs & maintenance
- −$1,235
- − Management
- −$1,235
- − Depreciation
- −$8,657
- Taxable loss
- −$18,313
- Est. tax savings @ 24.0%
- +$4,395
- After-tax cash flow
- $-8,090/yr
For passive investors: Depreciation is non-cash, so a rental often shows a tax loss while cash-flowing — sheltering income. Rental losses are passive: they offset passive income freely, and up to $25,000/yr can offset ordinary (W-2) income if you actively participate and your MAGI is under $100k (phasing out to $0 by $150k); unused losses carry forward. On sale, claimed depreciation is recaptured at up to 25%, and gains may owe capital-gains tax (a 1031 exchange can defer both). Figures are a year-1 estimate at your 24.0% rate — not tax advice; consult a CPA.
Condition & rehab AI · 12 photos
This well-maintained ranch home with modern updates is ready for move-in. It offers a good balance of style and functionality.
Value-add opportunities
- Both Painting exterior and interior — Enhances curb appeal and interior aesthetics
- Both Landscaping and curb appeal improvements — Enhances curb appeal and property value
- Both Add smart home features — Improves convenience and marketability
Renovation cost estimate screening
Value-add ROI direction
- Both Painting exterior and interior — Enhances curb appeal and interior aesthetics ↑
- Both Landscaping and curb appeal improvements — Enhances curb appeal and property value ↑
- Both Add smart home features — Improves convenience and marketability ↑
ⓘ Cost ranges are severity-bucket heuristics (US national rule-of-thumb). Get contractor quotes + a written scope before underwriting a rehab budget.
Schools (NCES district)
- District
- Jefferson Area Local
- NCES district ID
- 3904587
- Math proficiency
- 46% ▼ -14.00%
- Reading proficiency
- 62% ▼ -10.00%
- Median HH income
- $50,966
- Composite
- 46.13/100
- National rank
- #2506
- State rank
- #382 of 656 in OH
Livability — Jefferson
- Score
- 69/100
- State rank
- #506
- US rank
- #8526
Category grades
Schools grade is shown separately in the Schools card above.
Census & demographics
- Census place
- Jefferson, OH
- County
- Ashtabula · 97,617 people
- Metro
- Cleveland, OH
- Population (ZIP)
- 8,379
- Household income
- $59,720
- Rent vs Own
- Severe rent burden
- 10.7
Population outlook (Ashtabula County) Hauer SSP2
- Today (2025)
- 92,950 people
- By 2030
- 89,146 · -4.1%
- By 2040
- 80,715 · -13.2%
- By 2050
- 72,270 · -22.2%
- By 2075
- 55,780 · -40.0%
- By 2100
- 40,928 · -56.0%
Race, ethnicity, and origin ACS 2023
- Neighborhood character
- Predominantly White (92%)
- Race & ethnicity
- White 92% Two or more races 5% Hispanic / Latino 4%
- Common ancestry
- Romanian 3% Slovak 3% Scotch-Irish 1%
- Foreign-born
- 2% · Canada
Political lean MEDSL · Ashtabula
- 2024 margin
- Strong R (+28.4) · D 35.4% · R 63.8%
- 2008→2024 swing
- -41.9pp toward R · 2008: 13.5pp · 2024: -28.4pp
- All cycles
- 2024: R+28.4 2020: R+23.5 2016: R+19.0 2012: D+12.1 2008: D+13.5
Not yet ingested
- Civics
- —
Market trends
- HPI YoY
- ▼ -73.79%
- Current HPI
- 243.2537
- Rent YoY
- —
- Metro
- —
- State GDP YoY
- ▲ 1.98%
- F500 in state
- 48
Industry mix (Fortune 500 HQ in OH)
| Industry | F500 HQs | Revenue |
|---|---|---|
| Insurance | 3 | $145B |
|
||
| Industrial Machinery | 3 | $49B |
|
||
| Financial Services | 3 | $24B |
|
||
| Consumer Goods | 2 | $93B |
|
||
| Aerospace / Defense | 2 | $47B |
|
||
| Utilities | 2 | $33B |
|
||
Price history
1 event — show timeline
- 2025-05-01 Listed $30,000 Zillow
Cash-flow waterfall
monthlySold comps — $/sqft
last 12 mo · ≤1 miLoading sold comps…