7908 Rancho Fanita Dr Spc 17 · Santee, CA
Flood risk 1/10 · Minimal
- FEMA flood zone
- X (unshaded)
- Chance of flooding over 30 yrs
- 0.0%
- Est. flood insurance / yr
- $507 – $1,088
Fire risk 5/10 · Moderate
- Est. fire insurance / yr
- $659 – $1,223
Heat risk 5/10 · Moderate
- Hot days now (above 96°F)
- 6 days/yr
- Hot days in 30 yrs
- 16 days/yr
Wind risk 1/10 · Minimal
- Chance of severe wind over 30 yrs
- —
Air-quality risk 3/10 · Minor
- Unhealthy air days now
- 4 days/yr
- Unhealthy air days in 30 yrs
- 4 days/yr
Risk factors via First Street. Map © Google.
Why this score? — see what drove the B grade
The composite is a weighted blend of 9 inputs, each scored 0–100. Each bar is that input's sub-score; the figure is the points it added to the 100-point composite (weight × sub-score).
- Cash flow +30.0/30.0
- DSCR +10.0/10.0
- ARV discount +8.9/15.0
- 1% rule +8.8/10.0
- Schools +4.5/10.0
- Livability +3.2/5.0
- Rent growth +2.7/5.0
- Condition / age +2.5/5.0
- Appreciation +0.0/10.0
$239,900
🖨 Deal sheet 📄 Offer letter ✓ Due diligence
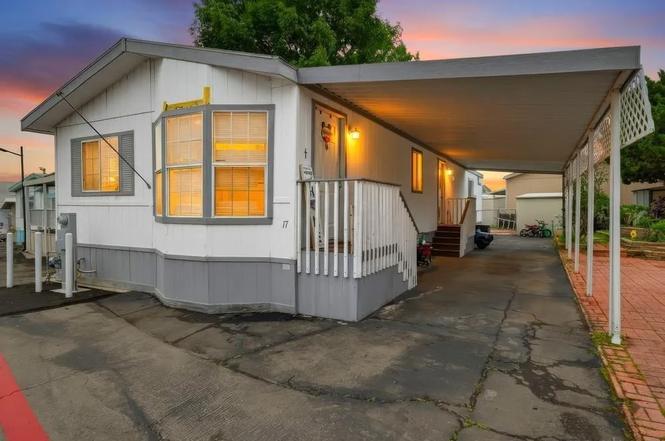
Listing remarks
Charming 3-Bedroom Home in Prime Santee Location – Listed Under $240,000! Welcome to this beautifully maintained manufactured home offering incredible value in the heart of Santee! Located on a desirable corner section just off Mission Gorge Road, this home is perfectly situated near grocery stores, shopping, dining, and convenient freeway access—making commuting a breeze. This spacious home features 3 bedrooms, 2 full bathrooms, and over 1,100 square feet of comfortable living space. Step inside to enjoy the bright and open floor plan highlighted by beautiful vaulted ceilings that create an airy, inviting atmosphere. The home offers generous closet space throughout, ensuring p
Key facts
- Corner location
- Close to shopping
- 7.03 acre lot
Tags
Property features AI
Finance
- HOA & community: Common-interest lot (community grounds)
Exterior
- Parking: Assigned parking; 2 parking spaces
- Home design: Manufactured home; Single-story; Residential property in Santee (Valley View Estates); R-1 single zoning
- Construction: Stucco construction
- Exterior features: Community pool
Interior
- Kitchen: Electric cooktop
- Bedrooms: Up to 3 bedrooms possible
- Bathrooms: 2 full bathrooms
- Heating & cooling: Central air conditioning; Natural gas heating
- Interior features: Electric cooktop
Neighborhood map
What this means for you Summary
Snapshot
- This is a 3-bed/2.0-bath manufactured listed at $240k.
Deal economics
- At list price, monthly cash flow is $1k ($14k/yr) — positive.
- The deal already cash-flows at list — no discount required.
- Meets the 1% rule at list price ($3k rent vs $240k).
- Recommended offer: $218k (9.0% below list) — sets the bar for market timing.
- Cap rate 12.2% vs local median 2.6% in Santee — top-decile yield for the area; either an underpriced asset or a hidden risk that comps aren't pricing in. Stress-test before assuming the spread holds.
Location & tenants
- Location reads 65/100 on livability (#361 in CA) — a middle-class / working-renter tenant base. Strengths: commute A+, employment A+, crime A-; Watch: health & safety C-, amenities D, cost of living F.
- Santee (suburban): math 46% / reading 54% proficiency, ranked #130 of 517 in CA (top 25%) — acceptable for families but not a draw, mixed tenant base, ~2y average lease.
- Market conditions: Rents flat; 197 active listings in the ZIP; 9 comparable units currently listed for rent nearby; rentals leasing fast (median 2d on market — plan ~1-2 weeks tenant-placement turnaround); high-income renter base; 11,759 units permitted in San Diego County in 2024 (7,244 in 5+ unit buildings).
- This rent runs 35% of the median local income ($114k/yr) — at the standard rent-burdened threshold; future hikes will face affordability resistance.
Forward outlook
- Local home prices are declining (-3.0%/yr); year-one equity from $2k of loan paydown is wiped out by about $7k of value loss. Plan a longer hold.
- San Diego County population projected at +20% by 2050 — long-run rental-demand tailwind backs the buy-and-hold thesis.
- At projected returns (-3.0% appreciation + 0.8% rent growth), your $67k cash investment doubles in ~7 years — after that, you're playing with house money.
Negotiation context
- It's been on market 91 days — a 9% lower offer ($218k) is reasonable based on typical stale-listing flexibility.
Risks & watch-outs
- Climate carrying-cost: moderate wildfire risk; extreme-heat days projected 6→16/yr by 2055 (HVAC capex compounding) — expect insurance premiums to compound above CPI over the hold.
Questions for the listing agent
- It's been on market 91 days. Have you received any prior offers? Is the seller open to a 9% concession, seller financing, or rate buy-down credit?
- Why hasn't it sold? Are there any deal-killer items the seller is aware of (foundation, flood, title, zoning, code violations)?
- Is there a deadline driving the sale (1031 exchange, divorce, estate, relocation)? That informs how much negotiation room exists.
- What's the average days-on-market for RENTAL listings here right now (not sales)? A rising rental-DOM trend means longer vacancies and softer asking-rent achievability than the comps imply.
- What's the recent tenant-quality profile in this submarket — average credit score on applications, eviction rate, late-payment / NSF rate, and stable-employment percentage? A property-management company in the area should have these aggregated.
- How much new for-sale + rental construction is in the pipeline within 1–3 miles? Heavy new supply typically softens prices + rents 12–24 months out; constrained supply supports both.
Investment metrics
- 1% rule
- 1.38% ✓
- Cap rate
- 12.20%
- Cash-on-cash
- 21.10%
- DSCR
- 1.94
- GRM
- 6.0
CMA / ARV
- ARV (on-the-fly)
- $247,520
- Comps found
- 12
Show comp detail 12 sales within ~0.75 mi
| Address | Dist | Beds/Ba | Sqft | Sold | Price | $/sf | Match |
|---|---|---|---|---|---|---|---|
| 7908 Rancho Fanita Dr #63 | 0.00mi | 3/2.0 | 1,238 (+10%) | 10mo | $234,000 | $189 | 74 |
| 8301 Mission Gorge Rd #170 | 0.34mi | 2/2.0 (-1) | 1,120 (0%) | 10mo | $265,000 | $237 | 71 |
| 8301 Mission Gorge Rd #181 | 0.34mi | 2/2.0 (-1) | 1,100 (-2%) | 11mo | $210,000 | $191 | 67 |
| 8301 Mission Gorge Rd #282 | 0.34mi | 2/2.0 (-1) | 1,248 (+11%) | 5mo | $310,000 | $248 | 56 |
| 8301 Mission Gorge Rd #86 | 0.34mi | 2/2.0 (-1) | 1,272 (+14%) | 2mo | $223,000 | $175 | 55 |
| 7467 Mission Gorge #75 | 0.51mi | 2/2.0 (-1) | 1,152 (+3%) | 16mo | $262,000 | $227 | 52 |
| 8301 Mission Gorge Rd #159 | 0.41mi | 2/2.0 (-1) | 1,220 (+9%) | 13mo | $180,000 | $148 | 50 |
| 8301 Mission Gorge Rpad Rd #152 | 0.34mi | 2/2.0 (-1) | 1,248 (+11%) | 13mo | $240,000 | $192 | 49 |
| 8545 Mission Gorge Rd Spc 141 | 0.75mi | 2/2.0 (-1) | 1,040 (-7%) | 7mo | $230,000 | $221 | 42 |
| 7467 Mission Gorge Rd #302 | 0.51mi | 2/2.0 (-1) | 960 (-14%) | 12mo | $405,000 | $422 | 37 |
| 8301 Mission Gorge Rd #115 | 0.46mi | 2/2.0 (-1) | 960 (-14%) | 16mo | $175,000 | $182 | 37 |
| 7467 Mission Gorge Rd Spc 9 | 0.51mi | 2/2.0 (-1) | 960 (-14%) | 16mo | $250,500 | $261 | 34 |
Match score weights: distance 35% · size 25% · config 20% · recency 20%. Top-matched comps best support the ARV.
Projected returns pro-forma
-3.0% appreciation · 0.85% rent growth · sell at horizon
- IRR
- 11.3%
- Equity multiple
- 1.44×
- Total profit
- $29,265
- Equity at exit
- $35,770
- IRR
- 18.6%
- Equity multiple
- 2.41×
- Total profit
- $94,444
- Equity at exit
- $20,742
Cash invested: $67,172 (down + closing). Projections, not guarantees.
Landlord ↔ Tenant lean methodology
- Overall (STATE)
- 18 Strongly Tenant-Friendly
- State California
- 18 Strongly Tenant-Friendly · D+13
- County
- — inherits STATE
- City
- — inherits STATE
ZIP-level market 92071
- Rents YoY
- 0.8%
- Active inventory
- 197
- Price-to-rent
- 6.0×
Monthly cashflow live
- Estimated rent
- $3,312 high interval (Pro) →
- Mortgage (P&I)
- −$1,258
- Tax from tax record
- −$77 /mo · $929/yr
- Insurance
- −$100
- HOA
- −$0
- Vacancy / Maint / Mgmt
- −$696
- Net cashflow
- $1,181
Break-even live
UW: 25.0% down · 7.5% · 30yr · 1.5% tax · 5.0% vac · 8.0% maint · 8.0% mgmt
Financing live
Cash to close
- Down payment
- $59,975
- Closing costs
- $7,197
- Reserves months
- —
- Total cash needed
- —
Loan-product check · same deal, 3 products live
Conventional
25% down · 7.5% · 30yr
- Down + closing
- —
- Monthly P&I
- —
- Monthly cashflow
- —
- DSCR
- —
- Eligible?
- —
Personal DTI + credit; lowest rate.
DSCR
20% down · 8.5% · 30yr
- Down + closing
- —
- Monthly P&I
- —
- Monthly cashflow
- —
- DSCR
- —
- Eligible?
- —
No personal income docs; deal must DSCR.
Hard money
10% down · 12.0% · 12mo
- Down + closing
- —
- Monthly P&I
- —
- Monthly cashflow
- —
- DSCR
- —
- Eligible?
- —
Short-term bridge; refi at stabilization.
Rent comps 9 comps
| Address | Beds | Baths | Sqft | Rent | $/sqft | DOM | Units | Dist |
|---|---|---|---|---|---|---|---|---|
| 7962 Arly Ct #12 Santee, CA | 2.0 | 2.0 | 945 | $2,800 | $2.96 | 2d | 1 | 0.18mi |
| 69 Via Sovana Santee, CA | 3.0 | 3.0 | 1342 | $3,600 | $2.68 | 2d | 1 | 0.32mi |
| 177 Via Montisi Santee, CA | 2.0 | 2.5 | 1239 | $3,450 | $2.78 | 2d | 1 | 0.33mi |
| 8617 Bushy Hill Dr Santee, CA | 2.0–3.0 | 2.0–3.0 | 1299 | $2,900 | $2.23 | 2d | 1 | 0.66mi |
| 8605 Arminda Cir Santee, CA | 2.0 | 2.0 | 958 | $2,650 | $2.77 | 2d | 1 | 0.81mi |
| 8609 Arminda Cir #13 Santee, CA | 2.0 | 2.0 | 984 | $3,000 | $3.05 | 2d | 1 | 0.83mi |
| 8434 Kreiner Way Santee, CA | 3.0 | 2.0 | 1305 | $4,213 | $3.23 | 22d | 1 | 0.89mi |
| 8009 Calle Fanita Santee, CA | 2.0 | 1.5 | 1024 | $2,995 | $2.92 | 2d | 1 | 1.44mi |
| 8745 Redwood Dr Santee, CA | 2.0–3.0 | 1.5–2.5 | 1264 | $3,100 | $2.45 | 2d | 1 | 1.44mi |
Listing history 2 events
-
2026-02-25price $239,900
-
2026-02-24$219,900 Active
ⓘ Source: listings_history table (triggers on properties + properties_extension) + one-shot
backfill from property_details.listing_events for pre-trigger history.
Tax reassessment forecast CA · Resets to sale price
- Current annual tax
- $929 · $77/mo
- Projected year-2 tax
- $1,823 · $152/mo
- Expected delta
- +$894/yr (+$75/mo · 96.3%)
ⓘ Screening estimate from a state-policy table — verify with the county assessor before closing.
Climate risk First Street
- Flood 1/10 Low FEMA zone X (unshaded) · 0% chance over 30 yrs
- Wildfire 5/10 Major
- Heat 5/10 Major 6 d/yr ≥96°F today · 16 d/yr by 30 yrs out
- Wind 1/10 Low
- Air quality 3/10 Moderate 4 unhealthy d/yr today · 4 by 30 yrs out
Nearby sold comps map
Loading sold comps map…
Walkable amenities ~0.75 mi
Loading nearby amenities…
Taxation est. · year 1
- Rental income
- $39,749
- − Mortgage interest
- −$13,438
- − Property taxes
- −$929
- − Insurance
- −$1,200
- − Repairs & maintenance
- −$3,180
- − Management
- −$3,180
- − Depreciation
- −$6,979
- Taxable income
- $10,843
- Est. tax owed @ 24.0%
- −$2,602
- After-tax cash flow
- $11,574/yr
For passive investors: Depreciation is non-cash, so a rental often shows a tax loss while cash-flowing — sheltering income. Rental losses are passive: they offset passive income freely, and up to $25,000/yr can offset ordinary (W-2) income if you actively participate and your MAGI is under $100k (phasing out to $0 by $150k); unused losses carry forward. On sale, claimed depreciation is recaptured at up to 25%, and gains may owe capital-gains tax (a 1031 exchange can defer both). Figures are a year-1 estimate at your 24.0% rate — not tax advice; consult a CPA.
Schools (NCES district)
- District
- Santee
- NCES district ID
- 0635880
- Math proficiency
- 46% ▼ -3.00%
- Reading proficiency
- 54% ▼ -2.00%
- Median HH income
- $73,452
- Composite
- 45.0/100
- National rank
- #2698
- State rank
- #130 of 517 in CA
Livability — Santee
- Score
- 65/100
- State rank
- #361
- US rank
- #12272
Category grades
Schools grade is shown separately in the Schools card above.
Census & demographics
- Census place
- Santee, CA
- County
- San Diego County · 3,178,799 people
- City population
- 59,590
- Metro
- San Diego-Chula Vista-Carlsbad, CA
- Population (ZIP)
- 59,590
- Household income
- $113,618
- Rent vs Own
- Severe rent burden
- 1719.0
Population outlook (San Diego County) Hauer SSP2
- Today (2025)
- 3,678,185 people
- By 2030
- 3,856,546 · +4.8%
- By 2040
- 4,171,407 · +13.4%
- By 2050
- 4,421,607 · +20.2%
- By 2075
- 4,831,599 · +31.4%
- By 2100
- 4,832,502 · +31.4%
Race, ethnicity, and origin ACS 2023
- Neighborhood character
- Majority White (63%)
- Race & ethnicity
- White 63% Hispanic / Latino 22% Two or more races 16% Asian 5% Black 2%
- Hispanic origin (detail)
- Mexican 18%
- Common ancestry
- Slovak 3% Italian 3% Lithuanian 2%
- Foreign-born
- 13% · Canada, Vietnam, China
- Languages at home
- 81% English-only · Spanish 8% Arabic 3% Other Asian/Pacific 1%
Political lean MEDSL · San Diego
- 2024 margin
- D (+16.8) · D 56.9% · R 40.1% · Other 2.9%
- 2008→2024 swing
- +6.6pp toward D · 2008: 10.2pp · 2024: 16.8pp
- All cycles
- 2024: D+16.8 2020: D+22.8 2016: D+17.8 2012: D+5.1 2008: D+10.2
Not yet ingested
- Civics
- —
Market trends
- HPI YoY
- ▼ -607.00%
- Current HPI
- 393.1781
- Rent YoY
- ▲ 0.85%
- Metro
- San Diego-Chula Vista-Carlsbad, CA
- State GDP YoY
- ▲ 3.21%
- F500 in state
- 116
Industry mix (Fortune 500 HQ in CA)
| Industry | F500 HQs | Revenue |
|---|---|---|
| Technology | 27 | $1,492B |
|
||
| Financial Services | 3 | $174B |
|
||
| Retail | 3 | $44B |
|
||
| Insurance | 3 | $26B |
|
||
| Media / Entertainment | 2 | $115B |
|
||
| Pharmaceuticals / Biotech | 2 | $62B |
|
||
Price history
+9.1% since first listed2 events — show timeline
- 2026-02-25 Price Changed $239,900 SDMLS
- 2026-02-24 Listed $219,900 SDMLS
Property tax history
+2.7%/yrLatest (2013): $929 · +3.6% YoY. Source: county tax records.
Cash-flow waterfall
monthlySold comps — $/sqft
last 12 mo · ≤1 miLoading sold comps…