76 Brock St · Georgetown, SC
Flood risk 1/10 · Minimal
- FEMA flood zone
- X (unshaded)
- Chance of flooding over 30 yrs
- 0.0%
- Est. flood insurance / yr
- $507 – $1,088
Fire risk 4/10 · Minor
- Est. fire insurance / yr
- $783 – $1,453
Heat risk 9/10 · Severe
- Hot days now (above 109°F)
- 7 days/yr
- Hot days in 30 yrs
- 17 days/yr
Wind risk 8/10 · Major
- Chance of severe wind over 30 yrs
- 99.0%
Air-quality risk 2/10 · Minimal
- Unhealthy air days now
- 1 days/yr
- Unhealthy air days in 30 yrs
- 2 days/yr
Risk factors via First Street. Map © Google.
Why this score? — see what drove the C grade
The composite is a weighted blend of 9 inputs, each scored 0–100. Each bar is that input's sub-score; the figure is the points it added to the 100-point composite (weight × sub-score).
- Cash flow +25.6/30.0
- DSCR +8.5/10.0
- ARV discount +7.5/15.0
- 1% rule +5.4/10.0
- Livability +3.2/5.0
- Schools +2.7/10.0
- Rent growth +2.5/5.0
- Condition / age +2.5/5.0
- Appreciation +0.0/10.0
$299,000
🖨 Deal sheet 📄 Offer letter ✓ Due diligence
Listing remarks
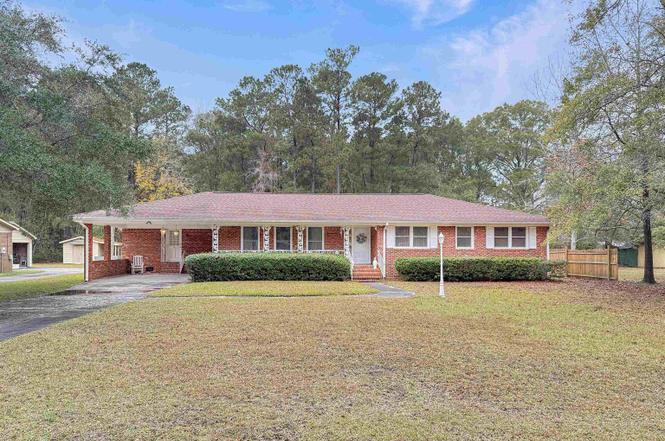
Offering one-level living on a wide ½-acre lot with no HOA, 76 Brock Street pairs practical comfort with flexible interior spaces and a central kitchen at its core. This 4-bedroom, 2-bath layout includes a family room at the front of the home and a separate living room with a fireplace, creating multiple areas for everyday living or entertaining. Additional features include a formal dining room, a separate laundry room, and a rear enclosed porch ideal for relaxing or expanding your usable living space. A carport provides convenient covered parking, and the large lot offers room for gardening, outdoor activities, or future improvements. Situated just six miles from historic downtown G
Key facts
- Wide half-acre lot
- One-level living
- Central kitchen
Tags
Property features AI
Finance
- HOA & community: Association fees billed monthly
Exterior
- Parking: Carport; 4 parking spaces total
- Utilities: Cable available; Electricity available; Sewer available; Public water
- Home design: Single-story; Brick construction; Crawlspace foundation; Resale property; Zoned residential
- Construction: Brick exterior; Crawlspace foundation
- Exterior features: Front porch; Storage; Outside city limits; Rectangular lot
Interior
- Kitchen: Range; Range hood; Kitchen exhaust fan
- Bedrooms: Bedroom on main level; Bedroom 1 (14 x 11); Bedroom 2 (11 x 12) — first level; Bedroom 3 (13 x 10) — first level; Additional bedroom-sized room (11 x 13) — first level
- Flooring: Laminate; Tile; Vinyl; Wood
- Bathrooms: 2 full bathrooms
- Heating & cooling: Central electric heating
- Interior features: Ceiling fan(s); Fireplace; Separate shower; Vanity; Window treatments; Entrance foyer
- Laundry & utility: Utility room
Neighborhood map
What this means for you Summary
Snapshot
- This is a 4-bed/2.0-bath single-family listed at $299k.
Deal economics
- At list price, monthly cash flow is $704 ($8k/yr) — positive.
- The deal already cash-flows at list — no discount required.
- Meets the 1% rule at list price ($3k rent vs $299k).
- Recommended offer: $263k (12.0% below list) — sets the bar for market timing.
- Cap rate 9.1% vs local median 4.7% in Georgetown — top-decile yield for the area; either an underpriced asset or a hidden risk that comps aren't pricing in. Stress-test before assuming the spread holds.
Location & tenants
- Location reads 65/100 on livability (#141 in SC) — a middle-class / working-renter tenant base. Strengths: cost of living A+, housing A+, health & safety A+; Watch: amenities D, schools F, crime F.
- Georgetown 01 (town): math 26% / reading 38% proficiency, ranked #51 of 80 in SC (top 64%) — families likely to look elsewhere, expect single-tenant / working-renter base with shorter leases.
- Market conditions: 409 active listings in the ZIP; 323 units permitted in Georgetown County in 2024 (0 in 5+ unit buildings).
Forward outlook
- Local home prices are declining (-3.0%/yr); year-one equity from $2k of loan paydown is wiped out by about $9k of value loss. Plan a longer hold.
Negotiation context
- It's been on market 181 days — a 12% lower offer ($263k) is reasonable based on typical stale-listing flexibility.
- 3 sale attempts since 2y ago; this cycle's ask has dropped $26k (8%) from the opening price — seller is motivated, your offer sets the floor, not the list.
Risks & watch-outs
- Climate carrying-cost: severe wind risk, 99% chance of damaging wind over 30y; extreme-heat days projected 7→17/yr by 2055 (HVAC capex compounding) — expect insurance premiums to compound above CPI over the hold.
Questions for the listing agent
- It's been on market 181 days. Have you received any prior offers? Is the seller open to a 12% concession, seller financing, or rate buy-down credit?
- Built in 1976 — when were the roof, HVAC, electrical panel, plumbing, and water heater last replaced?
- Why hasn't it sold? Are there any deal-killer items the seller is aware of (foundation, flood, title, zoning, code violations)?
- Is there a deadline driving the sale (1031 exchange, divorce, estate, relocation)? That informs how much negotiation room exists.
- Schools are F-rated, which usually means shorter tenancies and higher turnover. Who's the typical renter profile here, and what's been the actual vacancy rate?
- Crime grade is F in this area — have there been break-ins, vandalism, or insurance claims at this property in the last 3 years? What carrier currently insures it and at what premium?
- What's the average days-on-market for RENTAL listings here right now (not sales)? A rising rental-DOM trend means longer vacancies and softer asking-rent achievability than the comps imply.
- What's the recent tenant-quality profile in this submarket — average credit score on applications, eviction rate, late-payment / NSF rate, and stable-employment percentage? A property-management company in the area should have these aggregated.
- How much new for-sale + rental construction is in the pipeline within 1–3 miles? Heavy new supply typically softens prices + rents 12–24 months out; constrained supply supports both.
Investment metrics
- 1% rule
- 1.04% ✓
- Cap rate
- 9.12%
- Cash-on-cash
- 10.09%
- DSCR
- 1.45
- GRM
- 8.0
CMA / ARV
- ARV (on-the-fly)
- $714,025
- Comps found
- 2
Show comp detail 2 sales within ~0.75 mi
| Address | Dist | Beds/Ba | Sqft | Sold | Price | $/sf | Match |
|---|---|---|---|---|---|---|---|
| 83 Pond St | 0.12mi | 4/2.0 | 2,374 (+8%) | 2mo | $365,000 | $154 | 79 |
| 2840 Pennyroyal Rd | 0.39mi | 3/2.0 (-1) | 1,924 (-12%) | 5mo | $625,000 | $325 | 52 |
Match score weights: distance 35% · size 25% · config 20% · recency 20%. Top-matched comps best support the ARV.
Projected returns pro-forma
-3.0% appreciation · 3.0% rent growth · sell at horizon
- IRR
- -1.2%
- Equity multiple
- 0.95×
- Total profit
- $-3,775
- Equity at exit
- $44,582
- IRR
- 8.4%
- Equity multiple
- 1.64×
- Total profit
- $53,846
- Equity at exit
- $25,852
Cash invested: $83,720 (down + closing). Projections, not guarantees.
Landlord ↔ Tenant lean methodology
- Overall (STATE)
- 90 Strongly Landlord-Friendly
- State South Carolina
- 90 Strongly Landlord-Friendly · R+6
- County
- — inherits STATE
- City
- — inherits STATE
ZIP-level market 29440
- Home prices YoY
- -34.9%
- Active inventory
- 409
- Price-to-rent
- 8.0×
Monthly cashflow live
- Estimated rent
- $3,116 medium interval (Pro) →
- Mortgage (P&I)
- −$1,568
- Tax from tax record
- −$66 /mo · $789/yr
- Insurance
- −$125
- HOA
- −$0
- Vacancy / Maint / Mgmt
- −$654
- Net cashflow
- $704
Break-even live
UW: 25.0% down · 7.5% · 30yr · 1.5% tax · 5.0% vac · 8.0% maint · 8.0% mgmt
Financing live
Cash to close
- Down payment
- $74,750
- Closing costs
- $8,970
- Reserves months
- —
- Total cash needed
- —
Loan-product check · same deal, 3 products live
Conventional
25% down · 7.5% · 30yr
- Down + closing
- —
- Monthly P&I
- —
- Monthly cashflow
- —
- DSCR
- —
- Eligible?
- —
Personal DTI + credit; lowest rate.
DSCR
20% down · 8.5% · 30yr
- Down + closing
- —
- Monthly P&I
- —
- Monthly cashflow
- —
- DSCR
- —
- Eligible?
- —
No personal income docs; deal must DSCR.
Hard money
10% down · 12.0% · 12mo
- Down + closing
- —
- Monthly P&I
- —
- Monthly cashflow
- —
- DSCR
- —
- Eligible?
- —
Short-term bridge; refi at stabilization.
Listing history 21 events
-
2026-06-18days on market $299,000 Active 181 DOM
-
2026-06-17days on market $299,000 Active 180 DOM
-
2026-06-16days on market $299,000 Active 179 DOM
-
2026-06-15days on market $299,000 Active 178 DOM
-
2026-06-14days on market $299,000 Active 176 DOM
-
2026-06-10days on market $299,000 Active 173 DOM
-
2026-06-09days on market $299,000 Active 172 DOM
-
2026-06-08statusdays on market $299,000 Active 171 DOM
-
2026-06-07days on market $299,000 Active Under Contract 170 DOM
-
2026-06-03days on market $299,000 Active Under Contract 166 DOM
-
2026-06-02days on market $299,000 Active Under Contract 165 DOM
-
2026-06-01days on market $299,000 Active Under Contract 164 DOM
-
2026-05-31days on market $299,000 Active Under Contract 163 DOM
-
2026-05-30days on market $299,000 Active Under Contract 162 DOM
-
2026-05-20historical Active Under Contract
-
2026-04-06price $299,000
-
2025-12-17$324,900 Active
-
2025-12-04historical
-
2025-02-06$350,000 Active
-
2024-11-05historical
-
2024-05-29$375,000 Active
ⓘ Source: listings_history table (triggers on properties + properties_extension) + one-shot
backfill from property_details.listing_events for pre-trigger history.
Tax reassessment forecast SC · Resets to sale price
- Current annual tax
- $789 · $66/mo
- Projected year-2 tax
- $1,704 · $142/mo
- Expected delta
- +$915/yr (+$76/mo · 116.0%)
ⓘ Screening estimate from a state-policy table — verify with the county assessor before closing.
Climate risk First Street
- Flood 1/10 Low FEMA zone X (unshaded) · 0% chance over 30 yrs
- Wildfire 4/10 Moderate
- Heat 9/10 Extreme 7 d/yr ≥109°F today · 17 d/yr by 30 yrs out
- Wind 8/10 Severe 99% chance of damaging wind over 30 yrs
- Air quality 2/10 Low 1 unhealthy d/yr today · 2 by 30 yrs out
Nearby sold comps map
Loading sold comps map…
Walkable amenities ~0.75 mi
Loading nearby amenities…
Taxation est. · year 1
- Rental income
- $37,398
- − Mortgage interest
- −$16,749
- − Property taxes
- −$789
- − Insurance
- −$1,495
- − Repairs & maintenance
- −$2,992
- − Management
- −$2,992
- − Depreciation
- −$8,698
- Taxable income
- $3,683
- Est. tax owed @ 24.0%
- −$884
- After-tax cash flow
- $7,560/yr
For passive investors: Depreciation is non-cash, so a rental often shows a tax loss while cash-flowing — sheltering income. Rental losses are passive: they offset passive income freely, and up to $25,000/yr can offset ordinary (W-2) income if you actively participate and your MAGI is under $100k (phasing out to $0 by $150k); unused losses carry forward. On sale, claimed depreciation is recaptured at up to 25%, and gains may owe capital-gains tax (a 1031 exchange can defer both). Figures are a year-1 estimate at your 24.0% rate — not tax advice; consult a CPA.
Schools (NCES district)
- District
- Georgetown 01
- NCES district ID
- 4502280
- Math proficiency
- 26% ▼ -11.00%
- Reading proficiency
- 38% ▼ -5.00%
- Median HH income
- $43,045
- Composite
- 27.15/100
- National rank
- #7030
- State rank
- #51 of 80 in SC
Livability — Georgetown
- Score
- 65/100
- State rank
- #141
- US rank
- #13446
Category grades
Schools grade is shown separately in the Schools card above.
Census & demographics
- Population (ZIP)
- 26,419
Population outlook (Georgetown County) Hauer SSP2
- Today (2025)
- 63,275 people
- By 2030
- 63,630 · +0.6%
- By 2040
- 63,130 · -0.2%
- By 2050
- 61,904 · -2.2%
- By 2075
- 59,305 · -6.3%
- By 2100
- 53,852 · -14.9%
Race, ethnicity, and origin ACS 2023
- Neighborhood character
- Majority White (52%)
- Race & ethnicity
- White 52% Black 45% Hispanic / Latino 2%
- Common ancestry
- Italian 3% Lithuanian 2% Slovak 1%
- Foreign-born
- 3% · Canada
- Languages at home
- 97% English-only · Spanish 2%
Political lean MEDSL · Georgetown
- 2024 margin
- R (+19.5) · D 39.6% · R 59.1% · Other 1.2%
- 2008→2024 swing
- -14.2pp toward R · 2008: -5.2pp · 2024: -19.5pp
- All cycles
- 2024: R+19.5 2020: R+12.7 2016: R+13.0 2012: R+7.6 2008: R+5.2
Not yet ingested
- Civics
- —
Market trends
- HPI YoY
- ▼ -111.84%
- Current HPI
- 208.6792
- Rent YoY
- —
- Metro
- —
- State GDP YoY
- ▲ 4.51%
- F500 in state
- 2
Industry mix (Fortune 500 HQ in SC)
| Industry | F500 HQs | Revenue |
|---|---|---|
| Packaging | 1 | $7B |
|
||
Price history
-20.3% since first listed7 events — show timeline
- 2026-05-20 Contingent — CCAR
- 2026-04-06 Price Changed $299,000 CCAR
- 2025-12-17 Listed $324,900 CCAR
- 2025-12-04 Listing Removed — Charleston Trident MLS
- 2025-02-06 Listed $350,000 Charleston Trident MLS
- 2024-11-05 Listing Removed — Charleston Trident MLS
- 2024-05-29 Listed $375,000 Charleston Trident MLS
Property tax history
+4.3%/yrLatest (2025): $789 · +11.1% YoY. Source: county tax records.
Cash-flow waterfall
monthlySold comps — $/sqft
last 12 mo · ≤1 miLoading sold comps…