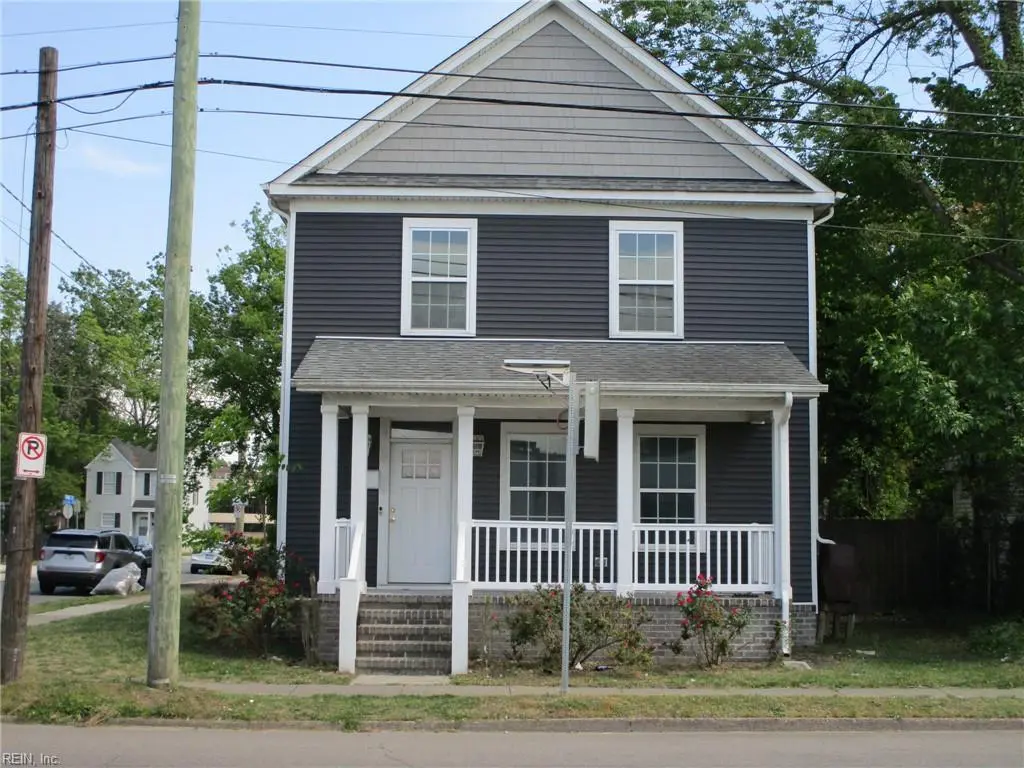
1700 Wilson Rd · Norfolk, VA
Flood risk 1/10 · Minimal
- FEMA flood zone
- X (unshaded)
- Chance of flooding over 30 yrs
- 0.0%
- Est. flood insurance / yr
- $507 – $1,088
Fire risk 1/10 · Minimal
- Est. fire insurance / yr
- $666 – $1,236
Heat risk 9/10 · Severe
- Hot days now (above 106°F)
- 7 days/yr
- Hot days in 30 yrs
- 16 days/yr
Wind risk 8/10 · Major
- Chance of severe wind over 30 yrs
- 80.0%
Air-quality risk 5/10 · Moderate
- Unhealthy air days now
- 6 days/yr
- Unhealthy air days in 30 yrs
- 7 days/yr
Risk factors via First Street. Map © Google.
Why this score? — see what drove the D+ grade
The composite is a weighted blend of 9 inputs, each scored 0–100. Each bar is that input's sub-score; the figure is the points it added to the 100-point composite (weight × sub-score).
- ARV discount +15.0/15.0
- Cash flow +12.9/30.0
- Livability +4.2/5.0
- 1% rule +3.9/10.0
- DSCR +3.9/10.0
- Schools +3.5/10.0
- Rent growth +2.5/5.0
- Condition / age +2.5/5.0
- Appreciation +0.0/10.0
$217,500
🖨 Deal sheet (PDF) 📄 Offer letter ✓ Due diligence
Listing remarks
Great property needing tlc to make it shine like new. Conveniently located being close to interstate, airport, Schools and shopping. Interior features primary bedroom on first and second floor, open floor plan with large kitchen dining area, and large living room great for entertaining.
Key facts
- Built 2020
- Listed 8 days
Property features AI
Finance
- HOA & community: No HOA or association fees
Exterior
- Parking: Driveway parking spaces
- Utilities: City/County water; City/County sewer; Electric water heater
- Home design: Detached colonial-style home; Two stories; City view
- Construction: Vinyl siding; Asphalt shingle roof; Crawl foundation; Simple ownership
- Exterior features: Corner lot; Back, partial, and privacy fencing; Porch; Storage shed
Interior
- Kitchen: Kitchen (details not specified)
- Bedrooms: Two bedrooms with ensuite; First-floor bedroom with full bathroom; Master bedroom on the first floor; Additional bedroom on the second floor
- Flooring: Laminate flooring; Wood flooring
- Bathrooms: Three full bathrooms; One half bathroom
- Heating & cooling: Heat pump for heating; Heat pump for cooling
- Interior features: Cable hookup; Pull-down attic stairs; Walk-in closet
- Laundry & utility: Utility room on the first floor
Neighborhood map
What this means for you Summary
Snapshot
- This is a 4-bed/3.5-bath single-family listed at $218k.
Deal economics
- At list price, monthly cash flow is $-14 ($-172/yr) — negative.
- To cash-flow at today's rent, offer at most $215k (1.2% below list).
- To meet the 1% rule (rent ≥ 1% of price), the offer needs to be $193k (11.2% below list).
- Recommended offer: $193k (11.2% below list) — sets the bar for 1% rule.
- Cap rate 6.2% vs local median 4.0% in Norfolk — top-decile yield for the area; either an underpriced asset or a hidden risk that comps aren't pricing in. Stress-test before assuming the spread holds.
Location & tenants
- Location reads 83/100 on livability (#43 in VA, #1,026 nationally) — a professional / high-income tenant draw. Strengths: amenities A+, commute A+, health & safety A+; Watch: employment C-, crime F.
- Norfolk City Public School District (urban): math 27% / reading 56% proficiency, ranked #118 of 131 in VA (top 90%) — families likely to look elsewhere, expect single-tenant / working-renter base with shorter leases.
- Zoned schools: Southside Stem Academy At Campostella (math 11% / reading 37%, grade F, #1,064 of 1,108 statewide, top 96%, 737 students, 95% FRL); Lake Taylor (math 22% / reading 45%, grade F, #984 of 1,108 statewide, top 89%, 626 students, 96% FRL); Lake Taylor High (math 38% / reading 72%, grade C, #279 of 319 statewide, top 88%, 1,030 students, 92% FRL) — zoned schools average 94% FRL vs 59% district-wide (36 pts higher); higher-poverty schools than district average — tighter screening recommended.
- Market conditions: 25 active listings in the ZIP; 28 comparable units currently listed for rent nearby; rentals at typical pace (median 26d on market — plan ~3-4 weeks tenant-placement turnaround); 438 units permitted in Norfolk city in 2024 (273 in 5+ unit buildings).
Forward outlook
- Local home prices are declining (-3.0%/yr); year-one equity from $2k of loan paydown is wiped out by about $7k of value loss. Plan a longer hold.
Negotiation context
- Only 8 days on market — expect competitive offers; lowballing is unlikely to land.
- 2 sale attempts since 6y ago with the ask held roughly flat each time — persistent listings suggest the price (not the market) is what's stuck; bring a comps-based counter.
- Current owner paid $89k; list at $218k implies a 144% gain — meaningful room to come down on a strong offer.
Risks & watch-outs
- Climate carrying-cost: severe wind risk, 80% chance of damaging wind over 30y; extreme-heat days projected 7→16/yr by 2055 (HVAC capex compounding) — expect insurance premiums to compound above CPI over the hold.
Questions for the listing agent
- What do current leases actually rent for vs. the listed asking? Can we see a recent rent roll and the last 12 months of T-12 income?
- Is there a deadline driving the sale (1031 exchange, divorce, estate, relocation)? That informs how much negotiation room exists.
- Schools are A-rated — typically a magnet for longer-tenancy family renters. What's the average tenant stay here, and is there a school-zone premium baked into asking?
- Crime grade is F in this area — have there been break-ins, vandalism, or insurance claims at this property in the last 3 years? What carrier currently insures it and at what premium?
- The area grade is low — what's the realistic commute time and amenity access for the typical tenant pool here? Any planned neighborhood developments (good or bad) we should know about?
- What's the average days-on-market for RENTAL listings here right now (not sales)? A rising rental-DOM trend means longer vacancies and softer asking-rent achievability than the comps imply.
- What's the recent tenant-quality profile in this submarket — average credit score on applications, eviction rate, late-payment / NSF rate, and stable-employment percentage? A property-management company in the area should have these aggregated.
- How much new for-sale + rental construction is in the pipeline within 1–3 miles? Heavy new supply typically softens prices + rents 12–24 months out; constrained supply supports both.
Investment metrics
- 1% rule
- 0.89% ✗
- Cap rate
- 6.21%
- Cash-on-cash
- -0.28%
- DSCR
- 0.99
- GRM
- 9.4
CMA / ARV
- ARV (on-the-fly)
- $334,512
- Comps found
- 12
Show comp detail 12 sales within ~0.75 mi
| Address | Dist | Beds/Ba | Sqft | Sold | Price | $/sf | Match |
|---|---|---|---|---|---|---|---|
| 1623 Conoga St | 0.04mi | 4/3.5 | 1,648 (+2%) | 5mo | $370,000 | $225 | 91 |
| 1302 Hatton St | 0.13mi | 3/2.0 (-1) | 1,600 (-1%) | 2mo | $310,000 | $194 | 80 |
| 1608 Selden Ave | 0.05mi | 3/2.5 (-1) | 1,519 (-6%) | 1mo | $315,000 | $207 | 78 |
| 1300 Cass St | 0.26mi | 4/2.5 | 1,500 (-7%) | 2mo | $315,000 | $210 | 70 |
| 1510 Landsworth St | 0.29mi | 3/2.0 (-1) | 1,722 (+7%) | 1mo | $357,000 | $207 | 64 |
| 2130 Berkley Ave | 0.45mi | 4/3.0 | 1,770 (+10%) | 0mo | $351,000 | $198 | 60 |
| 1608 Colon Ave | 0.34mi | 3/1.0 (-1) | 1,500 (-7%) | 4mo | $115,500 | $77 | 54 |
| 1133 Oldwood St | 0.68mi | 4/2.5 | 1,486 (-8%) | 3mo | $311,000 | $209 | 48 |
| 910 Fairfield St | 0.43mi | 4/1.5 | 1,406 (-13%) | 4mo | $234,700 | $167 | 47 |
| 913 Annette St | 0.52mi | 3/2.5 (-1) | 1,422 (-12%) | 3mo | $323,000 | $227 | 44 |
| 1725 Canton Ave | 0.54mi | 3/1.5 (-1) | 1,460 (-10%) | 3mo | $205,000 | $140 | 43 |
| 511 Appomattox Ave | 0.47mi | 3/1.5 (-1) | 1,400 (-13%) | 1mo | $249,700 | $178 | 42 |
Match score weights: distance 35% · size 25% · config 20% · recency 20%. Top-matched comps best support the ARV.
Projected returns pro-forma
-3.0% appreciation · 3.0% rent growth · sell at horizon
- IRR
- -16.7%
- Equity multiple
- 0.41×
- Total profit
- $-36,105
- Equity at exit
- $32,430
- IRR
- -8.5%
- Equity multiple
- 0.47×
- Total profit
- $-32,405
- Equity at exit
- $18,805
Cash invested: $60,900 (down + closing). Projections, not guarantees.
Landlord ↔ Tenant lean methodology
- Overall (STATE)
- 55 Moderately Landlord-Leaning
- State Virginia
- 55 Moderately Landlord-Leaning · D+2
- County
- — inherits STATE
- City
- — inherits STATE
ZIP-level market 23523
- Home prices YoY
- -16.6%
- Active inventory
- 25
- Price-to-rent
- 9.4×
Monthly cashflow live
- Estimated rent
- $1,931 high interval (Pro) →
- Mortgage (P&I)
- −$1,141
- Tax from tax record
- −$308 /mo · $3,699/yr
- Insurance
- −$91
- HOA
- −$0
- Vacancy / Maint / Mgmt
- −$405
- Net cashflow
- $-14
Break-even live
Sensitivity live
| Price | -10% $109 | -5% $47 | +0% $-14 | +5% $-76 | +10% $-137 |
|---|---|---|---|---|---|
| Rent | -10% $-167 | -5% $-91 | +0% $-14 | +5% $62 | +10% $138 |
| Rate | -1.0pp $95 | -0.5pp $41 | base $-14 | +0.5pp $-71 | +1.0pp $-128 |
UW: 25.0% down · 7.5% · 30yr · 1.5% tax · 5.0% vac · 8.0% maint · 8.0% mgmt
Financing live
Cash to close
- Down payment
- $54,375
- Closing costs
- $6,525
- Reserves months
- —
- Total cash needed
- —
Loan-product check · same deal, 3 products live
Conventional
25% down · 7.5% · 30yr
- Down + closing
- —
- Monthly P&I
- —
- Monthly cashflow
- —
- DSCR
- —
- Eligible?
- —
Personal DTI + credit; lowest rate.
DSCR
20% down · 8.5% · 30yr
- Down + closing
- —
- Monthly P&I
- —
- Monthly cashflow
- —
- DSCR
- —
- Eligible?
- —
No personal income docs; deal must DSCR.
Hard money
10% down · 12.0% · 12mo
- Down + closing
- —
- Monthly P&I
- —
- Monthly cashflow
- —
- DSCR
- —
- Eligible?
- —
Short-term bridge; refi at stabilization.
Rent comps 28 comps
| Address | Beds | Baths | Sqft | Rent | $/sqft | DOM | Units | Dist |
|---|---|---|---|---|---|---|---|---|
| 1510 Wilson Rd Unit 1 Norfolk, VA | 3.0 | 1.0 | 1100 | $1,325 | $1.20 | 25d | 1 | 0.14mi |
| 1510 Wilson Rd #4 Norfolk, VA | 3.0 | 1.0 | 1273 | $1,400 | $1.10 | 22d | 1 | 0.14mi |
| 1510 Wilson Rd Unit 3 Norfolk, VA | 3.0 | 1.0 | 1273 | $1,200 | $0.94 | 45d | 1 | 0.14mi |
| 1729 Todd St Norfolk, VA | 3.0 | 2.5 | 2000 | $2,450 | $1.23 | 25d | 1 | 0.20mi |
| 1512 Marsh St Norfolk, VA | 3.0 | 2.5 | 1727 | $2,195 | $1.27 | 45d | 1 | 0.34mi |
| 1009 Elkin St Norfolk, VA | 4.0 | 2.5 | 1914 | $2,500 | $1.31 | 14d | 1 | 0.43mi |
| 722 Culpepper St Norfolk, VA | 5.0 | 4.0 | 1742 | $2,550 | $1.46 | 45d | 1 | 0.70mi |
| 1108 Jackson Ave Chesapeake, VA | 3.0 | 2.0 | 1784 | $2,100 | $1.18 | 6d | 1 | 0.74mi |
| 413 Walker Ave Norfolk, VA | 5.0 | 3.5 | 2200 | $3,500 | $1.59 | 45d | 1 | 0.81mi |
| 1008 Grayson St Norfolk, VA | 3.0 | 2.0 | 2200 | $2,495 | $1.13 | 45d | 1 | 0.92mi |
| 127 Poplar Ave Unit 1 Norfolk, VA | 3.0 | 2.0 | 1700 | $2,199 | $1.29 | 25d | 1 | 0.95mi |
| 1231 Stewart St Chesapeake, VA | 4.0 | 2.5 | 2159 | $2,550 | $1.18 | 5d | 1 | 0.98mi |
| 201 Bellamy Ave Norfolk, VA | 5.0 | 2.5 | 2200 | $2,750 | $1.25 | 45d | 1 | 0.99mi |
| 1151 Perry St Chesapeake, VA | 3.0 | 1.0 | 1296 | $2,000 | $1.54 | 19d | 1 | 1.02mi |
| 1110 Park Ave Unit 23324 Chesapeake, VA | 3.0 | 2.0 | 1749 | $2,200 | $1.26 | 25d | 1 | 1.03mi |
| 1110 Park Ave Chesapeake, VA | 3.0 | 2.0 | 1749 | $2,100 | $1.20 | 16d | 1 | 1.03mi |
| 701 S Main St Norfolk, VA | 3.0 | 2.0 | 1076 | $1,349 | $1.25 | 3d | 2 | 1.05mi |
| 329 S Main St Norfolk, VA | 3.0 | 3.0 | 1652 | $3,000 | $1.82 | 45d | 1 | 1.08mi |
| 2624 Chesterfield Blvd Norfolk, VA | 4.0 | 1.5 | 1512 | $2,000 | $1.32 | 45d | 1 | 1.16mi |
| 2800 Chesterfield Blvd Norfolk, VA | 3.0 | 2.5 | 1760 | $2,400 | $1.36 | 6d | 1 | 1.21mi |
| 2638 King Ct Chesapeake, VA | 3.0 | 1.5 | 1462 | $2,000 | $1.37 | 22d | 1 | 1.23mi |
| 2620 Sunrise Ave Chesapeake, VA | 3.0 | 1.5 | 1462 | $1,850 | $1.27 | 25d | 1 | 1.26mi |
| 720 Forbes St Norfolk, VA | 3.0 | 2.0 | 1056 | $2,195 | $2.08 | 16d | 1 | 1.31mi |
| 720 Forbes St Norfolk, VA | 3.0 | 2.0 | 1056 | $2,250 | $2.13 | 45d | 1 | 1.31mi |
| 2806 Kimball Ter Norfolk, VA | 3.0 | 2.5 | 1700 | $2,100 | $1.24 | 46d | 1 | 1.32mi |
| 2841 Earlscourt Ave Norfolk, VA | 4.0 | 2.0 | 1404 | $2,000 | $1.42 | 5d | 1 | 1.48mi |
| 2841 Earlscourt Ave Norfolk, VA | 4.0 | 2.0 | 1404 | $2,000 | $1.42 | 4d | 1 | 1.48mi |
| 2808 Westminster Ave Norfolk, VA | 4.0 | 2.0 | 1988 | $2,295 | $1.15 | 25d | 1 | 1.49mi |
Listing history 6 events
-
2026-04-30status Under Contract
-
2026-04-21$217,500 Active
-
2020-07-14status Under Contract
-
2020-06-24historical Active Under Contract
-
2020-05-07$249,900 Active
-
2009-10-01soldstatus $89,000
ⓘ Source: listings_history table (triggers on properties + properties_extension) + one-shot
backfill from property_details.listing_events for pre-trigger history.
Tax reassessment forecast VA · Resets to sale price
- Current annual tax
- $3,699 · $308/mo
- Projected year-2 tax
- $3,699 · $308/mo
- Expected delta
- $0/yr ($0/mo · 0.0%)
ⓘ Screening estimate from a state-policy table — verify with the county assessor before closing.
Climate risk First Street
- Flood 1/10 Low FEMA zone X (unshaded) · 0% chance over 30 yrs
- Wildfire 1/10 Low
- Heat 9/10 Extreme 7 d/yr ≥106°F today · 16 d/yr by 30 yrs out
- Wind 8/10 Severe 80% chance of damaging wind over 30 yrs
- Air quality 5/10 Major 6 unhealthy d/yr today · 7 by 30 yrs out
Nearby sold comps map
Loading sold comps map…
Walkable amenities ~0.75 mi
Loading nearby amenities…
Taxation est. · year 1
- Rental income
- $23,166
- − Mortgage interest
- −$12,183
- − Property taxes
- −$3,699
- − Insurance
- −$1,088
- − Repairs & maintenance
- −$1,853
- − Management
- −$1,853
- − Depreciation
- −$6,327
- Taxable loss
- −$3,837
- Est. tax savings @ 24.0%
- +$921
- After-tax cash flow
- $749/yr
For passive investors: Depreciation is non-cash, so a rental often shows a tax loss while cash-flowing — sheltering income. Rental losses are passive: they offset passive income freely, and up to $25,000/yr can offset ordinary (W-2) income if you actively participate and your MAGI is under $100k (phasing out to $0 by $150k); unused losses carry forward. On sale, claimed depreciation is recaptured at up to 25%, and gains may owe capital-gains tax (a 1031 exchange can defer both). Figures are a year-1 estimate at your 24.0% rate — not tax advice; consult a CPA.
Schools (NCES district)
- District
- Norfolk City Public School District
- NCES district ID
- 5102670
- Math proficiency
- 27% ▼ -44.00%
- Reading proficiency
- 56% ▼ -10.00%
- Median HH income
- $44,358
- Composite
- 35.08/100
- National rank
- #5026
- State rank
- #118 of 131 in VA
Livability — Norfolk
- Score
- 83/100
- State rank
- #43
- US rank
- #1026
Category grades
Schools grade is shown separately in the Schools card above.
Census & demographics
- Census place
- Norfolk, VA
- City population
- 214,042
- Population (ZIP)
- 7,698
Population outlook (Norfolk County) Hauer SSP2
- Today (2025)
- 249,032 people
- By 2030
- 252,347 · +1.3%
- By 2040
- 253,644 · +1.9%
- By 2050
- 251,913 · +1.2%
- By 2075
- 245,281 · -1.5%
- By 2100
- 219,548 · -11.8%
Race, ethnicity, and origin ACS 2023
- Neighborhood character
- Predominantly Black (87%)
- Race & ethnicity
- Black 87% White 7% Two or more races 5% Hispanic / Latino 2%
- Common ancestry
- Romanian 1%
- Foreign-born
- 2% · Canada
- Languages at home
- 94% English-only · Spanish 3% Other Indo-European 1%
Political lean MEDSL · Norfolk
- 2024 margin
- Solid D (+41.5) · D 70.0% · R 28.5% · Other 1.6%
- 2008→2024 swing
- -1.4pp toward R · 2008: 43.0pp · 2024: 41.5pp
- All cycles
- 2024: D+41.5 2020: D+45.6 2016: D+42.0 2012: D+44.0 2008: D+43.0
Not yet ingested
- Civics
- —
Market trends
- HPI YoY
- ▼ -53.73%
- Current HPI
- 269.0309
- Rent YoY
- —
- Metro
- —
- State GDP YoY
- ▲ 2.40%
- F500 in state
- 50
Industry mix (Fortune 500 HQ in VA)
| Industry | F500 HQs | Revenue |
|---|---|---|
| Aerospace / Defense | 4 | $236B |
|
||
| Technology / Defense | 3 | $32B |
|
||
| Financial Services | 2 | $176B |
|
||
| Utilities | 2 | $27B |
|
||
| Insurance | 2 | $25B |
|
||
| Technology | 2 | $15B |
|
||
Price history
+144.4% since first listed6 events — show timeline
- 2026-04-30 Pending — REINMLS
- 2026-04-21 Listed $217,500 REINMLS
- 2020-07-14 Pending — REINMLS
- 2020-06-24 Contingent — REINMLS
- 2020-05-07 Listed $249,900 REINMLS
- 2009-10-01 Sold (Public Records) $89,000 Public Records
Property tax history
+5.7%/yrLatest (2025): $3,699 · +8.0% YoY. Source: county tax records.
Cash-flow waterfall
monthlySold comps — $/sqft
last 12 mo · ≤1 miLoading sold comps…