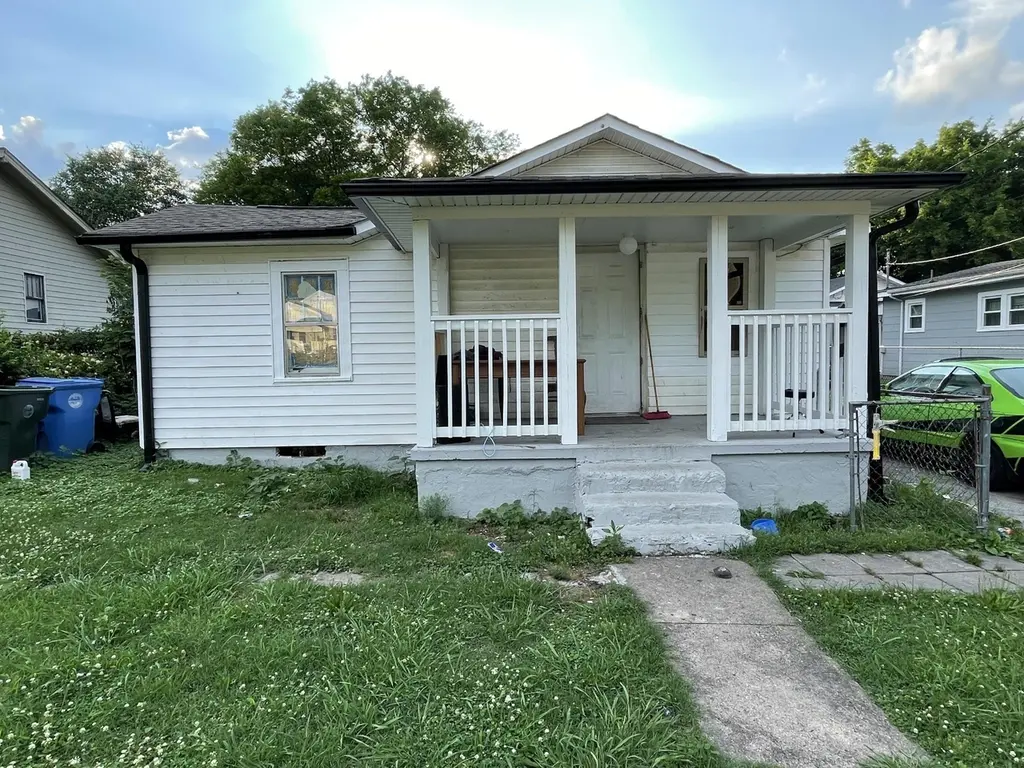
3513 3rd Ave Ave · Chattanooga, TN
Flood risk 9/10 · Severe
- FEMA flood zone
- X (unshaded)
- Chance of flooding over 30 yrs
- 0.99%
- Est. flood insurance / yr
- $507 – $1,088
Fire risk 1/10 · Minimal
- Est. fire insurance / yr
- $949 – $1,763
Heat risk 6/10 · Moderate
- Hot days now (above 104°F)
- 7 days/yr
- Hot days in 30 yrs
- 20 days/yr
Wind risk 4/10 · Minor
- Chance of severe wind over 30 yrs
- 11.0%
Air-quality risk 3/10 · Minor
- Unhealthy air days now
- 2 days/yr
- Unhealthy air days in 30 yrs
- 2 days/yr
Risk factors via First Street. Map © Google.
Why this score? — see what drove the B grade
The composite is a weighted blend of 9 inputs, each scored 0–100. Each bar is that input's sub-score; the figure is the points it added to the 100-point composite (weight × sub-score).
- Cash flow +30.0/30.0
- ARV discount +15.0/15.0
- DSCR +10.0/10.0
- 1% rule +8.2/10.0
- Livability +3.9/5.0
- Schools +2.7/10.0
- Rent growth +2.5/5.0
- Condition / age +2.5/5.0
- Appreciation +0.0/10.0
$79,900
🖨 Deal sheet 📄 Offer letter ✓ Due diligence
Listing remarks
Investors Only! Call me to get the keys to your next investment. Located in growing, greater, Chattanooga! The place where social media businessman, Gary Vaynerchuck, has chosen to make home to one of his companies. If that doesn't scream LOCATION LOCATION LOCATION, I dont know what else will. A small price for a huge ownership in the city of Chattanooga. Your home comes with two standard sized beds, one full bathroom, a seperate livingroom, and kitchen! Decide whether you want to keep the tenants and enjoy the passive income, or put a little work and profit off amazing appreciation!
Key facts
- 7,159 sq ft lot
- Built 1940
Neighborhood map
What this means for you Summary
Snapshot
- This is a 2-bed/1.0-bath single-family listed at $80k.
Deal economics
- At list price, monthly cash flow is $286 ($3k/yr) — positive.
- The deal already cash-flows at list — no discount required.
- Meets the 1% rule at list price ($1k rent vs $80k).
- Cap rate 11.6% vs local median 3.4% in Chattanooga — top-decile yield for the area; either an underpriced asset or a hidden risk that comps aren't pricing in. Stress-test before assuming the spread holds.
Location & tenants
- Location reads 78/100 on livability (#3 in TN, #2,582 nationally) — a middle-class / working-renter tenant base. Strengths: amenities A+, commute A+, cost of living A+; Watch: employment D+, crime F.
- Hamilton County (urban): math 31% / reading 31% proficiency, ranked #42 of 139 in TN (top 30%) — families likely to look elsewhere, expect single-tenant / working-renter base with shorter leases.
- Zoned schools: Clifton Hills Elementary (math 27% / reading 12%, grade F, #654 of 952 statewide, top 72%, 668 students, 0% FRL); East Lake Academy of Fine Arts (math 4% / reading 6%, grade F, #295 of 333 statewide, top 91%, 528 students, 0% FRL) — zoned schools average 0% FRL vs 52% district-wide (52 pts lower); this property's tenant base skews higher-income than the district average.
- Zoned-school proficiency averages 12% at this address vs 31% district-wide (-19 pts) — the specific schools serving this property underperform the Hamilton County average; the district grade overstates school quality for this exact location.
- Market conditions: 40 active listings in the ZIP; 23 comparable units currently listed for rent nearby; rentals at typical pace (median 24d on market — plan ~3-4 weeks tenant-placement turnaround); 2,133 units permitted in Hamilton County in 2024 (405 in 5+ unit buildings).
Forward outlook
- Local home prices are declining (-3.0%/yr); year-one equity from $552 of loan paydown is wiped out by about $2k of value loss. Plan a longer hold.
- Hamilton County population projected at +23% by 2050 — long-run rental-demand tailwind backs the buy-and-hold thesis.
- At projected returns (-3.0% appreciation + 3.0% rent growth), your $22k cash investment doubles in ~8 years — after that, you're playing with house money.
Negotiation context
- Only 1 days on market — expect competitive offers; lowballing is unlikely to land.
- 2 sale attempts since 5y ago with the ask held roughly flat each time — persistent listings suggest the price (not the market) is what's stuck; bring a comps-based counter.
Risks & watch-outs
- Watch-outs: flood insurance adds $66/mo; built in 1940 — expect roof / HVAC / electrical / plumbing capex.
- Climate carrying-cost: severe flood risk; extreme-heat days projected 7→20/yr by 2055 (HVAC capex compounding) — expect insurance premiums to compound above CPI over the hold.
Questions for the listing agent
- Built in 1940 — when were the roof, HVAC, electrical panel, plumbing, and water heater last replaced?
- What's the actual annual flood-insurance premium (NFIP or private), and is the property in a SFHA with mandatory coverage?
- Is there a deadline driving the sale (1031 exchange, divorce, estate, relocation)? That informs how much negotiation room exists.
- Schools are F-rated, which usually means shorter tenancies and higher turnover. Who's the typical renter profile here, and what's been the actual vacancy rate?
- Crime grade is F in this area — have there been break-ins, vandalism, or insurance claims at this property in the last 3 years? What carrier currently insures it and at what premium?
- What's the average days-on-market for RENTAL listings here right now (not sales)? A rising rental-DOM trend means longer vacancies and softer asking-rent achievability than the comps imply.
- What's the recent tenant-quality profile in this submarket — average credit score on applications, eviction rate, late-payment / NSF rate, and stable-employment percentage? A property-management company in the area should have these aggregated.
- How much new for-sale + rental construction is in the pipeline within 1–3 miles? Heavy new supply typically softens prices + rents 12–24 months out; constrained supply supports both.
Investment metrics
- 1% rule
- 1.32% ✓
- Cap rate
- 11.59%
- Cash-on-cash
- 18.90%
- DSCR
- 1.84
- GRM
- 6.3
CMA / ARV
- ARV (on-the-fly)
- $140,096
- Comps found
- 3
Show comp detail 3 sales within ~0.75 mi
| Address | Dist | Beds/Ba | Sqft | Sold | Price | $/sf | Match |
|---|---|---|---|---|---|---|---|
| 1204 E 35th St | 0.53mi | 3/1.0 (+1) | 832 (+4%) | 1mo | $178,000 | $214 | 62 |
| 3907 06th Ave | 0.35mi | 2/1.0 | 868 (+9%) | 9mo | $60,000 | $69 | 61 |
| 2910 Faxon St | 0.63mi | 2/1.0 | 768 (-4%) | 11mo | $134,800 | $176 | 56 |
Match score weights: distance 35% · size 25% · config 20% · recency 20%. Top-matched comps best support the ARV.
Projected returns pro-forma
-3.0% appreciation · 3.0% rent growth · sell at horizon
- IRR
- 6.1%
- Equity multiple
- 1.24×
- Total profit
- $5,278
- Equity at exit
- $11,913
- IRR
- 15.5%
- Equity multiple
- 2.26×
- Total profit
- $28,103
- Equity at exit
- $6,908
Cash invested: $22,372 (down + closing). Projections, not guarantees.
Landlord ↔ Tenant lean methodology
- Overall (STATE)
- 87 Strongly Landlord-Friendly
- State Tennessee
- 87 Strongly Landlord-Friendly · R+13
- County
- — inherits STATE
- City
- — inherits STATE
ZIP-level market 37407
- Home prices YoY
- -8.1%
- Active inventory
- 40
- Price-to-rent
- 6.3×
Monthly cashflow live
- Estimated rent
- $1,057 high interval (Pro) →
- Mortgage (P&I)
- −$419
- Tax from tax record
- −$30 /mo · $364/yr
- Insurance
- −$33
- Flood insurance flood zone
- −$66 /mo · $798/yr
- HOA
- −$0
- Vacancy / Maint / Mgmt
- −$222
- Net cashflow
- $286
Break-even live
UW: 25.0% down · 7.5% · 30yr · 1.5% tax · 5.0% vac · 8.0% maint · 8.0% mgmt
Financing live
Cash to close
- Down payment
- $19,975
- Closing costs
- $2,397
- Reserves months
- —
- Total cash needed
- —
Loan-product check · same deal, 3 products live
Conventional
25% down · 7.5% · 30yr
- Down + closing
- —
- Monthly P&I
- —
- Monthly cashflow
- —
- DSCR
- —
- Eligible?
- —
Personal DTI + credit; lowest rate.
DSCR
20% down · 8.5% · 30yr
- Down + closing
- —
- Monthly P&I
- —
- Monthly cashflow
- —
- DSCR
- —
- Eligible?
- —
No personal income docs; deal must DSCR.
Hard money
10% down · 12.0% · 12mo
- Down + closing
- —
- Monthly P&I
- —
- Monthly cashflow
- —
- DSCR
- —
- Eligible?
- —
Short-term bridge; refi at stabilization.
Rent comps 23 comps
| Address | Beds | Baths | Sqft | Rent | $/sqft | DOM | Units | Dist |
|---|---|---|---|---|---|---|---|---|
| 2904 E 37th St Chattanooga, TN | 1.0 | 1.0 | 800 | $850 | $1.06 | 23d | 1 | 0.57mi |
| 3114 14th Ave Apt A Chattanooga, TN | 1.0 | 1.0 | 800 | $950 | $1.19 | 23d | 1 | 0.73mi |
| 3308 Roadrunner Trl Chattanooga, TN | 2.0 | 2.0 | 1000 | $1,323 | $1.32 | 23d | 1 | 0.88mi |
| 2903 15th Ave Chattanooga, TN | 2.0 | 1.5 | 1100 | $1,450 | $1.32 | 23d | 1 | 0.93mi |
| 2609 14th Ave Unit 3 Chattanooga, TN | 1.0 | 1.0 | 616 | $850 | $1.38 | 23d | 1 | 0.98mi |
| 2602 14th Ave Unit B Chattanooga, TN | 2.0 | 1.0 | 700 | $1,050 | $1.50 | 23d | 1 | 1.00mi |
| 3380 Shadowlawn Dr Unit 2 Chattanooga, TN | 2.0 | 2.0 | 629 | $1,323 | $2.10 | 14d | 1 | 1.07mi |
| 3392 Shadowlawn Dr Unit A East Ridge, TN | 1.0 | 1.0 | 800 | $1,003 | $1.25 | 14d | 1 | 1.08mi |
| 2417 13th Ave Chattanooga, TN | 2.0 | 1.0 | 950 | $1,150 | $1.21 | 23d | 1 | 1.10mi |
| 3403 Gail Dr Chattanooga, TN | 2.0 | 1.5 | 1000 | $1,425 | $1.43 | 14d | 1 | 1.13mi |
| 4129 Quinn Adams St Unit 2 Chattanooga, TN | 2.0 | 1.0 | 856 | $1,050 | $1.23 | 23d | 1 | 1.14mi |
| 3603 Dorris St Chattanooga, TN | 2.0 | 1.0 | 700 | $825 | $1.18 | 23d | 1 | 1.15mi |
| 3605 Dorris St Chattanooga, TN | 2.0 | 1.0 | 700 | $825 | $1.18 | 23d | 1 | 1.15mi |
| 3414 Betty Ln Chattanooga, TN | 2.0 | 1.5 | 1117 | $1,295 | $1.16 | 23d | 1 | 1.16mi |
| 3713 Dorris St Chattanooga, TN | 3.0 | 1.0 | 974 | $1,025 | $1.05 | 14d | 1 | 1.17mi |
| 2400 15th Ave Unit 336 Chattanooga, TN | 1.0 | 1.0 | 625 | $950 | $1.52 | 23d | 1 | 1.24mi |
| 4113 Dorris St Apt B Chattanooga, TN | 2.0 | 1.0 | 750 | $950 | $1.27 | 23d | 1 | 1.24mi |
| 2001 S Lyerly St Chattanooga, TN | 2.0–3.0 | 2.0 | 1080 | $1,200 | $1.11 | 14d | 6 | 1.30mi |
| 515 W Gordon Ave Rossville, GA | 2.0 | 1.0 | 906 | $999 | $1.10 | 44d | 1 | 1.35mi |
| 2612 E 19th St Chattanooga, TN | 2.0 | 1.0 | 900 | $1,150 | $1.28 | 23d | 1 | 1.41mi |
| 915 S Seminole Dr Chattanooga, TN | 2.0 | 1.0 | 800 | $825 | $1.03 | 14d | 3 | 1.41mi |
| 1020 Wynnwood Rd Chattanooga, TN | 2.0 | 1.0 | 797 | $1,173 | $1.47 | 23d | 1 | 1.42mi |
| 1818 Dodds Ave Chattanooga, TN | 2.0 | 1.0 | 1036 | $1,099 | $1.06 | 14d | 1 | 1.43mi |
Listing history 9 events
-
2024-09-25status Pending
-
2023-09-06soldstatus $75,000
-
2022-03-28soldstatus $65,000
-
2022-03-05historical
-
2022-02-26status Active
-
2022-01-07historical Contingent
-
2021-12-19$79,900 Active
-
2012-12-14soldstatus $29,000
-
1988-09-09soldstatus $7,500
ⓘ Source: listings_history table (triggers on properties + properties_extension) + one-shot
backfill from property_details.listing_events for pre-trigger history.
Tax reassessment forecast TN · Resets to sale price
- Current annual tax
- $364 · $30/mo
- Projected year-2 tax
- $567 · $47/mo
- Expected delta
- +$204/yr (+$17/mo · 55.9%)
ⓘ Screening estimate from a state-policy table — verify with the county assessor before closing.
Climate risk First Street
- Flood 9/10 Extreme FEMA zone X (unshaded) · 99% chance over 30 yrs
- Wildfire 1/10 Low
- Heat 6/10 Major 7 d/yr ≥104°F today · 20 d/yr by 30 yrs out
- Wind 4/10 Moderate 11% chance of damaging wind over 30 yrs
- Air quality 3/10 Moderate 2 unhealthy d/yr today · 2 by 30 yrs out
Nearby sold comps map
Loading sold comps map…
Walkable amenities ~0.75 mi
Loading nearby amenities…
Taxation est. · year 1
- Rental income
- $12,684
- − Mortgage interest
- −$4,476
- − Property taxes
- −$364
- − Insurance
- −$1,197
- − Repairs & maintenance
- −$1,015
- − Management
- −$1,015
- − Depreciation
- −$2,324
- Taxable income
- $2,293
- Est. tax owed @ 24.0%
- −$550
- After-tax cash flow
- $2,881/yr
For passive investors: Depreciation is non-cash, so a rental often shows a tax loss while cash-flowing — sheltering income. Rental losses are passive: they offset passive income freely, and up to $25,000/yr can offset ordinary (W-2) income if you actively participate and your MAGI is under $100k (phasing out to $0 by $150k); unused losses carry forward. On sale, claimed depreciation is recaptured at up to 25%, and gains may owe capital-gains tax (a 1031 exchange can defer both). Figures are a year-1 estimate at your 24.0% rate — not tax advice; consult a CPA.
Schools (NCES district)
- District
- Hamilton County
- NCES district ID
- 4701590
- Math proficiency
- 31% ▼ -10.00%
- Reading proficiency
- 31% ▼ -3.00%
- Median HH income
- $47,456
- Composite
- 26.8/100
- National rank
- #7122
- State rank
- #42 of 139 in TN
Livability — Chattanooga
- Score
- 78/100
- State rank
- #3
- US rank
- #2582
Category grades
Schools grade is shown separately in the Schools card above.
Census & demographics
- Census place
- Chattanooga, TN
- City population
- 131,999
- Population (ZIP)
- 10,164
Population outlook (Hamilton County) Hauer SSP2
- Today (2025)
- 393,784 people
- By 2030
- 412,983 · +4.9%
- By 2040
- 449,502 · +14.1%
- By 2050
- 484,341 · +23.0%
- By 2075
- 565,746 · +43.7%
- By 2100
- 618,394 · +57.0%
Race, ethnicity, and origin ACS 2023
- Neighborhood character
- Diverse neighborhood (Simpson 0.68)
- Race & ethnicity
- Hispanic / Latino 43% White 29% Black 22% Two or more races 14%
- Hispanic origin (detail)
- Mexican 9%
- Common ancestry
- Serbian 1% Slovak 1% Lithuanian 1%
- Foreign-born
- 27% · Canada
- Languages at home
- 52% English-only · Spanish 43% Arabic 3%
Political lean MEDSL · Hamilton
- 2024 margin
- R (+13.1) · D 42.7% · R 55.7% · Other 1.6%
- 2008→2024 swing
- -1.2pp toward R · 2008: -11.8pp · 2024: -13.1pp
- All cycles
- 2024: R+13.1 2020: R+9.7 2016: R+16.6 2012: R+14.8 2008: R+11.8
Not yet ingested
- Civics
- —
Market trends
- HPI YoY
- ▼ -18.82%
- Current HPI
- 212.4869
- Rent YoY
- —
- Metro
- —
- State GDP YoY
- ▲ 2.78%
- F500 in state
- 22
Industry mix (Fortune 500 HQ in TN)
| Industry | F500 HQs | Revenue |
|---|---|---|
| Healthcare | 3 | $91B |
|
||
| Retail | 3 | $72B |
|
||
| Transportation / Logistics | 1 | $88B |
|
||
| Paper / Packaging | 1 | $19B |
|
||
| Insurance | 1 | $13B |
|
||
| Energy | 1 | $12B |
|
||
Price history
+900.0% since first listed9 events — show timeline
- 2024-09-25 Pending — GCAR
- 2023-09-06 Sold (Public Records) $75,000 Public Records
- 2022-03-28 Sold (Public Records) $65,000 Public Records
- 2022-03-05 Delisted — GCAR
- 2022-02-26 Relisted — GCAR
- 2022-01-07 Contingent — GCAR
- 2021-12-19 Listed $79,900 GCAR
- 2012-12-14 Sold (Public Records) $29,000 Public Records
- 1988-09-09 Sold (Public Records) $7,500 Public Records
Property tax history
+5.8%/yrLatest (2025): $364 · +48.2% YoY. Source: county tax records.
Cash-flow waterfall
monthlySold comps — $/sqft
last 12 mo · ≤1 miLoading sold comps…