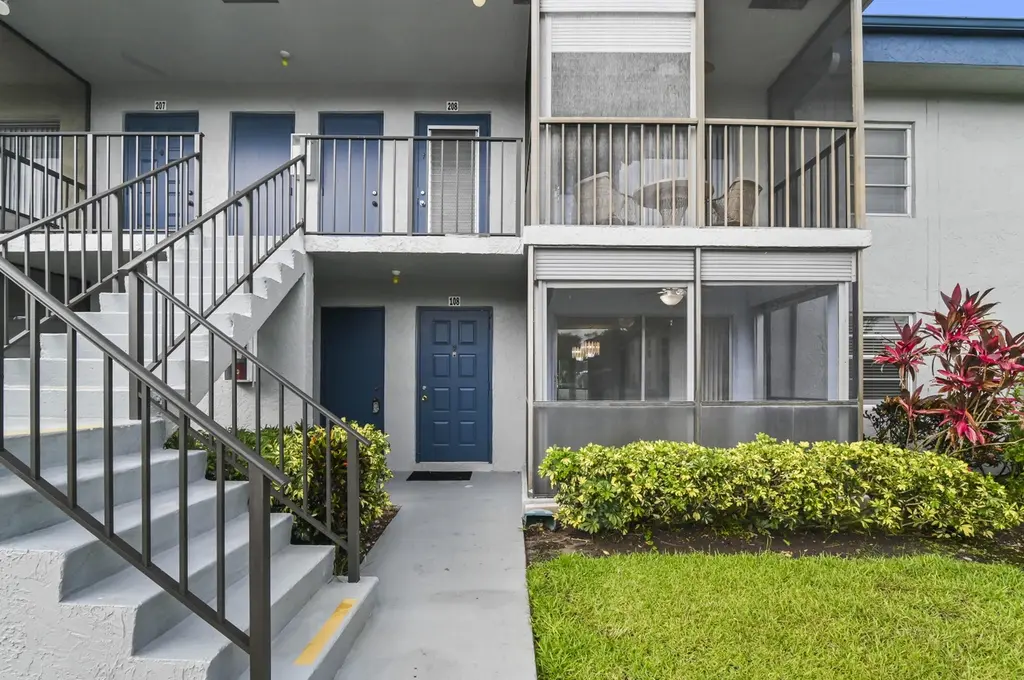
7535 S Oriole Blvd #108 · Delray Beach, FL
Flood risk 1/10 · Minimal
- FEMA flood zone
- X (unshaded)
- Chance of flooding over 30 yrs
- 0.0%
- Est. flood insurance / yr
- $507 – $1,088
Fire risk 3/10 · Minor
- Est. fire insurance / yr
- $947 – $1,759
Heat risk 9/10 · Severe
- Hot days now (above 107°F)
- 7 days/yr
- Hot days in 30 yrs
- 26 days/yr
Wind risk 10/10 · Severe
- Chance of severe wind over 30 yrs
- 99.0%
Air-quality risk 2/10 · Minimal
- Unhealthy air days now
- 0 days/yr
- Unhealthy air days in 30 yrs
- 2 days/yr
Risk factors via First Street. Map © Google.
Why this score? — see what drove the C grade
The composite is a weighted blend of 9 inputs, each scored 0–100. Each bar is that input's sub-score; the figure is the points it added to the 100-point composite (weight × sub-score).
- Cash flow +15.2/30.0
- 1% rule +9.8/10.0
- ARV discount +7.5/15.0
- Appreciation +5.3/10.0
- DSCR +4.7/10.0
- Schools +4.3/10.0
- Livability +3.9/5.0
- Rent growth +2.6/5.0
- Condition / age +2.5/5.0
$150,000
🖨 Deal sheet 📄 Offer letter ✓ Due diligence
Listing remarks MLS
You'll LOVE living in Evergreen! This is a lovely 2 bedroom 2 bath 1st Floor apartment in a quiet community. Parking steps from your front door. COMPLETE IMPACT WINDOWS, Newer w/d (2022), Tons of closets w/a walk-in in the Primary Bedroom & en suite. Newer vanity in Guest bath. Immaculately kept. Evergreen is a small enclave just outside of Huntington Lakes. AND YOU'LL HAVE FULL USE OF THE HUNTINGTON LAKES CLUBHOUSE--being renovated w/completion expected in 2022. Exercise in the State-of-the-Art Gym, Enjoy movies and shows in the newly renovated Theatre, Swim in the Indoor and outdoor pools, club rooms, free transportation to area shops, So many activitis to choose from, or just hang at either the Evergreen or HL Pools. You'll love it here! Special Assessment to be pd by BUYER.
Key facts
- Community pool
- Spa
- Impact windows
Tags
Property features AI
Finance
- Other: Pets are not allowed
- HOA & community: Part of the EVERGREEN association; Monthly HOA fee (paid monthly); HOA includes cable TV, insurance, sewer, trash, water and common areas; Community amenities: clubhouse, fitness center, game room, pool, storage, bocce ball, sidewalks, street lights, recreation facilities; Senior community
Exterior
- Parking: Assigned parking (1 space)
- Utilities: Public water; Public sewer; Cable connected; Sewer connected; Water connected
- Home design: Condominium; Two-story building; Resale property; Faces south
- Construction: Block, stucco, CBS construction; Mixed, shingle and slate roofing; Appraiser-listed building area
- Exterior features: Covered patio; Screened patio; Patio
Interior
- Kitchen: Dishwasher; Microwave; Refrigerator
- Bedrooms: One bedroom on the main level
- Flooring: Tile
- Bathrooms: Two full bathrooms (one on the main level)
- Heating & cooling: Central heating; Central air conditioning
- Interior features: Walk-in closet(s); Unfurnished
- Laundry & utility: Washer/dryer in a laundry closet inside the unit
Neighborhood map
What this means for you Summary
Snapshot
- This is a 2-bed/2.0-bath condo listed at $150k.
Deal economics
- At list price, monthly cash flow is $52 ($623/yr) — positive.
- The deal already cash-flows at list — no discount required.
- Meets the 1% rule at list price ($2k rent vs $150k).
- Cap rate 6.7% vs local median 4.3% in Delray Beach — top-decile yield for the area; either an underpriced asset or a hidden risk that comps aren't pricing in. Stress-test before assuming the spread holds.
Location & tenants
- Location reads 77/100 on livability (#202 in FL, #3,160 nationally) — a middle-class / working-renter tenant base. Strengths: housing A+, health & safety A+, commute A-; Watch: cost of living C-, crime D-, amenities F.
- Palm Beach (suburban): math 46% / reading 53% proficiency, ranked #34 of 73 in FL (top 47%) — families likely to look elsewhere, expect single-tenant / working-renter base with shorter leases.
- Zoned schools: Hagen Road Elementary School (math 55% / reading 63%, grade B-, #722 of 2,144 statewide, top 34%, 773 students, 46% FRL); Spanish River Community High School (math 64% / reading 74%, grade B, #63 of 667 statewide, top 10%, 2,578 students, 25% FRL) — zoned schools average 35% FRL vs 52% district-wide (17 pts lower); this property's tenant base skews higher-income than the district average.
- Zoned-school proficiency averages 64% at this address vs 50% district-wide (+14 pts) — the actual schools serving this property are materially stronger than the Palm Beach average implies; a family-tenant draw the district grade alone would hide.
- Market conditions: Rents flat; 577 active listings in the ZIP; 40 comparable units currently listed for rent nearby; rentals at typical pace (median 25d on market — plan ~3-4 weeks tenant-placement turnaround); solid renter incomes; 3,974 units permitted in Palm Beach County in 2024 (1,012 in 5+ unit buildings).
- This rent runs 33% of the median local income ($80k/yr) — at the standard rent-burdened threshold; future hikes will face affordability resistance.
Forward outlook
- In year one you build about $2k of equity ($1k loan paydown + $1k appreciation (0.7% local appreciation)).
- Palm Beach County population projected at +30% by 2050 — long-run rental-demand tailwind backs the buy-and-hold thesis.
Negotiation context
- Only 7 days on market — expect competitive offers; lowballing is unlikely to land.
- 9 sale attempts since 19y ago with the ask held roughly flat each time — persistent listings suggest the price (not the market) is what's stuck; bring a comps-based counter.
Risks & watch-outs
- Watch-outs: HOA is 30% of rent.
- Climate carrying-cost: severe wind risk, 99% chance of damaging wind over 30y; extreme-heat days projected 7→26/yr by 2055 (HVAC capex compounding) — expect insurance premiums to compound above CPI over the hold.
Questions for the listing agent
- What does the HOA fee cover, when was the last increase, and are there any pending special assessments or reserve-fund shortfalls?
- Any open or pending special assessments — roof, HVAC, plumbing, elevator, façade? What's the per-unit balance and payoff schedule, and is the seller paying it off at close or rolling it to the buyer?
- Is there a deadline driving the sale (1031 exchange, divorce, estate, relocation)? That informs how much negotiation room exists.
- Schools are B-rated — typically a magnet for longer-tenancy family renters. What's the average tenant stay here, and is there a school-zone premium baked into asking?
- Crime grade is D in this area — have there been break-ins, vandalism, or insurance claims at this property in the last 3 years? What carrier currently insures it and at what premium?
- What's the average days-on-market for RENTAL listings here right now (not sales)? A rising rental-DOM trend means longer vacancies and softer asking-rent achievability than the comps imply.
- What's the recent tenant-quality profile in this submarket — average credit score on applications, eviction rate, late-payment / NSF rate, and stable-employment percentage? A property-management company in the area should have these aggregated.
- How much new apartment / multifamily construction is in the pipeline within 1–3 miles? Heavy new supply (>2% of stock underway) typically softens rents 12–24 months out; light construction supports rent growth.
Investment metrics
- 1% rule
- 1.48% ✓
- Cap rate
- 6.71%
- Cash-on-cash
- 1.48%
- DSCR
- 1.07
- GRM
- 5.6
CMA / ARV
No comps found within radius.
Projected returns pro-forma
0.69% appreciation · 0.51% rent growth · sell at horizon
- IRR
- -0.6%
- Equity multiple
- 0.97×
- Total profit
- $-1,147
- Equity at exit
- $48,778
- IRR
- 2.1%
- Equity multiple
- 1.22×
- Total profit
- $9,306
- Equity at exit
- $62,982
Cash invested: $42,000 (down + closing). Projections, not guarantees.
Landlord ↔ Tenant lean methodology
- Overall (STATE)
- 87 Strongly Landlord-Friendly
- State Florida
- 87 Strongly Landlord-Friendly · R+3
- County
- — inherits STATE
- City
- — inherits STATE
ZIP-level market 33446
- Home prices YoY
- 0.3%
- Rents YoY
- 0.5%
- Active inventory
- 577
- Price-to-rent
- 5.6×
Monthly cashflow live
- Estimated rent
- $2,214 high interval (Pro) →
- Mortgage (P&I)
- −$787
- Tax from tax record
- −$182 /mo · $2,184/yr
- Insurance
- −$62
- HOA
- −$666
- Vacancy / Maint / Mgmt
- −$465
- Net cashflow
- $52
Break-even live
UW: 25.0% down · 7.5% · 30yr · 1.5% tax · 5.0% vac · 8.0% maint · 8.0% mgmt
Financing live
Cash to close
- Down payment
- $37,500
- Closing costs
- $4,500
- Reserves months
- —
- Total cash needed
- —
Loan-product check · same deal, 3 products live
Conventional
25% down · 7.5% · 30yr
- Down + closing
- —
- Monthly P&I
- —
- Monthly cashflow
- —
- DSCR
- —
- Eligible?
- —
Personal DTI + credit; lowest rate.
DSCR
20% down · 8.5% · 30yr
- Down + closing
- —
- Monthly P&I
- —
- Monthly cashflow
- —
- DSCR
- —
- Eligible?
- —
No personal income docs; deal must DSCR.
Hard money
10% down · 12.0% · 12mo
- Down + closing
- —
- Monthly P&I
- —
- Monthly cashflow
- —
- DSCR
- —
- Eligible?
- —
Short-term bridge; refi at stabilization.
Rent comps 40 comps
| Address | Beds | Baths | Sqft | Rent | $/sqft | DOM | Units | Dist |
|---|---|---|---|---|---|---|---|---|
| 7515 S Oriole Blvd Delray Beach, FL | 2.0 | 2.0 | 850 | $1,700 | $2.00 | 24d | 1 | 0.04mi |
| 7607 Atlantic Ave Delray Beach, FL | 1.0–2.0 | 1.0–2.0 | 1086 | $3,494 | $3.22 | 2d | 6 | 0.23mi |
| 14895 Builtmore Way Delray Beach, FL | 2.0 | 2.0 | 1103 | $1,800 | $1.63 | 24d | 1 | 0.29mi |
| 14898 Wedgefield Dr #202 Delray Beach, FL | 2.0 | 2.0 | 1103 | $2,000 | $1.81 | 17d | 1 | 0.29mi |
| 7301 Amberly Ln #304 Delray Beach, FL | 2.0 | 2.0 | 1080 | $1,495 | $1.38 | 7d | 1 | 0.33mi |
| 14896 Bal Moral Ln Delray Beach, FL | 2.0 | 2.0 | 1040 | $2,200 | $2.12 | 24d | 1 | 0.37mi |
| 14723 Cumberland Dr Unit 404 B Delray Beach, FL | 1.0 | 2.0 | 912 | $1,850 | $2.03 | 24d | 1 | 0.41mi |
| 14747 Cumberland Dr #301 Delray Beach, FL | 2.0 | 2.0 | 1044 | $1,900 | $1.82 | 24d | 1 | 0.42mi |
| 15035 Michelangelo Blvd #103 Delray Beach, FL | 2.0 | 2.0 | 1079 | $2,000 | $1.85 | 24d | 1 | 0.44mi |
| 15055 Michelangelo Blvd Delray Beach, FL | 2.0–3.0 | 2.0 | 1158 | $2,125 | $1.83 | 22d | 2 | 0.45mi |
| 15065 Michelangelo Blvd #105 Delray Beach, FL | 2.0 | 2.0 | 1079 | $2,400 | $2.22 | 2d | 1 | 0.47mi |
| 15065 Michelangelo Blvd #105 Delray Beach, FL | 2.0 | 2.0 | 1079 | $2,400 | $2.22 | 22d | 1 | 0.47mi |
| 14 Willowbrook Ln #101 Delray Beach, FL | 2.0 | 2.0 | 1005 | $1,700 | $1.69 | 5d | 1 | 0.53mi |
| 7286 Huntington Ln #105 Delray Beach, FL | 2.0 | 2.0 | 1070 | $3,350 | $3.13 | 24d | 1 | 0.55mi |
| 10 Willowbrook Ln #105 Delray Beach, FL | 2.0 | 2.0 | 1005 | $2,100 | $2.09 | 11d | 1 | 0.60mi |
| 15155 Michelangelo Blvd #106 Delray Beach, FL | 2.0 | 2.0 | 1079 | $2,400 | $2.22 | 24d | 1 | 0.60mi |
| 15155 Michelangelo Blvd #106 Delray Beach, FL | 2.0 | 2.0 | 1079 | $2,400 | $2.22 | 20d | 1 | 0.60mi |
| 15155 Michelangelo Blvd Delray Beach, FL | 2.0 | 2.0 | 1079 | $2,288 | $2.12 | 7d | 2 | 0.60mi |
| 20 Abbey Ln #102 Delray Beach, FL | 2.0 | 2.0 | 925 | $2,600 | $2.81 | 24d | 1 | 0.61mi |
| 7192 Huntington Ln #307 Delray Beach, FL | 2.0 | 2.0 | 1070 | $3,500 | $3.27 | 18d | 1 | 0.62mi |
| 21 Abbey Ln #107 Delray Beach, FL | 2.0 | 2.0 | 925 | $1,800 | $1.95 | 15d | 1 | 0.63mi |
| 19 Abbey Ln #206 Delray Beach, FL | 2.0 | 2.0 | 925 | $1,750 | $1.89 | 24d | 1 | 0.64mi |
| 23 Abbey Ln #208 Delray Beach, FL | 2.0 | 2.0 | 925 | $1,500 | $1.62 | 3d | 1 | 0.64mi |
| 8061 Red Jasper Ln Delray Beach, FL | 1.0 | 1.0 | 798 | $2,580 | $3.23 | 20d | 1 | 0.68mi |
| 8061 Red Jasper Ln Delray Beach, FL | 2.0 | 2.0 | 1097 | $2,877 | $2.62 | 24d | 1 | 0.68mi |
| 8061 Red Jasper Ln Delray Beach, FL | 2.0 | 2.0 | 1097 | $2,892 | $2.64 | 12d | 1 | 0.68mi |
| 3 Abbey Ln #102 Delray Beach, FL | 2.0 | 2.0 | 925 | $2,500 | $2.70 | 24d | 1 | 0.71mi |
| 8085 Tumblestone Ct Delray Beach, FL | 2.0 | 2.0 | 1097 | $2,679 | $2.44 | 24d | 1 | 0.71mi |
| 8085 Tumblestone Ct Delray Beach, FL | 2.0 | 2.0 | 1076 | $2,668 | $2.48 | 3d | 1 | 0.71mi |
| 31 Abbey Ln #207 Delray Beach, FL | 2.0 | 2.0 | 925 | $1,300 | $1.41 | 24d | 1 | 0.71mi |
| 32 Abbey Ln #207 Delray Beach, FL | 2.0 | 2.0 | 925 | $2,500 | $2.70 | 24d | 1 | 0.75mi |
| 14307 Bedford Dr #302 Delray Beach, FL | 2.0 | 2.0 | 990 | $2,200 | $2.22 | 24d | 1 | 0.76mi |
| 163 Tuscany C Unit C Delray Beach, FL | 1.0 | 1.5 | 720 | $1,300 | $1.81 | 15d | 1 | 0.79mi |
| 28 Seville B Delray Beach, FL | 2.0 | 2.0 | 883 | $1,950 | $2.21 | 11d | 1 | 0.82mi |
| 14671 Bonaire Blvd #505 Delray Beach, FL | 1.0 | 2.0 | 925 | $1,600 | $1.73 | 24d | 1 | 0.82mi |
| 189 Seville Ter Unit 189 Delray Beach, FL | 2.0 | 2.0 | 880 | $1,900 | $2.16 | 24d | 1 | 0.83mi |
| 213 Waterford I Delray Beach, FL | 2.0 | 2.0 | 880 | $1,600 | $1.82 | 24d | 1 | 0.83mi |
| 14735 Wildflower Ln Delray Beach, FL | 2.0 | 2.0 | 1073 | $2,350 | $2.19 | 2d | 1 | 0.88mi |
| 6795 Huntington Ln #406 Delray Beach, FL | 2.0 | 2.0 | 990 | $2,500 | $2.53 | 20d | 1 | 0.91mi |
| 102 Waterford D Unit 102 Delray Beach, FL | 1.0 | 1.5 | 720 | $1,900 | $2.64 | 24d | 1 | 0.92mi |
HOA detail condo
- Monthly dues
- $666 · $7,992/yr
- Likely covers
- poolgym
- ⚠ Special-assessment mentions
-
…area shops, So many activitis to choose from, or just hang at either the Evergreen or HL Pools. You'll love it here! Special Assessment to be pd by BUYER.
Listing history 6 events
-
2026-06-18days on market $150,000 Active 7 DOM
-
2026-06-17days on market $150,000 Active 6 DOM
-
2026-06-16days on market $150,000 Active 5 DOM
-
2026-06-15days on market $150,000 Active 4 DOM
-
2026-06-13remarks 519-char remark
-
2026-06-13$150,000 Active 2 DOM
ⓘ Source: listings_history table (triggers on properties + properties_extension) + one-shot
backfill from property_details.listing_events for pre-trigger history.
Tax reassessment forecast FL · Resets to sale price
- Current annual tax
- $2,184 · $182/mo
- Projected year-2 tax
- $2,184 · $182/mo
- Expected delta
- $0/yr ($0/mo · 0.0%)
ⓘ Screening estimate from a state-policy table — verify with the county assessor before closing.
Climate risk First Street
- Flood 1/10 Low FEMA zone X (unshaded) · 0% chance over 30 yrs
- Wildfire 3/10 Moderate
- Heat 9/10 Extreme 7 d/yr ≥107°F today · 26 d/yr by 30 yrs out
- Wind 10/10 Extreme 99% chance of damaging wind over 30 yrs
- Air quality 2/10 Low 0 unhealthy d/yr today · 2 by 30 yrs out
Nearby sold comps map
Loading sold comps map…
Walkable amenities ~0.75 mi
Loading nearby amenities…
Taxation est. · year 1
- Rental income
- $26,567
- − Mortgage interest
- −$8,402
- − Property taxes
- −$2,184
- − Insurance
- −$750
- − Repairs & maintenance
- −$2,125
- − Management
- −$2,125
- − HOA
- −$7,992
- − Depreciation
- −$4,364
- Taxable loss
- −$1,376
- Est. tax savings @ 24.0%
- +$330
- After-tax cash flow
- $953/yr
For passive investors: Depreciation is non-cash, so a rental often shows a tax loss while cash-flowing — sheltering income. Rental losses are passive: they offset passive income freely, and up to $25,000/yr can offset ordinary (W-2) income if you actively participate and your MAGI is under $100k (phasing out to $0 by $150k); unused losses carry forward. On sale, claimed depreciation is recaptured at up to 25%, and gains may owe capital-gains tax (a 1031 exchange can defer both). Figures are a year-1 estimate at your 24.0% rate — not tax advice; consult a CPA.
Schools (NCES district)
- District
- Palm Beach
- NCES district ID
- 1201500
- Math proficiency
- 46% ▼ -16.00%
- Reading proficiency
- 53% ▼ -4.00%
- Median HH income
- $53,943
- Composite
- 42.72/100
- National rank
- #3160
- State rank
- #34 of 73 in FL
Livability — Delray Beach
- Score
- 77/100
- State rank
- #202
- US rank
- #3160
Category grades
Schools grade is shown separately in the Schools card above.
Census & demographics
- County
- Palm Beach County · 1,438,312 people
- City population
- 123,167
- Metro
- Miami-Fort Lauderdale-Pompano Beach, FL
- Population (ZIP)
- 28,431
- Household income
- $80,187
- Rent vs Own
- Severe rent burden
- 494.0
Population outlook (Palm Beach County) Hauer SSP2
- Today (2025)
- 1,637,487 people
- By 2030
- 1,743,255 · +6.5%
- By 2040
- 1,948,712 · +19.0%
- By 2050
- 2,132,979 · +30.3%
- By 2075
- 2,530,027 · +54.5%
- By 2100
- 2,706,979 · +65.3%
Race, ethnicity, and origin ACS 2023
- Neighborhood character
- Predominantly White (79%)
- Race & ethnicity
- White 79% Hispanic / Latino 13% Two or more races 9% Black 4%
- Hispanic origin (detail)
- Puerto Rican 3% Dominican 1%
- Common ancestry
- Romanian 9% Scotch-Irish 9% Italian 2%
- Foreign-born
- 20% · Canada, Jamaica, Guatemala
- Languages at home
- 80% English-only · Spanish 12% Other Indo-European 2% French/Haitian/Cajun 2%
Political lean MEDSL · Palm Beach
- 2024 margin
- Toss-up / Even · D 50.0% · R 49.2%
- 2008→2024 swing
- -22.1pp toward R · 2008: 22.9pp · 2024: 0.8pp
- All cycles
- 2024: D+0.8 2020: D+12.8 2016: D+15.3 2012: D+17.0 2008: D+22.9
Not yet ingested
- Civics
- —
Market trends
- HPI YoY
- ▲ 0.69%
- Current HPI
- 242.5138
- Rent YoY
- ▲ 0.51%
- Metro
- Miami-Fort Lauderdale-Pompano Beach, FL
- State GDP YoY
- ▲ 3.28%
- F500 in state
- 36
Industry mix (Fortune 500 HQ in FL)
| Industry | F500 HQs | Revenue |
|---|---|---|
| Industrial Technology | 2 | $29B |
|
||
| Insurance | 2 | $17B |
|
||
| Retail | 1 | $60B |
|
||
| Technology Distribution | 1 | $58B |
|
||
| Homebuilding | 1 | $35B |
|
||
| Technology Manufacturing | 1 | $35B |
|
||
Price history
+328.6% since first listed27 events — show timeline
- 2026-06-11 Listed $150,000 Beaches MLS
- 2025-10-05 Rental Removed $1,500 RMLSFL
- 2025-08-31 Listing Removed — Beaches MLS
- 2025-07-30 Listed for Rent $1,600 RMLSFL
- 2025-07-20 Rental Removed $1,750 RMLSFL
- 2025-06-01 Listed $159,000 Beaches MLS
- 2025-04-19 Listed for Rent $1,750 RMLSFL
- 2025-04-13 Rental Removed $1,775 RMLSFL
- 2025-03-11 Price Changed $1,775 RMLSFL
- 2025-02-07 Price Changed $1,800 RMLSFL
- 2024-10-13 Listed for Rent $1,850 RMLSFL
- 2023-12-01 Rental Removed $1,800 GFLMLS
- 2023-11-18 Listed for Rent $1,800 GFLMLS
- 2022-11-07 Sold (Public Records) $168,000 Public Records
- 2022-10-31 Sold (MLS) $168,000 Beaches MLS
- 2022-09-22 Pending — Beaches MLS
- 2022-09-13 Contingent — Beaches MLS
- 2022-09-08 Price Changed $169,900 Beaches MLS
- 2022-08-01 Listed $175,000 Beaches MLS
- 2016-12-13 Sold (Public Records) $84,000 Public Records
- 2016-12-07 Sold (MLS) $84,000 MARMLS
- 2016-11-28 Pending — MARMLS
- 2016-10-26 Listed $89,900 MARMLS
- 2009-05-12 Sold (MLS) $35,000 Beaches MLS
- 2009-04-24 Sold (Public Records) $35,000 Public Records
- 2009-03-24 Listing Removed — Beaches MLS
- 2007-10-08 Listed $35,000 Beaches MLS
Property tax history
+8.4%/yrLatest (2025): $2,184 · -16.5% YoY. Source: county tax records.
Cash-flow waterfall
monthlySold comps — $/sqft
last 12 mo · ≤1 miLoading sold comps…