505 Bellemeade St SW · Decatur, AL
Flood risk 1/10 · Minimal
- FEMA flood zone
- X (unshaded)
- Chance of flooding over 30 yrs
- 0.0%
- Est. flood insurance / yr
- $507 – $1,088
Fire risk 1/10 · Minimal
- Est. fire insurance / yr
- $916 – $1,700
Heat risk 6/10 · Moderate
- Hot days now (above 107°F)
- 7 days/yr
- Hot days in 30 yrs
- 19 days/yr
Wind risk 4/10 · Minor
- Chance of severe wind over 30 yrs
- 22.0%
Air-quality risk 2/10 · Minimal
- Unhealthy air days now
- 1 days/yr
- Unhealthy air days in 30 yrs
- 1 days/yr
Risk factors via First Street. Map © Google.
Why this score? — see what drove the C+ grade
The composite is a weighted blend of 9 inputs, each scored 0–100. Each bar is that input's sub-score; the figure is the points it added to the 100-point composite (weight × sub-score).
- Cash flow +23.7/30.0
- ARV discount +15.0/15.0
- DSCR +7.6/10.0
- 1% rule +5.6/10.0
- Rent growth +3.7/5.0
- Livability +3.6/5.0
- Schools +2.6/10.0
- Condition / age +2.5/5.0
- Appreciation +0.0/10.0
$110,000
🖨 Deal sheet 📄 Offer letter ✓ Due diligence
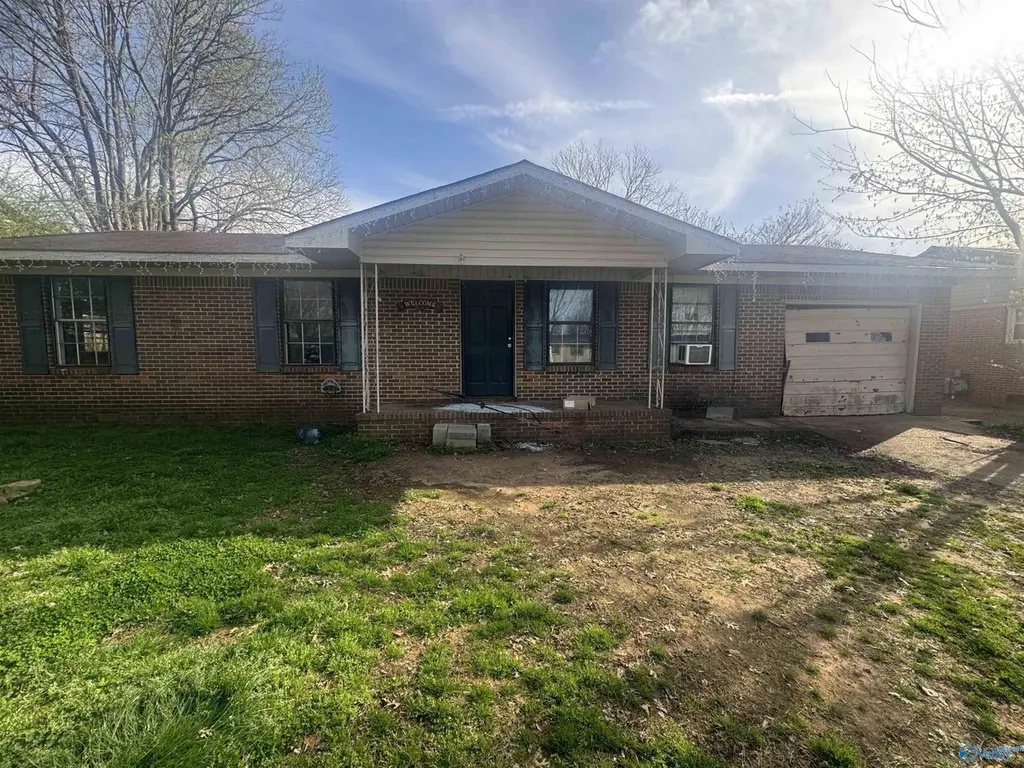
Listing remarks
Roll up your sleeves and get started working on your terrific new home! 3 bedroom, 2 bathrooms, great location and good schools. Large rooms, spacious eat in kitchen, nice yard, Enjoy making this project your home! Needs updates!
Key facts
- 0.27 acre lot
- Garage
- Built 1965
Property features AI
Finance
- HOA & community: No homeowners association; Subdivision: Lulindo
Exterior
- Parking: Attached one-car garage
- Utilities: Public water
- Home design: Single-family residence; One-story home; Built in 1965; Brick construction
- Construction: Brick exterior; Built in 1965
- Exterior features: Public water; Lot measures approximately 0.27 acres (75 x 150)
Interior
- Bathrooms: 2 full bathrooms
- Heating & cooling: Wall furnace heating; Multiple window air conditioning units
- Interior features: Crawl space basement; No fireplaces
Neighborhood map
What this means for you Summary
Snapshot
- This is a 3-bed/1.0-bath single-family listed at $110k.
Deal economics
- At list price, monthly cash flow is $209 ($3k/yr) — positive.
- The deal already cash-flows at list — no discount required.
- Meets the 1% rule at list price ($1k rent vs $110k).
- Recommended offer: $108k (1.5% below list) — sets the bar for market timing.
- Cap rate 8.6% vs local median 4.0% in Decatur — top-decile yield for the area; either an underpriced asset or a hidden risk that comps aren't pricing in. Stress-test before assuming the spread holds.
Location & tenants
- Location reads 72/100 on livability (#28 in AL) — a middle-class / working-renter tenant base. Strengths: cost of living A+, housing A+, health & safety A+; Watch: employment D+, crime F, amenities F.
- Decatur City (urban): math 22% / reading 40% proficiency, ranked #66 of 129 in AL (top 51%) — families likely to look elsewhere, expect single-tenant / working-renter base with shorter leases.
- Zoned schools: Austinville Elementary School (math 12% / reading 27%, grade F, #467 of 627 statewide, top 76%, 416 students, 88% FRL); Austin Middle School (math 18% / reading 39%, grade F, #138 of 257 statewide, top 54%, 714 students, 77% FRL); Austin High School (math 20% / reading 24%, grade F, #142 of 305 statewide, top 51%, 1,025 students, 66% FRL) — zoned schools average 77% FRL vs 57% district-wide (20 pts higher); higher-poverty schools than district average — tighter screening recommended.
- Market conditions: Rents rising fast (+4.7%/yr); 223 active listings in the ZIP; 13 comparable units currently listed for rent nearby; rentals lingering (median 44d on market — plan ~5-8 weeks vacancy on turnover, expect pricing pressure); 85% of comp listings sitting > 30 days — soft ceiling on asking rent; 231 units permitted in Morgan County in 2024 (0 in 5+ unit buildings).
Forward outlook
- Local home prices are declining (-3.0%/yr); year-one equity from $761 of loan paydown is wiped out by about $3k of value loss. Plan a longer hold.
- Morgan County population projected at -11% by 2050 — secular population decline; favor cash flow + early exit over multi-decade hold.
- At projected returns (-3.0% appreciation + 4.7% rent growth), your $31k cash investment doubles in ~10 years — after that, you're playing with house money.
Negotiation context
- It's been on market 15 days — a 2% lower offer ($108k) is reasonable based on typical stale-listing flexibility.
- Current owner paid $80k; 38% above their basis — modest negotiation headroom, anchor on the comps not their cost.
Risks & watch-outs
- Climate carrying-cost: extreme-heat days projected 7→19/yr by 2055 (HVAC capex compounding) — expect insurance premiums to compound above CPI over the hold.
Questions for the listing agent
- Built in 1965 — when were the roof, HVAC, electrical panel, plumbing, and water heater last replaced?
- Is there a deadline driving the sale (1031 exchange, divorce, estate, relocation)? That informs how much negotiation room exists.
- Crime grade is F in this area — have there been break-ins, vandalism, or insurance claims at this property in the last 3 years? What carrier currently insures it and at what premium?
- What's the average days-on-market for RENTAL listings here right now (not sales)? A rising rental-DOM trend means longer vacancies and softer asking-rent achievability than the comps imply.
- What's the recent tenant-quality profile in this submarket — average credit score on applications, eviction rate, late-payment / NSF rate, and stable-employment percentage? A property-management company in the area should have these aggregated.
- How much new for-sale + rental construction is in the pipeline within 1–3 miles? Heavy new supply typically softens prices + rents 12–24 months out; constrained supply supports both.
Investment metrics
- 1% rule
- 1.06% ✓
- Cap rate
- 8.57%
- Cash-on-cash
- 8.12%
- DSCR
- 1.36
- GRM
- 7.9
CMA / ARV
- ARV (on-the-fly)
- $173,745
- Comps found
- 12
Show comp detail 12 sales within ~0.75 mi
| Address | Dist | Beds/Ba | Sqft | Sold | Price | $/sf | Match |
|---|---|---|---|---|---|---|---|
| 315 Bobwhite Dr | 0.55mi | 3/2.0 | 1,149 (-5%) | 2mo | $102,500 | $89 | 60 |
| 936 Spring Ct | 0.63mi | 3/2.0 | 1,189 (-2%) | 5mo | $158,000 | $133 | 59 |
| 905 Cedar St SW | 0.61mi | 2/1.0 (-1) | 1,281 (+5%) | 4mo | $145,000 | $113 | 54 |
| 1206 Skyview St SW | 0.66mi | 3/2.0 | 1,260 (+4%) | 8mo | $194,000 | $154 | 53 |
| 920 Sims St SW | 0.69mi | 3/1.5 | 1,143 (-6%) | 4mo | $105,000 | $92 | 52 |
| 1014 SW Towerview St | 0.64mi | 3/1.5 | 1,106 (-9%) | 3mo | $170,000 | $154 | 51 |
| 1002 Skyview Street Sw SW | 0.54mi | 3/1.5 | 1,070 (-12%) | 3mo | $185,000 | $173 | 51 |
| 2206 Willow Ave SW | 0.56mi | 2/1.0 (-1) | 1,110 (-9%) | 12mo | $150,000 | $135 | 44 |
| 1210 Skyview St SW | 0.69mi | 3/2.0 | 1,300 (+7%) | 14mo | $215,000 | $165 | 41 |
| 603 SW Bradley St | 0.58mi | 3/1.5 | 1,047 (-14%) | 10mo | $150,000 | $143 | 40 |
| 316 Larkwood Dr SW | 0.62mi | 3/2.0 | 1,340 (+10%) | 13mo | $168,000 | $125 | 39 |
| 210 Larkwood Dr | 0.73mi | 3/2.0 | 1,080 (-11%) | 12mo | $166,000 | $154 | 33 |
Match score weights: distance 35% · size 25% · config 20% · recency 20%. Top-matched comps best support the ARV.
Projected returns pro-forma
-3.0% appreciation · 4.67% rent growth · sell at horizon
- IRR
- -2.2%
- Equity multiple
- 0.92×
- Total profit
- $-2,560
- Equity at exit
- $16,401
- IRR
- 9.2%
- Equity multiple
- 1.76×
- Total profit
- $23,296
- Equity at exit
- $9,511
Cash invested: $30,800 (down + closing). Projections, not guarantees.
Landlord ↔ Tenant lean methodology
- Overall (STATE)
- 90 Strongly Landlord-Friendly
- State Alabama
- 90 Strongly Landlord-Friendly · R+15
- County
- — inherits STATE
- City
- — inherits STATE
ZIP-level market 35601
- Home prices YoY
- -26.5%
- Rents YoY
- 4.7%
- Active inventory
- 223
- Price-to-rent
- 7.9×
Monthly cashflow live
- Estimated rent
- $1,168 high interval (Pro) →
- Mortgage (P&I)
- −$577
- Tax from tax record
- −$91 /mo · $1,094/yr
- Insurance
- −$46
- HOA
- −$0
- Vacancy / Maint / Mgmt
- −$245
- Net cashflow
- $209
Break-even live
UW: 25.0% down · 7.5% · 30yr · 1.5% tax · 5.0% vac · 8.0% maint · 8.0% mgmt
Financing live
Cash to close
- Down payment
- $27,500
- Closing costs
- $3,300
- Reserves months
- —
- Total cash needed
- —
Loan-product check · same deal, 3 products live
Conventional
25% down · 7.5% · 30yr
- Down + closing
- —
- Monthly P&I
- —
- Monthly cashflow
- —
- DSCR
- —
- Eligible?
- —
Personal DTI + credit; lowest rate.
DSCR
20% down · 8.5% · 30yr
- Down + closing
- —
- Monthly P&I
- —
- Monthly cashflow
- —
- DSCR
- —
- Eligible?
- —
No personal income docs; deal must DSCR.
Hard money
10% down · 12.0% · 12mo
- Down + closing
- —
- Monthly P&I
- —
- Monthly cashflow
- —
- DSCR
- —
- Eligible?
- —
Short-term bridge; refi at stabilization.
Rent comps 13 comps
| Address | Beds | Baths | Sqft | Rent | $/sqft | DOM | Units | Dist |
|---|---|---|---|---|---|---|---|---|
| 2500 Spring Ave SW Decatur, AL | 1.0–2.0 | 1.0–2.0 | 825 | $987 | $1.20 | 43d | 7 | 0.33mi |
| 2801 Sandlin Rd SW Decatur, AL | 1.0–2.0 | 1.0 | 645 | $999 | $1.55 | 43d | 6 | 0.38mi |
| 306 Courtney Dr SW Unit 21 Decatur, AL | 2.0 | 2.0 | 975 | $975 | $1.00 | 43d | 1 | 0.68mi |
| 305 Courtney Dr SW Decatur, AL | 1.0–3.0 | 1.0–2.0 | 1200 | $1,425 | $1.19 | 43d | 6 | 0.75mi |
| 1242 Beltline Rd SW Decatur, AL | 1.0–3.0 | 1.0–2.0 | 1118 | $1,150 | $1.03 | 43d | 5 | 0.78mi |
| 201 Bluebird Ln SW Decatur, AL | 2.0 | 1.0 | 950 | $898 | $0.94 | 43d | 11 | 0.80mi |
| 2115 Central Pkwy SW Decatur, AL | 1.0–3.0 | 1.0 | 821 | $950 | $1.16 | 43d | 1 | 0.82mi |
| 324 Cardinal Dr SW Decatur, AL | 2.0 | 1.0 | 681 | $952 | $1.40 | 43d | 14 | 0.82mi |
| 1321 Towerview St SW Decatur, AL | 1.0–2.0 | 1.0 | 762 | $964 | $1.26 | 23d | 3 | 0.86mi |
| 2019 Morgan Ave SW Decatur, AL | 4.0 | 2.0 | 1064 | $1,650 | $1.55 | 43d | 1 | 1.09mi |
| 1607 Glenn St SW Apt 2 Decatur, AL | 2.0 | 1.5 | 950 | $1,100 | $1.16 | 43d | 1 | 1.11mi |
| 1602 Brookridge Dr SW Decatur, AL | 1.0–2.0 | 1.0–2.0 | 797 | $1,174 | $1.47 | 43d | 13 | 1.15mi |
| 2025 Danville Park Dr SW Decatur, AL | 1.0–2.0 | 1.0–2.0 | 938 | $1,325 | $1.41 | 23d | 8 | 1.49mi |
Listing history 14 events
-
2026-06-18status $110,000 Pending 15 DOM
-
2026-06-18days on market $110,000 Active 15 DOM
-
2026-06-17days on market $110,000 Active 14 DOM
-
2026-06-17price $110,000 Active 13 DOM
-
2026-06-16days on market $120,000 Active 13 DOM
-
2026-06-15days on market $120,000 Active 12 DOM
-
2026-06-14days on market $120,000 Active 10 DOM
-
2026-06-13days on market $120,000 Active 9 DOM
-
2026-06-10days on market $120,000 Active 7 DOM
-
2026-06-09days on market $120,000 Active 6 DOM
-
2026-06-08days on market $120,000 Active 5 DOM
-
2026-06-07days on market $120,000 Active 4 DOM
-
2026-06-03remarks 229-char remark
-
2026-06-03$120,000 Active 1 DOM
ⓘ Source: listings_history table (triggers on properties + properties_extension) + one-shot
backfill from property_details.listing_events for pre-trigger history.
Tax reassessment forecast AL · Resets to sale price
- Current annual tax
- $1,094 · $91/mo
- Projected year-2 tax
- $1,094 · $91/mo
- Expected delta
- $0/yr ($0/mo · 0.0%)
ⓘ Screening estimate from a state-policy table — verify with the county assessor before closing.
Climate risk First Street
- Flood 1/10 Low FEMA zone X (unshaded) · 0% chance over 30 yrs
- Wildfire 1/10 Low
- Heat 6/10 Major 7 d/yr ≥107°F today · 19 d/yr by 30 yrs out
- Wind 4/10 Moderate 22% chance of damaging wind over 30 yrs
- Air quality 2/10 Low 1 unhealthy d/yr today · 1 by 30 yrs out
Nearby sold comps map
Loading sold comps map…
Walkable amenities ~0.75 mi
Loading nearby amenities…
Taxation est. · year 1
- Rental income
- $14,011
- − Mortgage interest
- −$6,162
- − Property taxes
- −$1,094
- − Insurance
- −$550
- − Repairs & maintenance
- −$1,121
- − Management
- −$1,121
- − Depreciation
- −$3,200
- Taxable income
- $763
- Est. tax owed @ 24.0%
- −$183
- After-tax cash flow
- $2,319/yr
For passive investors: Depreciation is non-cash, so a rental often shows a tax loss while cash-flowing — sheltering income. Rental losses are passive: they offset passive income freely, and up to $25,000/yr can offset ordinary (W-2) income if you actively participate and your MAGI is under $100k (phasing out to $0 by $150k); unused losses carry forward. On sale, claimed depreciation is recaptured at up to 25%, and gains may owe capital-gains tax (a 1031 exchange can defer both). Figures are a year-1 estimate at your 24.0% rate — not tax advice; consult a CPA.
Schools (NCES district)
- District
- Decatur City
- NCES district ID
- 0101170
- Math proficiency
- 22% ▼ -27.00%
- Reading proficiency
- 40% ▼ -1.00%
- Median HH income
- $42,170
- Composite
- 26.21/100
- National rank
- #7261
- State rank
- #66 of 129 in AL
Livability — Decatur
- Score
- 72/100
- State rank
- #28
- US rank
- #5989
Category grades
Schools grade is shown separately in the Schools card above.
Census & demographics
- Census place
- Decatur, AL
- County
- Morgan County · 67,628 people
- City population
- 67,628
- Metro
- Decatur, AL
- Population (ZIP)
- 35,449
- Household income
- $51,429
- Rent vs Own
- Severe rent burden
- 1386.0
Population outlook (Morgan County) Hauer SSP2
- Today (2025)
- 118,775 people
- By 2030
- 116,979 · -1.5%
- By 2040
- 111,800 · -5.9%
- By 2050
- 105,181 · -11.4%
- By 2075
- 87,736 · -26.1%
- By 2100
- 67,624 · -43.1%
Race, ethnicity, and origin ACS 2023
- Neighborhood character
- Diverse neighborhood (Simpson 0.66)
- Race & ethnicity
- White 47% Hispanic / Latino 24% Black 24% Two or more races 10% Native American 2%
- Hispanic origin (detail)
- Mexican 15% Puerto Rican 2%
- Common ancestry
- Slovak 1% Italian 1% Lithuanian 1%
- Foreign-born
- 10% · Canada
- Languages at home
- 81% English-only · Spanish 18%
Political lean MEDSL · Morgan
- 2024 margin
- Solid R (+52.6) · D 23.2% · R 75.8%
- 2008→2024 swing
- -8.8pp toward R · 2008: -43.8pp · 2024: -52.6pp
- All cycles
- 2024: R+52.6 2020: R+49.2 2016: R+52.4 2012: R+44.5 2008: R+43.8
Not yet ingested
- Civics
- —
Market trends
- HPI YoY
- ▼ -89.26%
- Current HPI
- 247.8437
- Rent YoY
- ▲ 4.67%
- Metro
- Decatur, AL
- State GDP YoY
- ▲ 2.94%
- F500 in state
- 4
Industry mix (Fortune 500 HQ in AL)
| Industry | F500 HQs | Revenue |
|---|---|---|
| Financial Services | 1 | $8B |
|
||
| Healthcare | 1 | $5B |
|
||
Price history
+50.9% since first listed2 events — show timeline
- 2026-06-03 Listed $120,000 VMLS
- 2006-05-31 Sold (Public Records) $79,500 Public Records
Property tax history
+11.2%/yrLatest (2025): $1,094 · +0.0% YoY. Source: county tax records.
Cash-flow waterfall
monthlySold comps — $/sqft
last 12 mo · ≤1 miLoading sold comps…