 5-Plex
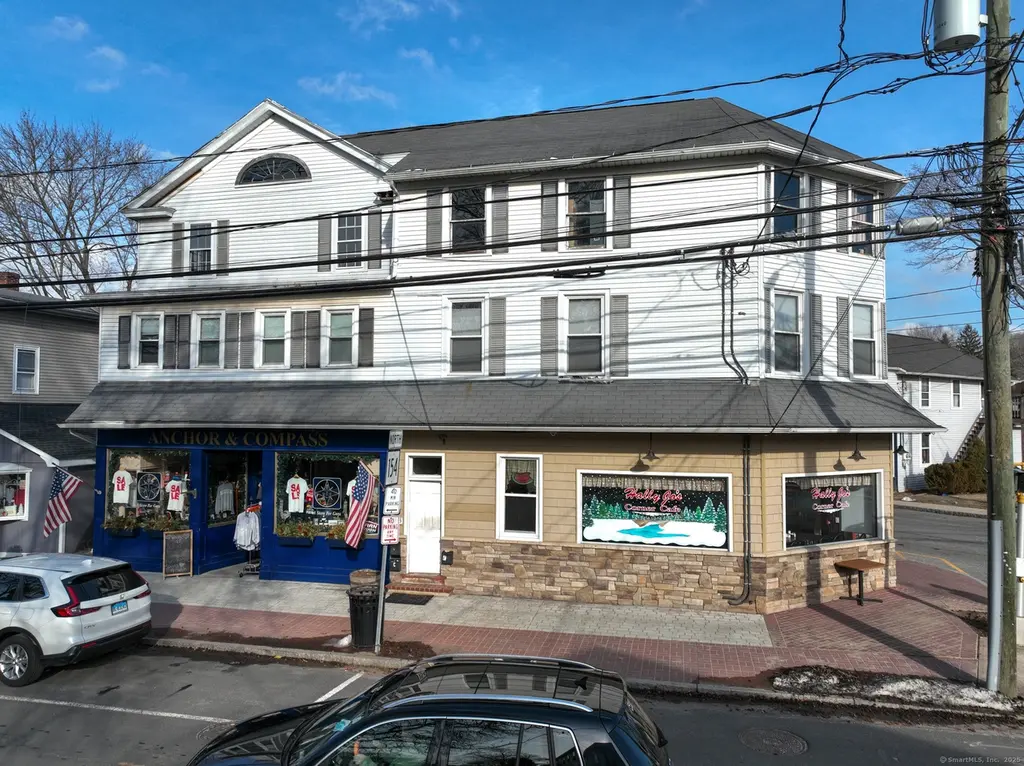
163-165 Main St · Deep River, CT
Flood risk No data
- FEMA flood zone
- —
- Chance of flooding over 30 yrs
- —
- Est. flood insurance / yr
- —
Fire risk No data
- Est. fire insurance / yr
- —
Heat risk No data
- Hot days now (above threshold)
- —
- Hot days in 30 yrs
- —
Wind risk No data
- Chance of severe wind over 30 yrs
- —
Air-quality risk No data
- Unhealthy air days now
- —
- Unhealthy air days in 30 yrs
- —
Risk factors via First Street. Map © Google.
Why this score? — see what drove the B grade
The composite is a weighted blend of 9 inputs, each scored 0–100. Each bar is that input's sub-score; the figure is the points it added to the 100-point composite (weight × sub-score).
- Cash flow +30.0/30.0
- 1% rule +10.0/10.0
- DSCR +10.0/10.0
- ARV discount +7.5/15.0
- Schools +4.5/10.0
- Condition / age +3.8/5.0
- Rent growth +2.5/5.0
- Livability +2.5/5.0
- Appreciation +0.0/10.0
$825,000
🖨 Deal sheet 📄 Offer letter ✓ Due diligence
Multi-family units
County records classify this as Multi-Family (5+ Unit). Listing-text estimate: 5 units. confirmed
5+ unit building — per-unit beds/baths from public records are typically unavailable; the breakdown below (if shown) is an estimate from the listing text.
Listing remarks
Rare mixed-use investment opportunity located in the heart of desirable Deep River Village. Positioned directly on Main Street, this 5-unit asset offers a strong blend of residential and commercial income within one of the Connecticut shoreline region's most sought-after rental and retail markets. The property consists of 3 residential apartments and 2 commercial storefronts occupied by long-term local tenants, providing stable in-place cash flow with additional upside through lease-up and rent optimization. Deep River continues to experience strong demand driven by its walkable downtown, restaurant scene, boutique retail presence, and proximity to the Connecticut River and shoreline commun
Key facts
- Walkable downtown
- Restaurant scene
- 3,049 sq ft lot
Tags
Property features AI
Finance
- Financial info: Multi-family for sale (5-family+)
Exterior
- Utilities: Public water connected; Public sewer connected; Fuel tank located in basement
- Home design: Multi-family property (5+ units)
- Construction: Frame construction; Stone foundation
- Exterior features: Corner lot on a level parcel within a historic district; Aluminum siding; Asphalt shingle roof
Interior
- Bedrooms: 6 bedrooms
- Bathrooms: 3 full bathrooms
- Heating & cooling: Hot air heating; Oil and propane fuel options; 50-gallon hot water tank (oil)
- Interior features: 12 total rooms; Full basement with interior access and hatchway; Has attic with walk-up access; partially finished storage space; Window unit cooling
Neighborhood map
What this means for you Summary
Snapshot
- This is a 5 × 6-bed/3.0-bath units multifamily listed at $825k. Condition is rated good.
Deal economics
- At list price, monthly cash flow is $5k ($62k/yr) — positive. Per door: $1k/mo.
- The deal already cash-flows at list — no discount required.
- Meets the 1% rule at list price ($14k rent vs $825k).
- Recommended offer: $813k (1.5% below list) — sets the bar for market timing.
Location & tenants
- Location reads: area grade B — affects rentability + tenant quality, not the cash-flow math above.
- Regional School District 04 (rural): math 37% / reading 63% proficiency, ranked #80 of 153 in CT (top 52%) — acceptable for families but not a draw, mixed tenant base, ~2y average lease; only 8% free/reduced lunch — higher-income household profile.
- Market conditions: 31 active listings in the ZIP; 278 units permitted in Lower Connecticut River Valley Planning Region in 2024 (89 in 5+ unit buildings).
Forward outlook
- Local home prices are declining (-3.0%/yr); year-one equity from $6k of loan paydown is wiped out by about $25k of value loss. Plan a longer hold.
- At projected returns (-3.0% appreciation + 3.0% rent growth), your $231k cash investment doubles in ~5 years — after that, you're playing with house money.
Negotiation context
- It's been on market 21 days — a 2% lower offer ($813k) is reasonable based on typical stale-listing flexibility.
- 2 sale attempts with the ask held roughly flat each time — persistent listings suggest the price (not the market) is what's stuck; bring a comps-based counter.
Risks & watch-outs
- Watch-outs: built in 1850 — expect roof / HVAC / electrical / plumbing capex.
Questions for the listing agent
- Can we see the unit-by-unit rent roll, current vacancy, and any below-market leases? What's the average tenancy length?
- What capital expenditures (roof, boiler, parking lot, exteriors) have been made in the last 5 years, and what's planned in the next 2?
- Built in 1850 — when were the roof, HVAC, electrical panel, plumbing, and water heater last replaced?
- Is there a deadline driving the sale (1031 exchange, divorce, estate, relocation)? That informs how much negotiation room exists.
- What's the average days-on-market for RENTAL listings here right now (not sales)? A rising rental-DOM trend means longer vacancies and softer asking-rent achievability than the comps imply.
- What's the recent tenant-quality profile in this submarket — average credit score on applications, eviction rate, late-payment / NSF rate, and stable-employment percentage? A property-management company in the area should have these aggregated.
- How much new apartment / multifamily construction is in the pipeline within 1–3 miles? Heavy new supply (>2% of stock underway) typically softens rents 12–24 months out; light construction supports rent growth.
Investment metrics
- 1% rule
- 1.67% ✓
- Cap rate
- 13.83%
- Cash-on-cash
- 26.93%
- DSCR
- 2.20
- GRM
- 5.0
CMA / ARV
No comps found within radius.
Projected returns pro-forma
-3.0% appreciation · 3.0% rent growth · sell at horizon
- IRR
- 20.9%
- Equity multiple
- 1.85×
- Total profit
- $196,645
- Equity at exit
- $123,010
- IRR
- 29.0%
- Equity multiple
- 3.59×
- Total profit
- $597,165
- Equity at exit
- $71,331
Cash invested: $231,000 (down + closing). Projections, not guarantees.
Landlord ↔ Tenant lean methodology
- Overall (STATE)
- 27 Tenant-Leaning
- State Connecticut
- 27 Tenant-Leaning · D+7
- County
- — inherits STATE
- City
- — inherits STATE
ZIP-level market 06417
- Home prices YoY
- -12.3%
- Active inventory
- 31
- Price-to-rent
- 24.9×
Monthly cashflow live
- Estimated rent
- $13,778 medium interval (Pro) →
- Mortgage (P&I)
- −$4,326
- Tax est. 1.5%
- −$1,031 /mo · $12,375/yr
- Insurance
- −$344
- HOA
- −$0
- Vacancy / Maint / Mgmt
- −$2,893
- Net cashflow
- $5,183
Break-even live
5-unit breakdown (identical units grouped — click to expand)
| Units | Beds | Baths | Est. rent |
|---|---|---|---|
| 5× units | 6 | 3 | $13,780 |
| #1 | 6 | 3 | $2,756 |
| #2 | 6 | 3 | $2,756 |
| #3 | 6 | 3 | $2,756 |
| #4 | 6 | 3 | $2,756 |
| #5 | 6 | 3 | $2,756 |
| Total (5 units) | $13,778 | ||
UW: 25.0% down · 7.5% · 30yr · 1.5% tax · 5.0% vac · 8.0% maint · 8.0% mgmt
Financing live
Cash to close
- Down payment
- $206,250
- Closing costs
- $24,750
- Reserves months
- —
- Total cash needed
- —
Loan-product check · same deal, 3 products live
Conventional
25% down · 7.5% · 30yr
- Down + closing
- —
- Monthly P&I
- —
- Monthly cashflow
- —
- DSCR
- —
- Eligible?
- —
Personal DTI + credit; lowest rate.
DSCR
20% down · 8.5% · 30yr
- Down + closing
- —
- Monthly P&I
- —
- Monthly cashflow
- —
- DSCR
- —
- Eligible?
- —
No personal income docs; deal must DSCR.
Hard money
10% down · 12.0% · 12mo
- Down + closing
- —
- Monthly P&I
- —
- Monthly cashflow
- —
- DSCR
- —
- Eligible?
- —
Short-term bridge; refi at stabilization.
Listing history 18 events
-
2026-06-18days on market $825,000 Active 21 DOM
-
2026-06-17days on market $825,000 Active 20 DOM
-
2026-06-16days on market $825,000 Active 19 DOM
-
2026-06-15days on market $825,000 Active 18 DOM
-
2026-06-13days on market $825,000 Active 16 DOM
-
2026-06-12days on market $825,000 Active 15 DOM
-
2026-06-10days on market $825,000 Active 13 DOM
-
2026-06-09days on market $825,000 Active 12 DOM
-
2026-06-08days on market $825,000 Active 11 DOM
-
2026-06-07days on market $825,000 Active 10 DOM
-
2026-06-05days on market $825,000 Active 7 DOM
-
2026-06-03days on market $825,000 Active 6 DOM
-
2026-06-02days on market $825,000 Active 5 DOM
-
2026-06-01days on market $825,000 Active 4 DOM
-
2026-05-31days on market $825,000 Active 3 DOM
-
2026-05-27$825,000 Active
-
2026-03-23historical $1,500
-
2026-03-12$1,500
ⓘ Source: listings_history table (triggers on properties + properties_extension) + one-shot
backfill from property_details.listing_events for pre-trigger history.
Nearby sold comps map
Loading sold comps map…
Walkable amenities ~0.75 mi
Loading nearby amenities…
Taxation est. · year 1
- Rental income
- $165,336
- − Mortgage interest
- −$46,213
- − Property taxes
- −$12,375
- − Insurance
- −$4,125
- − Repairs & maintenance
- −$13,227
- − Management
- −$13,227
- − Depreciation
- −$24,000
- Taxable income
- $52,169
- Est. tax owed @ 24.0%
- −$12,521
- After-tax cash flow
- $49,678/yr
For passive investors: Depreciation is non-cash, so a rental often shows a tax loss while cash-flowing — sheltering income. Rental losses are passive: they offset passive income freely, and up to $25,000/yr can offset ordinary (W-2) income if you actively participate and your MAGI is under $100k (phasing out to $0 by $150k); unused losses carry forward. On sale, claimed depreciation is recaptured at up to 25%, and gains may owe capital-gains tax (a 1031 exchange can defer both). Figures are a year-1 estimate at your 24.0% rate — not tax advice; consult a CPA.
Condition & rehab AI · 13 photos
This multi-family property is in good condition with no major repairs needed. It has a good roof, exterior, and interior, and is located in a desirable area with strong demand. Painting the exterior siding and cleaning the windows and HVAC system can further increase its value.
Value-add opportunities
- Both Paint the exterior siding — Painting the exterior siding can improve the curb appeal and increase the property's value.
- Both Clean the windows — Clean windows can improve the property's appearance and increase its value.
- Both Inspect and clean the HVAC system — A clean and functioning HVAC system can improve the property's comfort and energy efficiency, increasing its value.
Renovation cost estimate screening
Value-add ROI direction
- Both Paint the exterior siding — Painting the exterior siding can improve the curb appeal and increase the property's value. ↑
- Both Clean the windows — Clean windows can improve the property's appearance and increase its value. ↑
- Both Inspect and clean the HVAC system — A clean and functioning HVAC system can improve the property's comfort and energy efficiency, increasing its value. ↑
ⓘ Cost ranges are severity-bucket heuristics (US national rule-of-thumb). Get contractor quotes + a written scope before underwriting a rehab budget.
Schools (NCES district)
- District
- Regional School District 04
- NCES district ID
- 0903630
- Math proficiency
- 37% ▼ -18.00%
- Reading proficiency
- 63% ▼ -8.00%
- Median HH income
- $69,421
- Composite
- 44.54/100
- National rank
- #2789
- State rank
- #80 of 153 in CT
Livability — Deep River
No livability data for this city. (Only ~50 U.S. cities are tracked.)
Census & demographics
- Census place
- Deep River Center, CT
- Population (ZIP)
- 4,432
Population outlook (Lower Connecticut River Valley County) Hauer SSP2
- By 2040
- 188,651
Race, ethnicity, and origin ACS 2023
- Neighborhood character
- Predominantly White (87%)
- Race & ethnicity
- White 87% Two or more races 5% Hispanic / Latino 4% Black 3%
- Common ancestry
- Romanian 7% Slovak 6% Lithuanian 2%
- Foreign-born
- 9% · Canada
- Languages at home
- 90% English-only · Spanish 4% French/Haitian/Cajun 3% Other Indo-European 2%
Political lean MEDSL · Lower Connecticut River Valley
- 2024 margin
- D (+13.4) · D 55.9% · R 42.4% · Other 1.7%
- All cycles
- 2024: D+13.4
Not yet ingested
- Civics
- —
Market trends
- HPI YoY
- ▼ -26.17%
- Current HPI
- 186.0672
- Rent YoY
- —
- Metro
- —
- State GDP YoY
- ▲ 1.06%
- F500 in state
- 38
Industry mix (Fortune 500 HQ in CT)
| Industry | F500 HQs | Revenue |
|---|---|---|
| Industrial Machinery | 4 | $38B |
|
||
| Insurance | 3 | $71B |
|
||
| Financial Services | 2 | $25B |
|
||
| Transportation / Logistics | 2 | $18B |
|
||
| Healthcare | 1 | $247B |
|
||
| Telecommunications | 1 | $55B |
|
||
Price history
+54900.0% since first listed3 events — show timeline
- 2026-05-27 Listed $825,000 Smart MLS
- 2026-03-23 Rental Removed $1,500 RENTEC
- 2026-03-12 Listed for Rent $1,500 RENTEC
Cash-flow waterfall
monthlySold comps — $/sqft
last 12 mo · ≤1 miLoading sold comps…