500 W Cain St · Princeton, MO
Flood risk 1/10 · Minimal
- FEMA flood zone
- X (unshaded)
- Chance of flooding over 30 yrs
- 0.0%
- Est. flood insurance / yr
- $473 – $860
Fire risk 4/10 · Minor
- Est. fire insurance / yr
- $1,054 – $1,958
Heat risk 3/10 · Minor
- Hot days now (above 104°F)
- 7 days/yr
- Hot days in 30 yrs
- 15 days/yr
Wind risk 2/10 · Minimal
- Chance of severe wind over 30 yrs
- —
Air-quality risk 1/10 · Minimal
- Unhealthy air days now
- 0 days/yr
- Unhealthy air days in 30 yrs
- 0 days/yr
Risk factors via First Street. Map © Google.
Why this score? — see what drove the B- grade
The composite is a weighted blend of 9 inputs, each scored 0–100. Each bar is that input's sub-score; the figure is the points it added to the 100-point composite (weight × sub-score).
- Cash flow +26.2/30.0
- DSCR +8.9/10.0
- ARV discount +7.5/15.0
- 1% rule +6.0/10.0
- Appreciation +5.3/10.0
- Schools +4.2/10.0
- Livability +3.2/5.0
- Rent growth +2.5/5.0
- Condition / age +2.5/5.0
$109,900
🖨 Deal sheet (PDF) 📄 Offer letter ✓ Due diligence
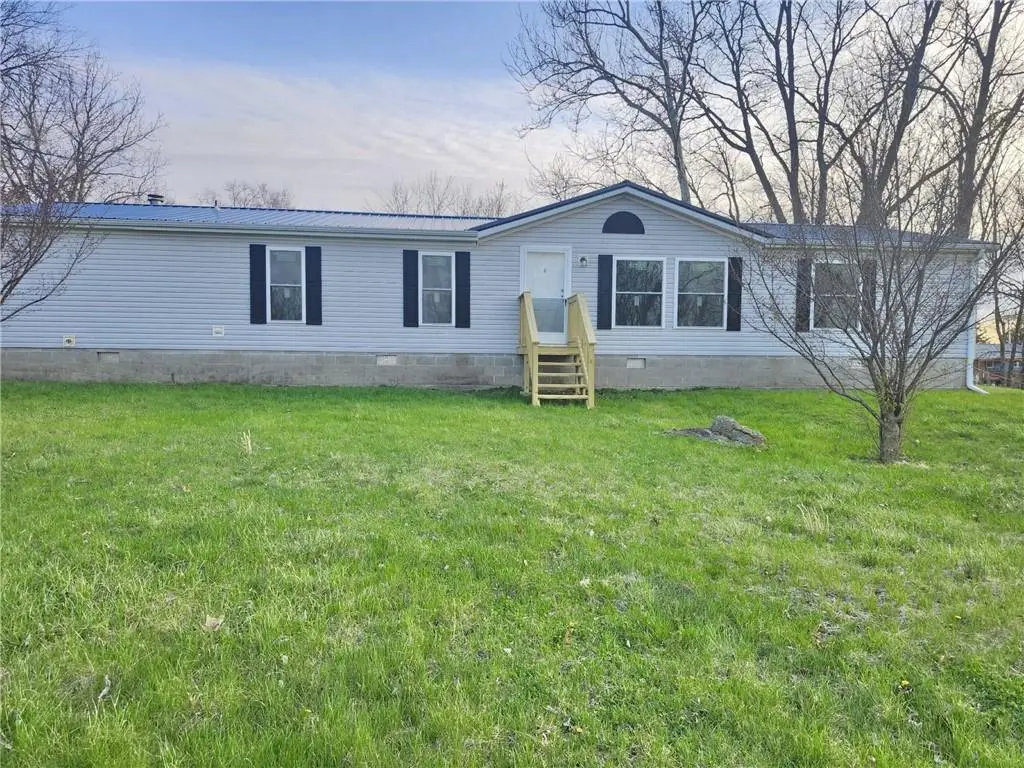
Listing remarks
Move-In Ready Home in Princeton! This beautifully remodeled 1,836 sq. ft. manufactured home offers spacious, single-level living with brand-new updates throughout, including a new metal roof, all new windows, and new flooring. The kitchen features a sliding glass door that leads out to a brand-new deck, perfect for relaxing or entertaining, while both the front and side of the home offer new porches for added outdoor space. A new carport provides convenient covered parking. Inside, you’ll find 3 bedrooms, including a large master suite with an adjoining bath that features both a tub and a separate shower, along with a second full bathroom located near bedrooms 2 and 3. The home offers
Key facts
- 0.7 acre lot
- Built 1998
- Listed 2 days
Neighborhood map
What this means for you Summary
Snapshot
- This is a 3-bed/2.0-bath manufactured listed at $110k.
Deal economics
- At list price, monthly cash flow is $282 ($3k/yr) — positive.
- The deal already cash-flows at list — no discount required.
- Meets the 1% rule at list price ($1k rent vs $110k).
Location & tenants
- Location reads 63/100 on livability (#355 in MO) — a middle-class / working-renter tenant base. Strengths: cost of living A+, crime B+, housing B+; Watch: employment D+, amenities F, commute F.
- Princeton R-V (rural): math 50% / reading 45% proficiency, ranked #158 of 535 in MO (top 30%) — families likely to look elsewhere, expect single-tenant / working-renter base with shorter leases.
- Zoned schools: Princeton R-V Elem. (math 57% / reading 47%, grade C-, #231 of 1,115 statewide, top 24%, 184 students, 43% FRL); Princeton R-V Jr.-Sr. High (math 27% / reading 42%, grade F, #321 of 521 statewide, top 67%, 180 students, 39% FRL).
- Market conditions: 24 active listings in the ZIP.
Forward outlook
- In year one you build about $1k of equity ($760 loan paydown + $644 appreciation (0.6% local appreciation)).
- Mercer County population projected at -18% by 2050 — secular population decline; favor cash flow + early exit over multi-decade hold.
- At projected returns (0.6% appreciation + 3.0% rent growth), your $31k cash investment doubles in ~6 years — after that, you're playing with house money.
Negotiation context
- Only 2 days on market — expect competitive offers; lowballing is unlikely to land.
Questions for the listing agent
- Is there a deadline driving the sale (1031 exchange, divorce, estate, relocation)? That informs how much negotiation room exists.
- What's the average days-on-market for RENTAL listings here right now (not sales)? A rising rental-DOM trend means longer vacancies and softer asking-rent achievability than the comps imply.
- What's the recent tenant-quality profile in this submarket — average credit score on applications, eviction rate, late-payment / NSF rate, and stable-employment percentage? A property-management company in the area should have these aggregated.
- How much new for-sale + rental construction is in the pipeline within 1–3 miles? Heavy new supply typically softens prices + rents 12–24 months out; constrained supply supports both.
Investment metrics
- 1% rule
- 1.10% ✓
- Cap rate
- 9.37%
- Cash-on-cash
- 10.98%
- DSCR
- 1.49
- GRM
- 7.6
CMA / ARV
No comps found within radius.
Projected returns pro-forma
0.59% appreciation · 3.0% rent growth · sell at horizon
- IRR
- 11.6%
- Equity multiple
- 1.58×
- Total profit
- $17,747
- Equity at exit
- $35,167
- IRR
- 15.8%
- Equity multiple
- 2.83×
- Total profit
- $56,372
- Equity at exit
- $44,967
Cash invested: $30,772 (down + closing). Projections, not guarantees.
Landlord ↔ Tenant lean methodology
- Overall (STATE)
- 81 Strongly Landlord-Friendly
- State Missouri
- 81 Strongly Landlord-Friendly · R+10
- County
- — inherits STATE
- City
- — inherits STATE
ZIP-level market 64673
- Home prices YoY
- 0.3%
- Active inventory
- 24
- Price-to-rent
- 7.6×
Monthly cashflow live
- Estimated rent
- $1,209 medium interval (Pro) →
- Mortgage (P&I)
- −$576
- Tax from tax record
- −$51 /mo · $614/yr
- Insurance
- −$46
- HOA
- −$0
- Vacancy / Maint / Mgmt
- −$254
- Net cashflow
- $282
Break-even live
Sensitivity live
| Price | -10% $344 | -5% $313 | +0% $282 | +5% $251 | +10% $219 |
|---|---|---|---|---|---|
| Rent | -10% $186 | -5% $234 | +0% $282 | +5% $329 | +10% $377 |
| Rate | -1.0pp $337 | -0.5pp $310 | base $282 | +0.5pp $253 | +1.0pp $224 |
UW: 25.0% down · 7.5% · 30yr · 1.5% tax · 5.0% vac · 8.0% maint · 8.0% mgmt
Financing live
Cash to close
- Down payment
- $27,475
- Closing costs
- $3,297
- Reserves months
- —
- Total cash needed
- —
Loan-product check · same deal, 3 products live
Conventional
25% down · 7.5% · 30yr
- Down + closing
- —
- Monthly P&I
- —
- Monthly cashflow
- —
- DSCR
- —
- Eligible?
- —
Personal DTI + credit; lowest rate.
DSCR
20% down · 8.5% · 30yr
- Down + closing
- —
- Monthly P&I
- —
- Monthly cashflow
- —
- DSCR
- —
- Eligible?
- —
No personal income docs; deal must DSCR.
Hard money
10% down · 12.0% · 12mo
- Down + closing
- —
- Monthly P&I
- —
- Monthly cashflow
- —
- DSCR
- —
- Eligible?
- —
Short-term bridge; refi at stabilization.
Listing history 2 events
-
2026-04-10status Pending
-
2026-04-08$109,900 Active
ⓘ Source: listings_history table (triggers on properties + properties_extension) + one-shot
backfill from property_details.listing_events for pre-trigger history.
Tax reassessment forecast MO · Resets to sale price
- Current annual tax
- $614 · $51/mo
- Projected year-2 tax
- $1,066 · $89/mo
- Expected delta
- +$452/yr (+$38/mo · 73.6%)
ⓘ Screening estimate from a state-policy table — verify with the county assessor before closing.
Climate risk First Street
- Flood 1/10 Low FEMA zone X (unshaded) · 0% chance over 30 yrs
- Wildfire 4/10 Moderate
- Heat 3/10 Moderate 7 d/yr ≥104°F today · 15 d/yr by 30 yrs out
- Wind 2/10 Low
- Air quality 1/10 Low 0 unhealthy d/yr today · 0 by 30 yrs out
Nearby sold comps map
Loading sold comps map…
Walkable amenities ~0.75 mi
Loading nearby amenities…
Taxation est. · year 1
- Rental income
- $14,505
- − Mortgage interest
- −$6,156
- − Property taxes
- −$614
- − Insurance
- −$550
- − Repairs & maintenance
- −$1,160
- − Management
- −$1,160
- − Depreciation
- −$3,197
- Taxable income
- $1,667
- Est. tax owed @ 24.0%
- −$400
- After-tax cash flow
- $2,979/yr
For passive investors: Depreciation is non-cash, so a rental often shows a tax loss while cash-flowing — sheltering income. Rental losses are passive: they offset passive income freely, and up to $25,000/yr can offset ordinary (W-2) income if you actively participate and your MAGI is under $100k (phasing out to $0 by $150k); unused losses carry forward. On sale, claimed depreciation is recaptured at up to 25%, and gains may owe capital-gains tax (a 1031 exchange can defer both). Figures are a year-1 estimate at your 24.0% rate — not tax advice; consult a CPA.
Schools (NCES district)
- District
- Princeton R-V
- NCES district ID
- 2925590
- Math proficiency
- 50% ▲ 1.00%
- Reading proficiency
- 45% ▲ 1.00%
- Median HH income
- $42,232
- Composite
- 42.1/100
- National rank
- #7042
- State rank
- #158 of 535 in MO
Livability — Princeton
- Score
- 63/100
- State rank
- #355
- US rank
- #15724
Category grades
Schools grade is shown separately in the Schools card above.
Census & demographics
- Census place
- Princeton, MO
- Population (ZIP)
- 2,492
Population outlook (Mercer County) Hauer SSP2
- Today (2025)
- 3,512 people
- By 2030
- 3,383 · -3.7%
- By 2040
- 3,134 · -10.8%
- By 2050
- 2,894 · -17.6%
- By 2075
- 2,397 · -31.7%
- By 2100
- 1,787 · -49.1%
Race, ethnicity, and origin ACS 2023
- Neighborhood character
- Predominantly White (90%)
- Race & ethnicity
- White 90% Hispanic / Latino 5% Two or more races 4%
- Hispanic origin (detail)
- Mexican 4%
- Common ancestry
- Portuguese 2% Lithuanian 1% Slovak 1%
- Foreign-born
- 3% · Canada
- Languages at home
- 94% English-only · Spanish 4% German/W. Germanic 2% Tagalog/Filipino 1%
Political lean MEDSL · Mercer
- 2024 margin
- Solid R (+73.1) · D 13.1% · R 86.2%
- 2008→2024 swing
- -35.9pp toward R · 2008: -37.2pp · 2024: -73.1pp
- All cycles
- 2024: R+73.1 2020: R+74.1 2016: R+73.0 2012: R+54.5 2008: R+37.2
Not yet ingested
- Civics
- —
Market trends
- HPI YoY
- ▲ 0.59%
- Current HPI
- 174.6594
- Rent YoY
- —
- Metro
- —
- State GDP YoY
- ▲ 1.84%
- F500 in state
- 20
Industry mix (Fortune 500 HQ in MO)
| Industry | F500 HQs | Revenue |
|---|---|---|
| Healthcare | 1 | $163B |
|
||
| Insurance | 1 | $21B |
|
||
| Industrial Technology | 1 | $17B |
|
||
| Retail | 1 | $16B |
|
||
| Industrial Distribution | 1 | $10B |
|
||
| Utilities | 1 | $9B |
|
||
Price history
2 events — show timeline
- 2026-04-10 Pending — Heartland MLS as Distributed by MLS Grid
- 2026-04-08 Listed $109,900 Heartland MLS as Distributed by MLS Grid
Property tax history
-1.9%/yrLatest (2024): $614 · +4.2% YoY. Source: county tax records.
Cash-flow waterfall
monthlySold comps — $/sqft
last 12 mo · ≤1 miLoading sold comps…