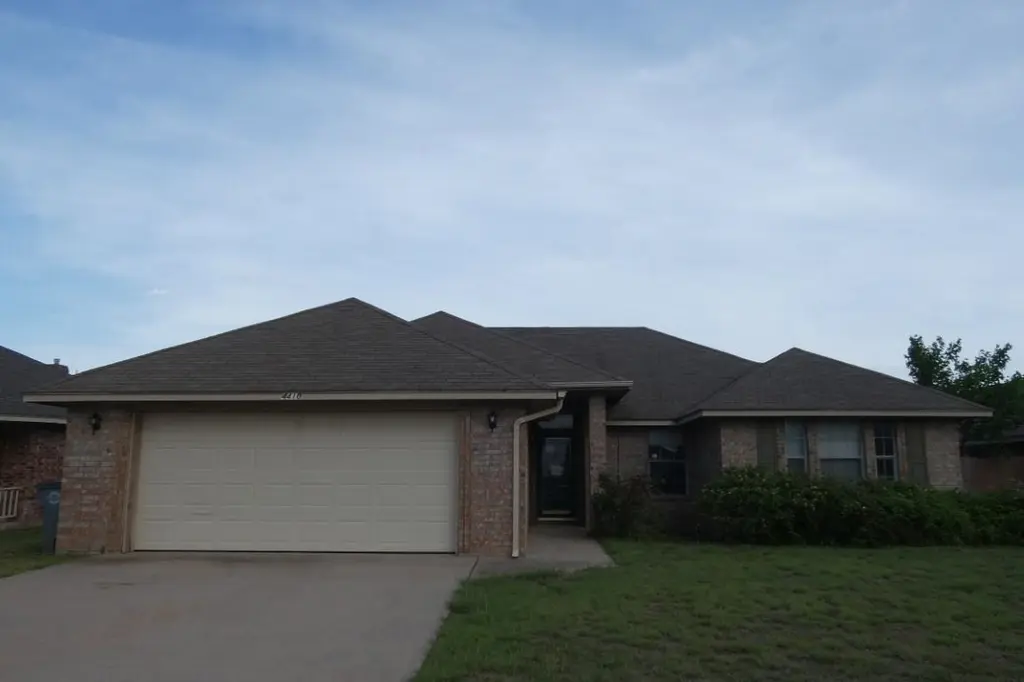
4410 SW Parkway Dr · Lawton, OK
Flood risk 1/10 · Minimal
- FEMA flood zone
- X (unshaded)
- Chance of flooding over 30 yrs
- 0.0%
- Est. flood insurance / yr
- $507 – $1,088
Fire risk 6/10 · Moderate
- Est. fire insurance / yr
- $2,463 – $4,575
Heat risk 7/10 · Major
- Hot days now (above 109°F)
- 7 days/yr
- Hot days in 30 yrs
- 19 days/yr
Wind risk 3/10 · Minor
- Chance of severe wind over 30 yrs
- 6.0%
Air-quality risk 1/10 · Minimal
- Unhealthy air days now
- 0 days/yr
- Unhealthy air days in 30 yrs
- 0 days/yr
Risk factors via First Street. Map © Google.
Why this score? — see what drove the D+ grade
The composite is a weighted blend of 9 inputs, each scored 0–100. Each bar is that input's sub-score; the figure is the points it added to the 100-point composite (weight × sub-score).
- ARV discount +15.0/15.0
- Cash flow +13.8/30.0
- DSCR +4.2/10.0
- 1% rule +3.8/10.0
- Rent growth +3.8/5.0
- Schools +3.5/10.0
- Livability +3.2/5.0
- Condition / age +2.5/5.0
- Appreciation +0.0/10.0
$142,250
🖨 Deal sheet (PDF) 📄 Offer letter ✓ Due diligence
Listing remarks
Tony Capuccio with Capuccio Dream Homes Realty is the property specialist regarding this home. TO VIEW THIS HOME OR DEAL DIRECTLY WITH THE LISTING BROKER CALL OR TEXT TONY at 580-585-2337 or email [email protected]. Attention all DYI specialist. Make this "Diamond in the rough" into the home of your dreams. Create an environment designed to your own personality and taste. Open concept M-I-L floor plan with 3 bedrooms and 2 baths. 2 car garage. Spacious open living with soaring vaulted ceilings. Private master suite with jetted tub, , separate shower, dual vanities and walk-in closet. Close to medical hub and tech school.
Key facts
- 7,475 sq ft lot
- 2 garage spots
- Built 1996
Property features AI
Exterior
- Parking: Detached or attached 2-car garage (2 covered spaces); Driveway; Also has open parking (total 2 parking spaces)
- Utilities: Public water; Public sewer; Electric service
- Home design: Single family residence; One story; Brick veneer exterior
- Construction: Built on slab foundation; Brick veneer construction; Composition roof
- Exterior features: Covered porch; Wood fencing; Composition roof; Public maintained road access; City street frontage; Lot dimensions approximately 65 x 115
Interior
- Kitchen: Dishwasher; Disposal; Refrigerator; Range hood; Electric water heater
- Flooring: Ceramic tile; Vinyl; Carpet
- Bathrooms: 2 full bathrooms
- Heating & cooling: Central heating (electric); Fireplace heating; Central air conditioning; Ceiling fans
- Interior features: Wood-burning fireplace; Range hood
- Laundry & utility: Washer hookup
Neighborhood map
What this means for you Summary
Snapshot
- This is a 3-bed/1.0-bath single-family listed at $142k.
Deal economics
- At list price, monthly cash flow is $12 ($144/yr) — positive.
- The deal already cash-flows at list — no discount required.
- To meet the 1% rule (rent ≥ 1% of price), the offer needs to be $126k (11.7% below list).
- Recommended offer: $126k (11.7% below list) — sets the bar for 1% rule.
Location & tenants
- Location reads 63/100 on livability (#206 in OK) — a middle-class / working-renter tenant base. Strengths: cost of living A+, housing A+; Watch: employment D, crime F, commute F.
- Bishop (urban): math 43% / reading 37% proficiency, ranked #16 of 270 in OK (top 6%) — families likely to look elsewhere, expect single-tenant / working-renter base with shorter leases.
- Zoned schools: Bishop Public School (math 43% / reading 37%, grade F, #102 of 845 statewide, top 12%, 570 students, 0% FRL) — zoned schools average 0% FRL vs 48% district-wide (48 pts lower); this property's tenant base skews higher-income than the district average.
- Market conditions: Rents rising fast (+5.1%/yr); 404 active listings in the ZIP; 133 units permitted in Comanche County in 2024 (0 in 5+ unit buildings).
Forward outlook
- Local home prices are declining (-3.0%/yr); year-one equity from $984 of loan paydown is wiped out by about $4k of value loss. Plan a longer hold.
- Comanche County population projected to shrink 3% by 2050 — rents likely to lag national; underwrite the cash flow, not the appreciation.
Negotiation context
- Only 14 days on market — expect competitive offers; lowballing is unlikely to land.
- 4 sale attempts since 3y ago with the ask held roughly flat each time — persistent listings suggest the price (not the market) is what's stuck; bring a comps-based counter.
Risks & watch-outs
- Climate carrying-cost: major wildfire risk; extreme-heat days projected 7→19/yr by 2055 (HVAC capex compounding) — expect insurance premiums to compound above CPI over the hold.
Questions for the listing agent
- Is there a deadline driving the sale (1031 exchange, divorce, estate, relocation)? That informs how much negotiation room exists.
- Schools are D-rated, which usually means shorter tenancies and higher turnover. Who's the typical renter profile here, and what's been the actual vacancy rate?
- Crime grade is F in this area — have there been break-ins, vandalism, or insurance claims at this property in the last 3 years? What carrier currently insures it and at what premium?
- The area grade is low — what's the realistic commute time and amenity access for the typical tenant pool here? Any planned neighborhood developments (good or bad) we should know about?
- What's the average days-on-market for RENTAL listings here right now (not sales)? A rising rental-DOM trend means longer vacancies and softer asking-rent achievability than the comps imply.
- What's the recent tenant-quality profile in this submarket — average credit score on applications, eviction rate, late-payment / NSF rate, and stable-employment percentage? A property-management company in the area should have these aggregated.
- How much new for-sale + rental construction is in the pipeline within 1–3 miles? Heavy new supply typically softens prices + rents 12–24 months out; constrained supply supports both.
Investment metrics
- 1% rule
- 0.88% ✗
- Cap rate
- 6.39%
- Cash-on-cash
- 0.36%
- DSCR
- 1.02
- GRM
- 9.4
CMA / ARV
- ARV (on-the-fly)
- $216,522
- Comps found
- 12
Show comp detail 12 sales within ~0.75 mi
| Address | Dist | Beds/Ba | Sqft | Sold | Price | $/sf | Match |
|---|---|---|---|---|---|---|---|
| 4133 SW Parkridge Blvd | 0.12mi | 3/2.0 | 1,500 (-4%) | 1mo | $217,000 | $145 | 82 |
| 4702 SW Malcom Rd | 0.18mi | 4/2.0 (+1) | 1,600 (+2%) | 3mo | $210,000 | $131 | 77 |
| 4106 SW Wolf St | 0.16mi | 3/2.5 | 1,500 (-4%) | 5mo | $195,000 | $130 | 75 |
| 4817 SW Malcom Rd | 0.40mi | 3/2.0 | 1,600 (+2%) | 4mo | $240,000 | $150 | 70 |
| 4503 SW Wendy Dr | 0.12mi | 3/2.0 | 1,400 (-11%) | 4mo | $192,500 | $138 | 69 |
| 4306 SW Joanne Ln | 0.19mi | 3/2.0 | 1,400 (-11%) | 5mo | $253,000 | $181 | 65 |
| 3811 SW Hickory Ln | 0.60mi | 3/2.0 | 1,500 (-4%) | 1mo | $179,900 | $120 | 60 |
| 4914 SW Malcom Rd | 0.50mi | 3/2.0 | 1,700 (+8%) | 3mo | $241,000 | $142 | 56 |
| 4408 SW Mesquite Dr | 0.63mi | 3/2.0 | 1,500 (-4%) | 5mo | $202,500 | $135 | 55 |
| 2310 SW Rolling Hills Pl | 0.47mi | 3/2.0 | 1,400 (-11%) | 2mo | $220,000 | $157 | 54 |
| 2413 SW 41st St | 0.55mi | 3/2.0 | 1,400 (-11%) | 2mo | $189,000 | $135 | 50 |
| 4703 SW K Cir | 0.62mi | 3/1.5 | 1,400 (-11%) | 5mo | $154,000 | $110 | 47 |
Match score weights: distance 35% · size 25% · config 20% · recency 20%. Top-matched comps best support the ARV.
Projected returns pro-forma
-3.0% appreciation · 5.14% rent growth · sell at horizon
- IRR
- -13.3%
- Equity multiple
- 0.51×
- Total profit
- $-19,505
- Equity at exit
- $21,210
- IRR
- -1.4%
- Equity multiple
- 0.90×
- Total profit
- $-4,087
- Equity at exit
- $12,299
Cash invested: $39,830 (down + closing). Projections, not guarantees.
Landlord ↔ Tenant lean methodology
- Overall (STATE)
- 83 Strongly Landlord-Friendly
- State Oklahoma
- 83 Strongly Landlord-Friendly · R+20
- County
- — inherits STATE
- City
- — inherits STATE
ZIP-level market 73505
- Rents YoY
- 5.1%
- Active inventory
- 404
- Price-to-rent
- 9.4×
Monthly cashflow live
- Estimated rent
- $1,256 medium interval (Pro) →
- Mortgage (P&I)
- −$746
- Tax from tax record
- −$175 /mo · $2,099/yr
- Insurance
- −$59
- HOA
- −$0
- Vacancy / Maint / Mgmt
- −$264
- Net cashflow
- $12
Break-even live
Sensitivity live
| Price | -10% $93 | -5% $52 | +0% $12 | +5% $-28 | +10% $-68 |
|---|---|---|---|---|---|
| Rent | -10% $-87 | -5% $-38 | +0% $12 | +5% $62 | +10% $111 |
| Rate | -1.0pp $84 | -0.5pp $48 | base $12 | +0.5pp $-25 | +1.0pp $-62 |
UW: 25.0% down · 7.5% · 30yr · 1.5% tax · 5.0% vac · 8.0% maint · 8.0% mgmt
Financing live
Cash to close
- Down payment
- $35,562
- Closing costs
- $4,268
- Reserves months
- —
- Total cash needed
- —
Loan-product check · same deal, 3 products live
Conventional
25% down · 7.5% · 30yr
- Down + closing
- —
- Monthly P&I
- —
- Monthly cashflow
- —
- DSCR
- —
- Eligible?
- —
Personal DTI + credit; lowest rate.
DSCR
20% down · 8.5% · 30yr
- Down + closing
- —
- Monthly P&I
- —
- Monthly cashflow
- —
- DSCR
- —
- Eligible?
- —
No personal income docs; deal must DSCR.
Hard money
10% down · 12.0% · 12mo
- Down + closing
- —
- Monthly P&I
- —
- Monthly cashflow
- —
- DSCR
- —
- Eligible?
- —
Short-term bridge; refi at stabilization.
Listing history 11 events
-
2026-05-19status Pending
-
2026-05-05$142,250 Active
-
2025-04-07historical Active Under Contract
-
2025-02-13status Active
-
2025-02-13price $160,000
-
2024-12-30historical Active Under Contract
-
2024-11-15$75,000 Active
-
2024-01-09historical Active Under Contract
-
2023-12-22$85,000 Active
-
2007-03-15soldstatus $139,500
-
1996-10-08soldstatus $95,000
ⓘ Source: listings_history table (triggers on properties + properties_extension) + one-shot
backfill from property_details.listing_events for pre-trigger history.
Tax reassessment forecast OK · Resets to sale price
- Current annual tax
- $2,099 · $175/mo
- Projected year-2 tax
- $2,099 · $175/mo
- Expected delta
- $0/yr ($0/mo · 0.0%)
ⓘ Screening estimate from a state-policy table — verify with the county assessor before closing.
Climate risk First Street
- Flood 1/10 Low FEMA zone X (unshaded) · 0% chance over 30 yrs
- Wildfire 6/10 Major
- Heat 7/10 Severe 7 d/yr ≥109°F today · 19 d/yr by 30 yrs out
- Wind 3/10 Moderate 6% chance of damaging wind over 30 yrs
- Air quality 1/10 Low 0 unhealthy d/yr today · 0 by 30 yrs out
Nearby sold comps map
Loading sold comps map…
Walkable amenities ~0.75 mi
Loading nearby amenities…
Taxation est. · year 1
- Rental income
- $15,071
- − Mortgage interest
- −$7,968
- − Property taxes
- −$2,099
- − Insurance
- −$711
- − Repairs & maintenance
- −$1,206
- − Management
- −$1,206
- − Depreciation
- −$4,138
- Taxable loss
- −$2,257
- Est. tax savings @ 24.0%
- +$542
- After-tax cash flow
- $686/yr
For passive investors: Depreciation is non-cash, so a rental often shows a tax loss while cash-flowing — sheltering income. Rental losses are passive: they offset passive income freely, and up to $25,000/yr can offset ordinary (W-2) income if you actively participate and your MAGI is under $100k (phasing out to $0 by $150k); unused losses carry forward. On sale, claimed depreciation is recaptured at up to 25%, and gains may owe capital-gains tax (a 1031 exchange can defer both). Figures are a year-1 estimate at your 24.0% rate — not tax advice; consult a CPA.
Schools (NCES district)
- District
- Bishop
- NCES district ID
- 4004470
- Math proficiency
- 43% ▼ -20.00%
- Reading proficiency
- 37% ▼ -19.00%
- Median HH income
- $52,582
- Composite
- 34.77/100
- National rank
- #5123
- State rank
- #16 of 270 in OK
Livability — Lawton
- Score
- 63/100
- State rank
- #206
- US rank
- #15131
Category grades
Schools grade is shown separately in the Schools card above.
Census & demographics
- Census place
- Lawton, OK
- County
- Comanche County · 96,361 people
- City population
- 89,233
- Metro
- Lawton, OK
- Population (ZIP)
- 47,790
- Household income
- $58,272
- Rent vs Own
- Severe rent burden
- 1986.0
Population outlook (Comanche County) Hauer SSP2
- Today (2025)
- 124,518 people
- By 2030
- 124,231 · -0.2%
- By 2040
- 122,193 · -1.9%
- By 2050
- 120,368 · -3.3%
- By 2075
- 120,492 · -3.2%
- By 2100
- 123,113 · -1.1%
Race, ethnicity, and origin ACS 2023
- Neighborhood character
- Diverse neighborhood (Simpson 0.70)
- Race & ethnicity
- White 50% Black 17% Two or more races 16% Hispanic / Latino 16% Native American 4% Asian 3%
- Hispanic origin (detail)
- Mexican 11% Puerto Rican 2%
- Common ancestry
- Lithuanian 2% Slovak 2% Romanian 1%
- Foreign-born
- 6% · Canada, South Korea
- Languages at home
- 88% English-only · Spanish 6% German/W. Germanic 2% Korean 1%
Political lean MEDSL · Comanche
- 2024 margin
- Strong R (+23.3) · D 37.4% · R 60.7% · Other 1.9%
- 2008→2024 swing
- -5.8pp toward R · 2008: -17.5pp · 2024: -23.3pp
- All cycles
- 2024: R+23.3 2020: R+20.1 2016: R+23.7 2012: R+17.0 2008: R+17.5
Not yet ingested
- Civics
- —
Market trends
- HPI YoY
- ▼ -134.88%
- Current HPI
- 169.4524
- Rent YoY
- ▲ 5.14%
- Metro
- Lawton, OK
- State GDP YoY
- ▲ 1.55%
- F500 in state
- 6
Industry mix (Fortune 500 HQ in OK)
| Industry | F500 HQs | Revenue |
|---|---|---|
| Energy | 3 | $48B |
|
||
Price history
+49.7% since first listed11 events — show timeline
- 2026-05-19 Pending — LBRMLS
- 2026-05-05 Listed $142,250 LBRMLS
- 2025-04-07 Contingent — LBRMLS
- 2025-02-13 Relisted — LBRMLS
- 2025-02-13 Price Changed $160,000 LBRMLS
- 2024-12-30 Contingent — LBRMLS
- 2024-11-15 Listed $75,000 LBRMLS
- 2024-01-09 Contingent — LBRMLS
- 2023-12-22 Listed $85,000 LBRMLS
- 2007-03-15 Sold (Public Records) $139,500 Public Records
- 1996-10-08 Sold (Public Records) $95,000 Public Records
Property tax history
+2.8%/yrLatest (2025): $2,099 · +6.2% YoY. Source: county tax records.
Cash-flow waterfall
monthlySold comps — $/sqft
last 12 mo · ≤1 miLoading sold comps…